




Market Recap of October
October was driven by conflict in the Middle East, oil prices and US monetary policy. Attacks on Saudi energy infrastructure pushed Brent crude above USD 115, reviving inflation concerns and reinforcing expectations that the Federal Reserve could raise interest rates again in December.
The Fed held rates at 3.75%–4.00% on 28 October, but two voting officials preferred an immediate increase. With September US consumer inflation at 3.7% and government bond yields near 5%, the policy backdrop supported the dollar and weighed on precious metals and crypto.
Key themes:
- Oil brought inflation risks back into focus. Brent climbed from around USD 100 to almost USD 117 before easing as the US ruled out immediate military action against Iran. Prices remained elevated despite the pullback.
- The Fed held rates but retained a firm tone. The central bank described economic activity as strong while inflation remained elevated, keeping the possibility of further tightening in focus.
- AI earnings faced closer scrutiny. Corporate results provided support for equities, but investors increasingly questioned whether spending on AI would translate into sufficient returns.
These competing factors left markets divided. The dollar and yields stayed firm, gold and Bitcoin weakened, and the S&P 500 remained in a range as technology shares became more volatile.
For latest updates on these highlighted assets, follow our daily market analysis.
Dollar Strength Keeps the Euro Near Support
EURUSD began October near 1.13 and finished close to 1.11, as higher US yields and the Fed’s policy stance supported demand for the dollar.
The European Central Bank held its main interest rate at 2.50% on 29 October, following September’s increase. Still, the Euro struggled for support, with higher energy costs adding pressure to an economy reliant on imported energy. The ECB also announced that Christine Lagarde would step down as president in February 2027.
EURUSD traded mainly between support around 1.11 and resistance near 1.125. Repeated tests of the lower boundary highlighted the pressure on the pair, which remained below its declining 200-period simple moving average near 1.13 on the four-hour chart.
Markets will watch whether incoming inflation and growth data change expectations for the Fed and ECB, and whether EURUSD continues to hold the lower end of its range.
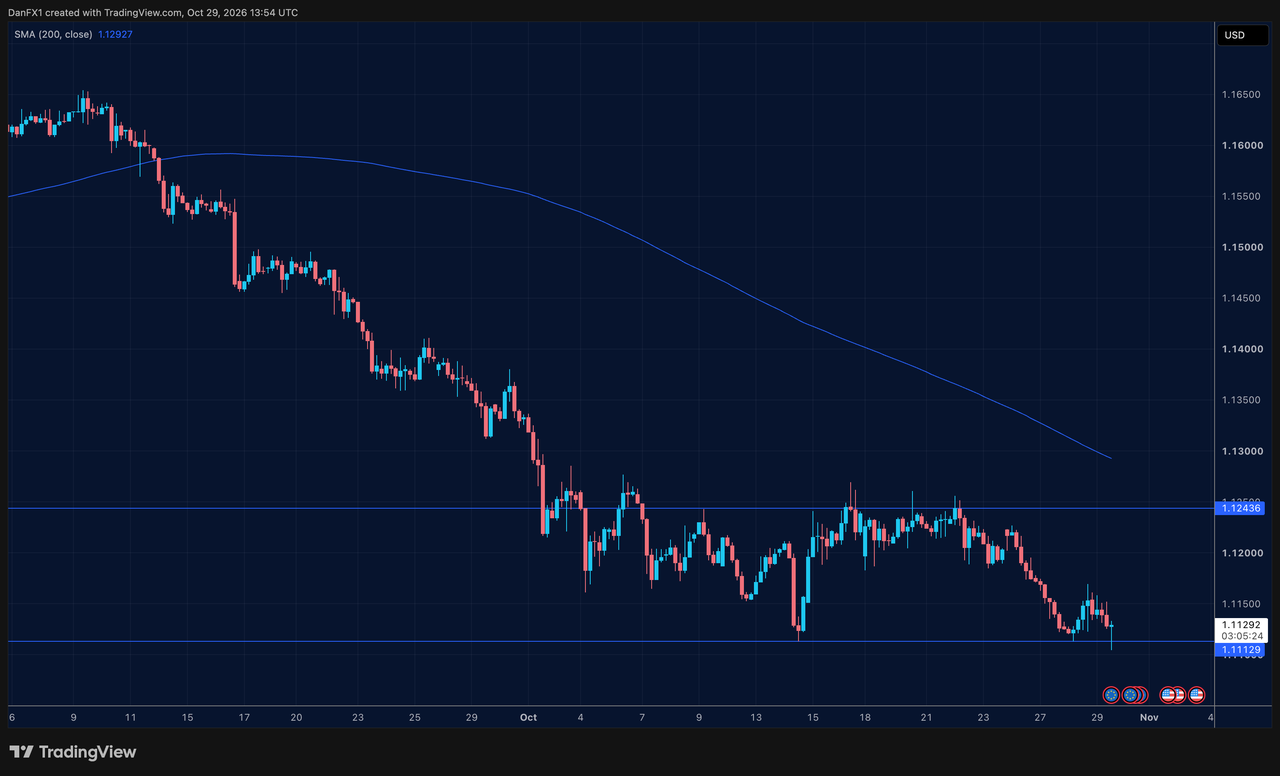
Fig. 1: Four-hour EURUSD chart showing support near 1.11 within a falling trend.
Gold Falls as Yield Pressure Outweighs Haven Demand
Gold started October near USD 4,200 and fell to a three-month low, briefly trading below USD 4,000 in the week before the Fed meeting. That week marked its sharpest decline in around four months.
Demand for safety during the conflict failed to offset the pressure from higher yields and the prospect of further rate increases. Because gold pays no interest, higher returns on government debt increased the cost of holding it. Silver also weakened, falling to its lowest level since November 2025 and more than 50% below its January record.
Gold approached month-end around USD 4,000, below its 200-period moving average and a falling trend line that converged near USD 4,200 on the four-hour chart. Support remained just below USD 4,000.
The next test is whether inflation data and bond yields ease enough to reduce pressure on metals, while geopolitical developments remain a potential source of haven demand.
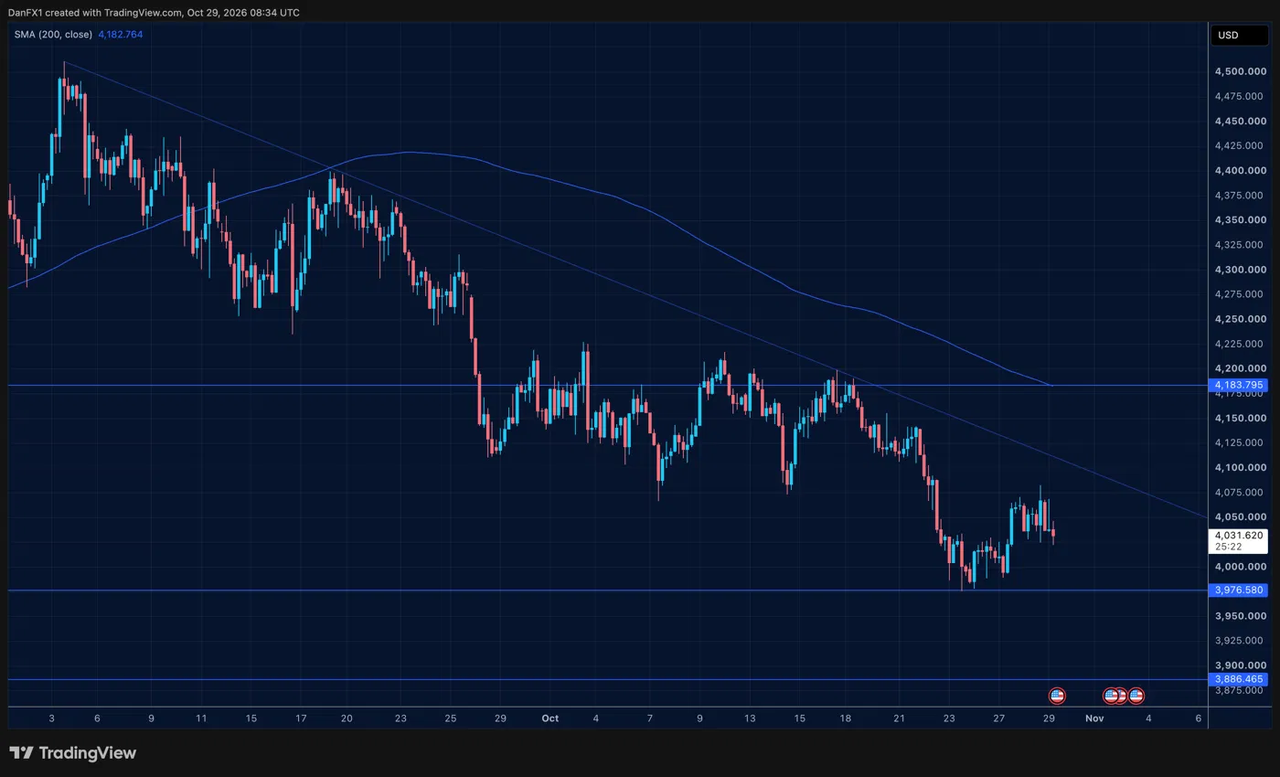
Fig. 2: Four-hour gold chart showing the downtrend and the USD 4,000 area.
Oil Retreats but Supply Risks Remain
Brent crude rose from around USD 100 to almost USD 117 near 23 October, following attacks on Saudi energy sites, including an Aramco-operated oil field. Concerns about supply through key Middle Eastern shipping routes added to the move.
Prices then retreated towards USD 110 after President Trump ruled out immediate military action against Iran. The decline reduced some of the month’s gains but left oil above its starting level. Even so, markets remained uncertain. The New York Times reported that the US and Israel had drawn up plans for renewed attacks on Iran after the November US elections, leaving US-Iran relations and energy supplies unstable.
On the four-hour chart, Brent held above support near USD 108, with its 200-period moving average around USD 105 and resistance near USD 117. Markets will continue to monitor diplomatic developments and any disruption to energy infrastructure or shipping.
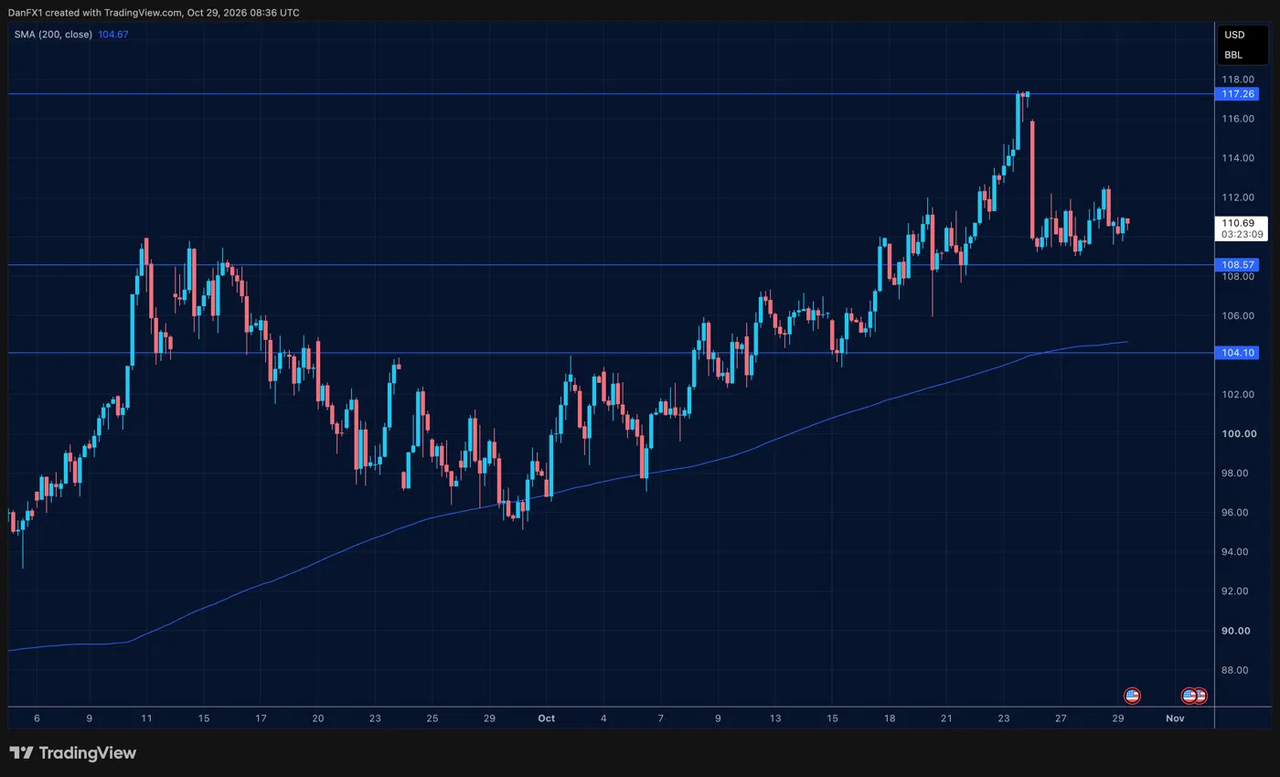
Fig. 3: Four-hour Brent crude chart showing the rise towards USD 117 and subsequent pullback.
AI Earnings Expose Spending Tensions
The S&P 500 traded between roughly 7,600 and 7,800, ending October near the middle of that range and around its 200-period moving average on the four-hour chart. The Nasdaq faced greater pressure in the second half as technology shares reacted to rising oil prices, higher yields and earnings releases.
Company results produced contrasting reactions. SpaceX reported its first profitable quarter, with revenue more than double the previous year’s level, and its shares rose nearly 8% the following day. Meta exceeded expectations, but its shares fell as investors focused on the scale of its AI spending.
Tesla also beat profit and delivery expectations, yet its shares slipped after a lower spending forecast raised concerns about the pace of its AI and robotics ambitions. Elon Musk confirmed that Tesla and SpaceX had established independent committees to examine a possible merger, adding another development for investors to assess.
AI remained an important source of support for equities, although earnings strength alone did not guarantee a positive market reaction. Investors will continue to watch spending guidance, evidence of returns on investment, and developments in the possible Tesla–SpaceX merger.
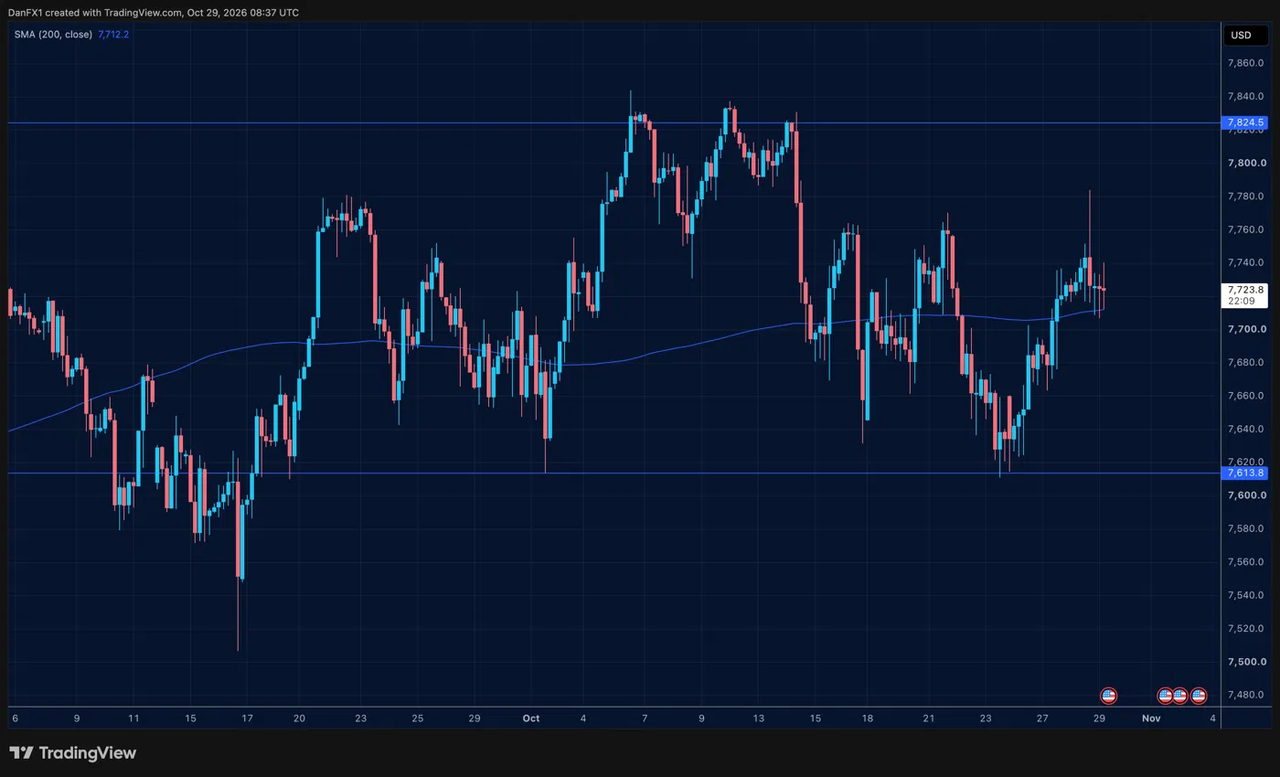
Fig. 4: Four-hour S&P 500 chart showing the range between roughly 7,600 and 7,800.
Bitcoin Retreats Despite ETF Demand
Bitcoin rose towards USD 87,000 early in October before retreating to around USD 80,000 by month-end. Spot Bitcoin exchange-traded funds recorded their largest single-day inflow in a month during mid-October, but the demand failed to reverse the broader decline. Bitcoin moved alongside technology shares as a risk asset, while higher yields added pressure, suggesting that inflows into Bitcoin ETFs were not enough to stop prices from falling.
On the four-hour chart, Bitcoin remained below its 200-period moving average near USD 83,000. The USD 80,000 area remained a focus, with chart support around USD 79,000 and resistance near USD 82,000, followed by USD 84,000–86,000.
Markets will watch whether ETF demand strengthens and whether technology shares stabilise, with USD 79,000 marking the lower boundary of the recent range.
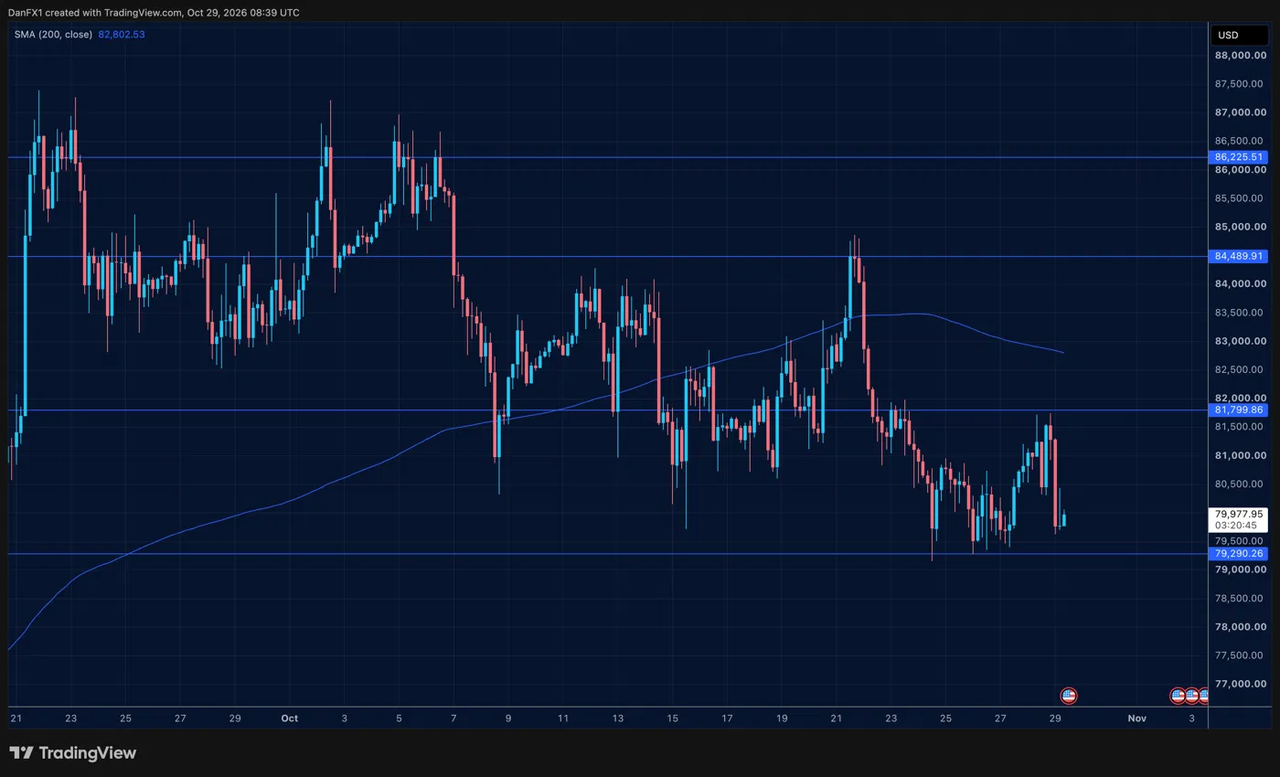
Fig. 5: Four-hour Bitcoin chart showing the retreat from near USD 87,000 towards support around USD 79,000.
Early Signals for November
Energy Supply and the US Elections
The 3 November US midterm elections and developments in the Middle East will be closely watched. Markets will assess whether diplomatic efforts reduce tensions and whether reported plans for renewed military action lead to further escalation. Any disruption to energy supplies or shipping could affect oil prices and inflation expectations, with implications for currencies, bonds and equities.
Inflation Data Shape December Rate Expectations
US employment and inflation releases will help determine whether expectations for a December Fed increase strengthen or fade. A central question is whether October’s higher oil prices feed into subsequent inflation readings. The Fed’s December meeting and updated rate projections remain key reference points, alongside the ECB’s December decision.
AI Spending Faces Further Scrutiny
Investors will continue to assess whether companies can convert AI investment into earnings growth. Spending guidance and market reactions to results will remain relevant, while any developments in a possible Tesla–SpaceX merger could also influence sentiment.
November’s outlook depends on whether energy costs ease, inflation pressure moderates and corporate earnings continue to support valuations. These developments will likely determine whether October’s trends continue, with a strong dollar, weaker metals and crypto, and steady equities.
For a full view of upcoming economic events, check out VT Markets’ Economic Calendar.





