



The most dramatic selling often occurs after markets have already been falling for some time. Investors rush to exit, leveraged positions are closed, volatility rises and losses accelerate. Commentators may describe this as capitulation and begin asking whether the market is finally approaching a bottom.
Then prices rebound.
For traders, this creates a difficult question. Does the rebound indicate that sellers have exhausted themselves and a recovery is developing? Or is it only a temporary rise before the market falls to a new low?
The answer cannot be determined by the size of the rebound alone. Traders must also consider what caused the decline, what intensified the selling, why buying pressure has returned and whether the broader price structure is beginning to improve.
Understanding the relationship between sell-offs, bear markets, capitulation and rebounds can help traders assess these moves without treating every sharp fall as a buying opportunity or every rally as evidence of recovery.
How a market downturn can develop
A market downturn rarely follows a smooth or predictable path. Prices may decline gradually, accelerate as selling pressure builds, rebound sharply and then resume falling.
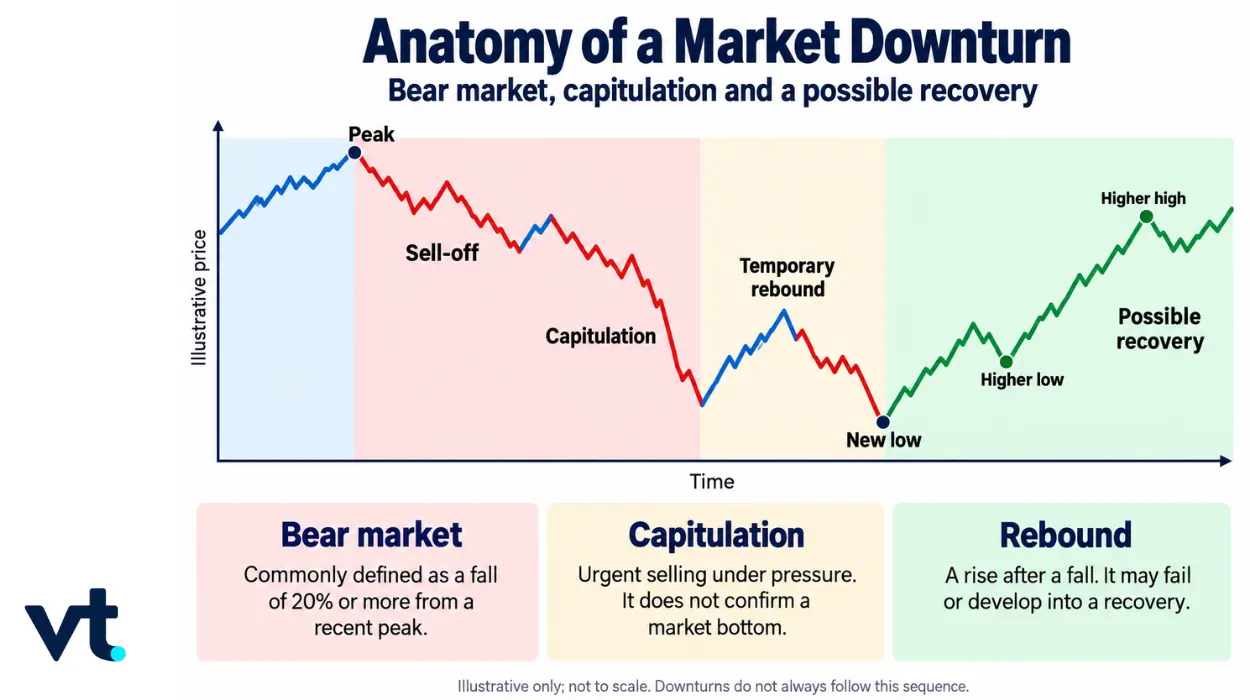
The diagram below illustrates one possible sequence. Prices fall from a peak and enter a broader decline. Selling then becomes increasingly urgent, creating a capitulation phase. A temporary rebound follows, but the market subsequently falls to a new low. A possible recovery begins to emerge only when prices establish a higher low and then advance to a higher high.
The broader fall: from sell-off to bear market
A market downturn may begin with increased selling pressure and develop into a broader, more substantial decline. Although sell-off and bear markets are sometimes used interchangeably, they describe different aspects of that fall.
Sell-off: when selling pressure increases
A market sell-off occurs when strong selling pressure drives prices lower. It might affect a single stock, a specific sector, or the broader market. A sell-off describes what prices and market participants are doing; it does not have a fixed percentage threshold.
Bear market: when the broader decline becomes substantial.
A bear market generally refers to a broad market index falling 20% or more from a recent peak. For example, an index falling from 10,000 to 8,000 has declined 20%. This threshold is a market convention, rather than a signal of when the decline will end. Bear markets can also include sharp rallies. Prices do not need to fall every day for the broader trend to remain weak. This is why a sudden rise, even a substantial one, does not automatically represent a recovery.
When selling becomes urgent: understanding capitulation
As losses deepen, selling may become increasingly urgent. Investors who previously held through the decline may decide that they can no longer tolerate further losses. At the same time, leveraged positions, investor withdrawals and automated risk controls can add to the pressure.
This behaviour is commonly described as capitulation.
Capitulation occurs when market participants abandon positions with unusual urgency, often after already experiencing substantial losses. It may involve:
- Panic selling by investors attempting to avoid further losses.
- Forced liquidation of leveraged positions.
- Funds selling assets to meet investor withdrawals.
- Stop orders triggering as prices cross specified technical levels.
- A sharp rise in volatility as buyers and sellers reassess prices rapidly.
Unlike a bear market, capitulation has no universally accepted percentage decline, trading-volume threshold, or duration. A bear market describes the scale of a decline, while capitulation describes the behaviour and pressure behind the selling.
Capitulation attracts attention because extreme selling can sometimes occur near the end of a declining phase. Once the most urgent sellers have exited, reduced selling pressure may allow prices to rebound.
However, capitulation does not confirm that the market has reached its final low. Prices may rebound temporarily before selling resumes.
Why prices can rebound while conditions remain weak
Prices can begin rising before the economy, company earnings or other fundamental conditions have genuinely improved. A rebound only requires buying pressure to exceed selling pressure temporarily.
Several forces can produce that shift.
Short covering
Traders who previously sold short may buy back positions to close them. This creates buying pressure that can lift prices, even when those traders have not become confident about the market’s longer-term prospects.
When many short sellers attempt to exit at the same time, the resulting buying can contribute to a rapid rebound or short squeeze.
Reduced selling pressure
Forced liquidations and other urgent sales may slow after a period of extreme activity. Prices can rise because fewer participants are selling, even if demand has not strengthened substantially.
This distinction matters. A market can rebound because selling has temporarily subsided, not because investors have developed lasting confidence.
Changing expectations
Markets respond not only to present conditions, but also to expectations about the future. Prices may rise when investors anticipate policy support, lower interest rates, improved liquidity or less restrictive financial conditions.
These expectations can affect prices before any improvement appears in economic or company data.
Better-than-feared news
Earnings or economic data may remain weak while still exceeding pessimistic expectations. If investors had positioned for a worse outcome, information that is merely less negative can produce a sharp positive reaction.
Opportunistic buying
Some investors may consider lower prices attractive and begin purchasing assets despite continued uncertainty. This activity can add to buying pressure without establishing that the broader decline has ended.
Together, these forces can produce a powerful rally while the original pressures behind the downturn remain unresolved. This is why the presence of a rebound is less informative than what happens after it.
Temporary Rebound or Developing Recovery?
A rebound is a rise following a decline. The term describes the direction of prices, but it does not explain how long the move will last or whether the broader trend has changed.
If the rise loses momentum and prices subsequently fall to a new low, the move may be described as a bear-market rally or, more informally and usually in hindsight, a dead cat bounce.
A possible recovery becomes more credible when several forms of evidence begin improving together.
| What to check | Signs of a developing recovery |
| Price structure | A higher low followed by a higher high, rather than a temporary rise followed by a new low. |
| Market participation | Gains broaden across more companies, sectors or asset classes instead of depending on a small group of market leaders. |
| Underlying conditions | The economic, policy, credit, liquidity or company-specific pressures behind the decline begin to ease. |
A rebound supported by several forms of improving evidence may be more durable than one driven mainly by short covering or temporarily reduced selling. Even then, the evidence indicates a possible recovery, not a confirmed market bottom.
The 2008 Financial Crisis: When a Powerful Rebound Failed
The S&P 500‘s path through the 2008 financial crisis illustrates why the first major rally during a bear market does not necessarily mark the beginning of a recovery.
From market peak to bear market
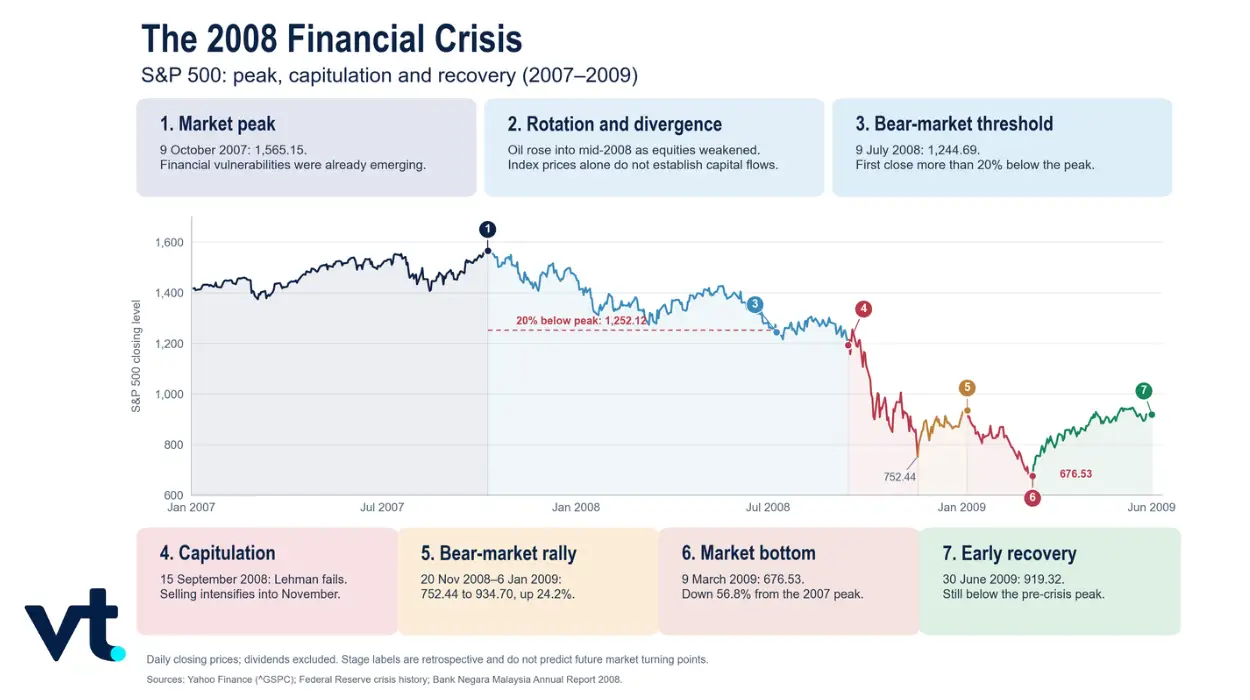
The S&P 500 reached a record closing high of approximately 1,565 on 9 October 2007, even as vulnerabilities in the US housing and mortgage markets were developing.
As financial stress increased, equities weakened. By 9 July 2008, the index had closed near 1,245, more than 20% below its October peak. The decline had therefore met the commonly used definition of a bear market.
The 20% threshold described the size of the fall. It did not indicate that the decline was approaching its end. The most intense period of selling was still ahead.
Capitulation intensifies
The bankruptcy of Lehman Brothers on 15 September 2008 intensified concerns about the stability of the financial system. Investors reduced risk, demand for liquidity increased and market volatility surged.
The S&P 500 fell to approximately 752 by 20 November 2008. The speed and urgency of the selling illustrated several features associated with capitulation: fear, forced deleveraging, liquidity pressure and widespread attempts to reduce exposure.
However, even this severe decline did not establish the final market low.
A 24% rebound fails
From its November closing low, the S&P 500 rebounded to approximately 935 by 6 January 2009, gaining around 24%.
The size of the move could have appeared consistent with the beginning of a recovery. Yet the rally did not end the bear market. Selling resumed, and the index subsequently fell below its November low.
The episode demonstrates why percentage gain alone cannot distinguish a temporary rebound from a lasting recovery. Buyers who assumed that the bottom had passed faced renewed losses. Short sellers who remained positioned against the market during the rebound also faced a substantial adverse move.
The eventual bottom and recovery
The S&P 500 reached a closing low of approximately 677 on 9 March 2009, nearly 57% below its October 2007 peak.
The index subsequently advanced and reached approximately 919 by the end of June. In hindsight, the March low marked the bottom of the bear market. At the time, however, market participants could not know with certainty that the final low had arrived.
The developing price structure provided more useful evidence than the initial size of the rebound. Instead of immediately returning to a new low, the market began sustaining its advance and eventually developed a broader recovery.
The 2020 Market Crash: A Faster Path to Recovery
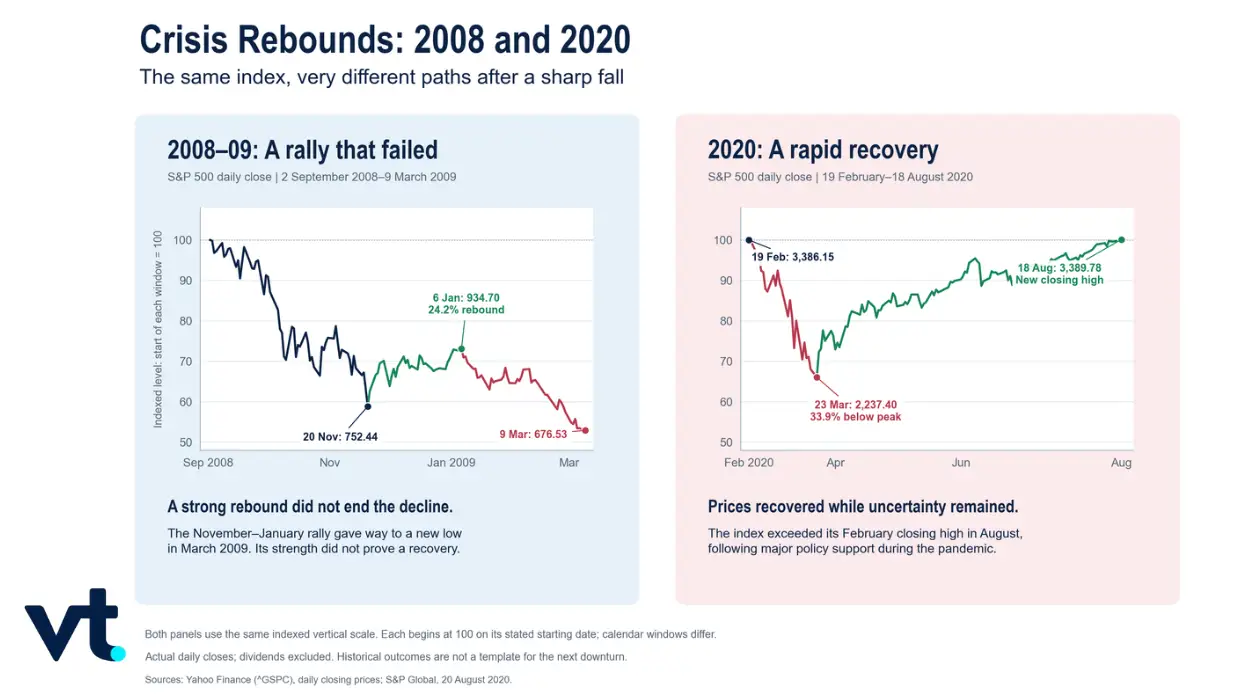
The 2008 financial crisis shows that a substantial rebound can fail. The 2020 market crash demonstrates another possible outcome: a rapid decline can be followed by a relatively fast recovery.
The S&P 500 fell roughly 34% during the early stages of the COVID-19 crisis. However, the index recovered its previous record high by August 2020 amid extensive fiscal and monetary support.
The contrast between 2008 and 2020 shows why traders cannot apply a fixed timetable to market downturns.
In 2008, the financial crisis involved deep vulnerabilities within the banking and credit system. The market experienced repeated waves of selling before it established a lasting low.
In 2020, the decline was unusually rapid, but the scale and speed of the policy response helped change market expectations. Prices recovered even while considerable economic uncertainty remained.
A bear market may therefore contain a rebound that fails, as occurred during the 2008 downturn, or a rebound that develops relatively quickly into a recovery, as occurred in 2020. The difference cannot be determined solely from whether prices have risen over several sessions.
For further historical examples, see ‘Stock Market Crashes in History: What 1987, 2008 and 2020 Teach Traders‘.
How Traders May Respond to Falling and Rebounding Markets
The same market conditions can create different considerations for long-term investors and active traders.
Investors holding shares or funds may experience prolonged drawdowns during a bear market. Some may continue holding based on a longer-term investment plan, while others may reduce exposure or gradually acquire assets at lower prices.
Active traders may attempt to trade either the decline or the rebound. Short positions can potentially benefit from continued falling prices, while long positions may seek to capture a temporary rally or developing recovery.
Neither direction removes uncertainty.
A trader holding a short position may face rapid losses during a bear-market rally or short squeeze. A trader entering a long position may face renewed losses if the rebound fails and the market falls to another low.
The appropriate response therefore depends on more than an opinion about market direction. Traders must also consider time horizon, exposure, position size, product structure and the amount that could be lost if the expected move does not occur.
Before Responding to a Falling or Rebounding Market
A sharp market move can create pressure to act quickly. Before changing exposure, traders can assess the situation through three broader questions: what is driving the move, whether the recovery is gaining support, and what could happen if the assessment proves wrong.
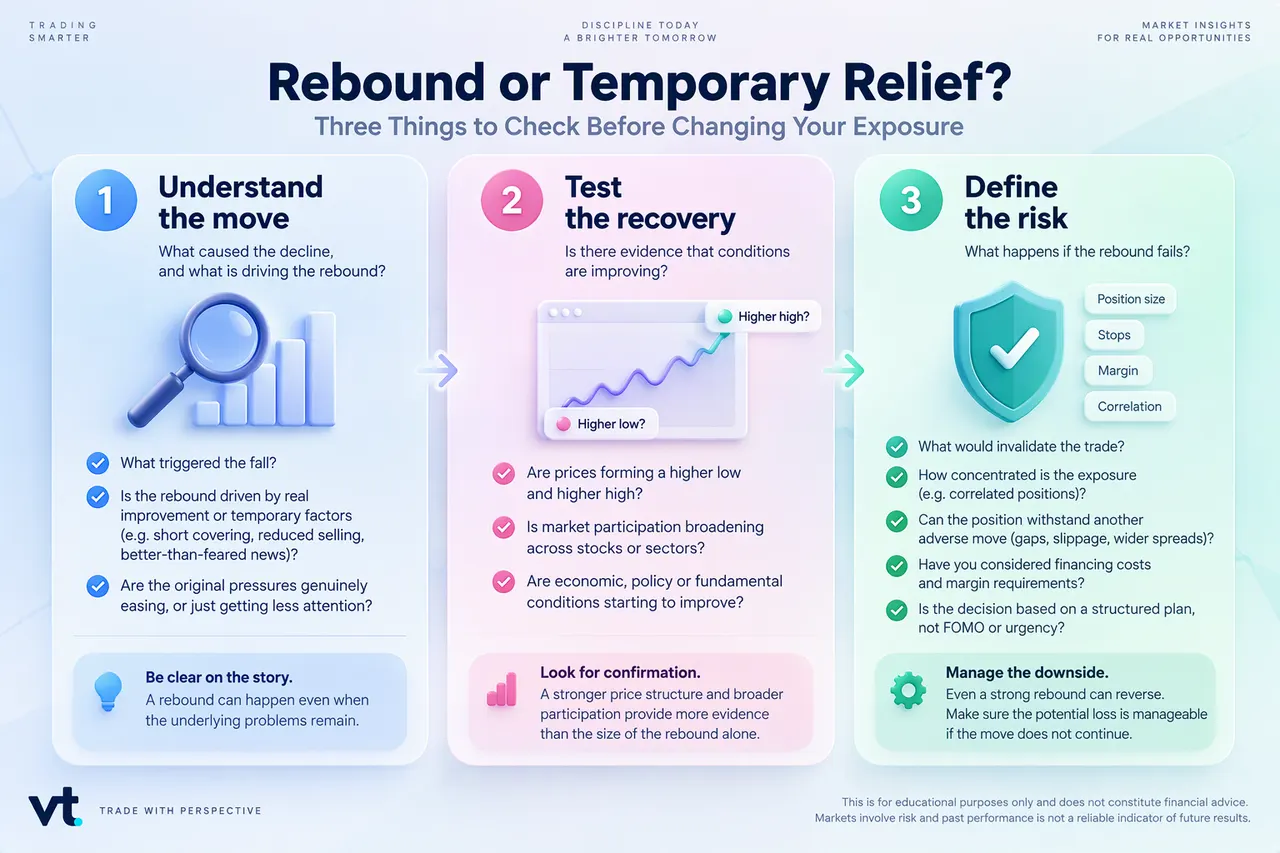
These checks are not intended to confirm a market bottom. Instead, they help traders distinguish between a rebound driven by temporary forces and one supported by improving price structure, broader market participation and easing underlying pressures. The final decision should also account for position size, correlated exposure and the additional risks associated with leveraged CFD positions.
Contracts for difference, or CFDs, allow traders to speculate on price movements without taking physical ownership of the underlying asset. CFDs allow traders to take positions on both falling and rising prices. However, CFDs also use leverage and can produce rapid losses, particularly during the volatile conditions often associated with bear markets and capitulation.
Trading opportunities can also be found in products like inverse ETFs in the markets. Find out more in ‘Markets Are Falling: Should You Hold, Sell, Hedge or Stay Out?‘
Frequently Asked Questions
- What is a market rebound, dead cat bounce, and bear market rally?
A market rebound is a rise in prices after a decline. The word describes the direction of the move without establishing whether it will last. If an index falls from 10,000 to 8,000 and then rises to 8,400, it has rebounded 5% from its low, but remains 16% below its previous peak.
A dead cat bounce is an informal term for a temporary, short-lived rebound after a sharp fall that subsequently fails. Prices rise briefly before the downtrend resumes.
A bear market rally is an advance within a broader bear market. It can be substantial and last for weeks or longer, but it still sits within a wider downward trend.
- Does capitulation mean the market has bottomed?
No. Capitulation can precede a rebound, but further selling and new market lows remain entirely possible. Some market bottoms also form gradually without any dramatic panic event.
- How do you tell a dead cat bounce from a real recovery?
You cannot know with absolute certainty at the outset. Higher lows, broader market participation, and stabilising underlying conditions strengthen the recovery case, but these signals can still fail.
- How long does a bear market rally last?
There is no fixed duration. A rally can last for weeks or even months, and the size of the rally alone does not prove that the broader structural decline has ended.
- Is buying the dip the same as dollar-cost averaging?
No. Buying the dip reacts dynamically to a price drop, whereas dollar-cost averaging invests predetermined amounts at regular fixed intervals regardless of recent price direction. Neither strategy guarantees a profit.



