

Key Takeaways
- The hanging man candlestick pattern is a single-candle bearish reversal signal that forms after a sustained uptrend, characterised by a small body near the top, a long lower shadow, and minimal or no upper shadow.
- A hanging man and a hammer candlestick share the same shape — the difference lies entirely in market context: a hammer appears in a downtrend, a hanging man forms after a strong uptrend.
- According to 2026 research on technical analysis tools, continuation and reversal candlestick patterns show success rates ranging broadly between 56% and over 90% depending on the formation and confirmation method used, underlining why a confirmation candle matters so much.
- Combining a hanging man with volume data and other technical indicators can improve signal reliability by an estimated 15–20%, according to recent quantified strategy research.
- A hanging man candle should never be traded in isolation; it works best as one input within a comprehensive trading strategy alongside support and resistance, moving averages, and volume.
What Is Hanging Man Candlestick? A Plain-English Definition
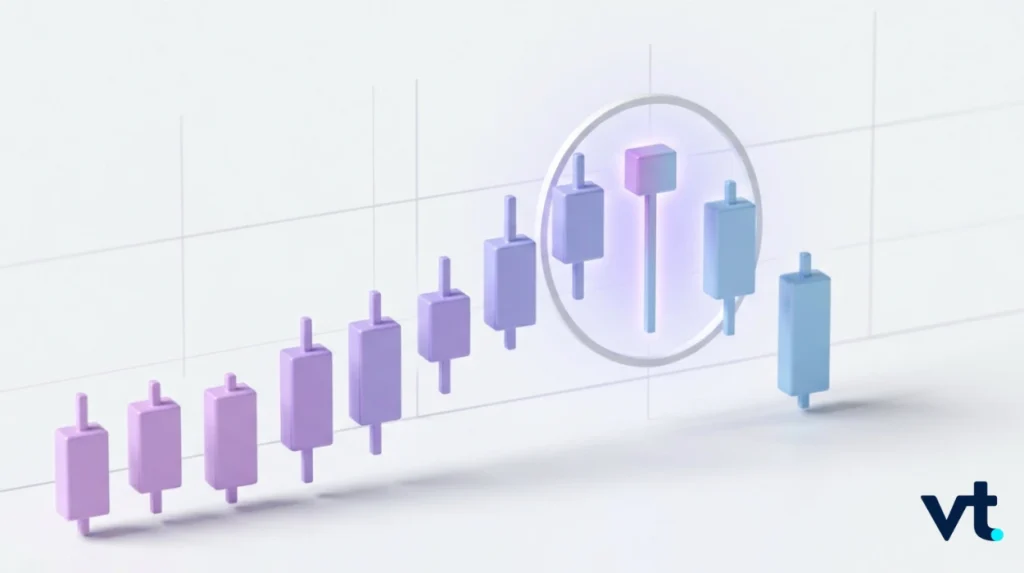
So, what is hanging man candlestick formation exactly? In simple terms, the hanging man is a single-candle bearish reversal pattern that appears at the top of an uptrend and warns of a potential reversal. It earns its name from its appearance: a small real body sitting near the top of the candle’s range, with a long lower shadow dangling beneath it — visually resembling a person hanging by their legs.
The hanging man pattern tells a specific story about price action during that session. Sellers pushed price sharply lower at some point, but by the close buyers managed to recover price back near the opening price, leaving only a small body near the top. On the surface, that sounds like a win for buyers. But appearing after a strong uptrend, it actually reveals something more troubling: sellers had enough strength to drive a significant intraday decline, even if they didn’t ultimately win that session, and if follow-through appears, the pattern can shift the near-term outlook toward a bearish outlook.
The Hanging Man Candlestick: The Single Bearish Signal Traders Almost Always Misread
A trend looks unstoppable. Price continues to climb, sentiment is euphoric, and then one single candle appears that quietly warns the party might be ending. The hanging man candlestick is a single-candle bearish reversal signal that forms after a sustained uptrend, with a small real body near the top of the range, a long lower shadow, and little to no upper shadow – a sign that sellers are starting to test the market’s strength even before the move has clearly turned.
That makes it one of the most recognisable shapes in candlestick patterns and also one of the most misunderstood. Traders and investors who use technical analysis often see it, panic, and exit early — or worse, ignore it entirely and get caught when the reversal actually arrives.
This guide breaks down exactly what the hanging man candlestick formation is, how to read a hanging man candlestick chart properly, how to spot it on live charts, how it differs from similar patterns such as the hammer and shooting star, when confirmation matters, and how traders apply it in different markets and trading strategies.
The Anatomy of a Hanging Man Candle
| Component | Description |
|---|---|
| Real body | Small, located near the top of the candle’s range |
| Lower shadow | Long — typically at least twice the length of the real body |
| Upper shadow | Minimal upper shadow, or none at all |
| Colour | Can be bullish (green) or bearish (red) |
| Location | Appears after a sustained uptrend |
How to Identify a Hanging Man Pattern on Any Chart
Spotting a hanging man correctly on candlestick charts comes down to three structural rules, all of which need to be present together:
- A small real body near the top of the candlestick’s overall range, regardless of whether it closed higher or lower than it opened.
- A long lower shadow, generally at least twice the length of the real body itself — this is the defining visual cue.
- Minimal upper shadow — ideally none, or only a tiny wick above the body.
If any one of these three elements is missing, what you’re looking at probably isn’t a genuine hanging man formation – it might just be a regular bearish candle or a different pattern entirely, such as a doji.
Hanging Man vs Hammer: Same Shape, Completely Different Meaning
This is where most beginner traders trip up. A hanging man and a hammer candlestick pattern look virtually identical: a small body near the top, a long lower shadow, and a minimal upper shadow. So why do they mean opposite things?
The answer is entirely about market context, not shape.
| Factor | Hanging Man | Hammer |
|---|---|---|
| Prior trend | Appears after an uptrend | Appears after a downtrend |
| Signal type | Bearish reversal indicator | Bullish reversal indicator |
| Body colour relevance | Less important than position | Less important than position |
| What it suggests | Hidden selling pressure emerging | Buyers stepping in to defend a low |
A hammer appears at the bottom of a decline and suggests buyers rejected lower prices, hinting at a potential bullish trend reversal. The hanging man, by contrast, appears at the top of a rally and hints that sellers are starting to test the market’s resolve — even though, on that particular candle, buyers managed to push price back up by the close.
Green Hanging Man vs Red Hanging Man: Does Colour Matter?
A common question traders have is whether a green hanging man carries a different meaning to a red, bearish candle closing lower than it opened. The honest answer: colour matters far less than most beginners assume.
- A green hanging man (bullish-coloured body) still signals caution, since the long lower shadow shows sellers managed to drive price down significantly during the session before buyers recovered it.
- A red hanging man candle is generally read as carrying slightly stronger bearish sentiment, and it is also a bearish candlestick, which can reinforce the warning when traders are looking for follow-through, since price actually closed lower than it opened, even though both versions share the same underlying warning.
Either way, the hanging man’s body position and lower shadow length matter far more than whether the candle closed red or green.
Why Does the Hanging Man Matter? The Psychology Behind the Pattern
Understanding why the hanging man pattern bearish signal works requires thinking about what actually happened during that trading session. Price opened at the opening price, sellers pushed it meaningfully lower at some point in the session — creating that long upper shadow’s opposite, the long lower wick — but buyers managed to fight back and close the session near that level or the high.
On the surface, that recovery might look bullish. In reality, after a sustained uptrend, it reveals that sellers were strong enough to create a significant decline intraday, something that hadn’t happened consistently throughout the prior rally. This shift suggests bullish momentum may be fading and that increased selling pressure could be building beneath the surface, even while the broader market trend still technically points upward. That erosion in buying strength can precede a bearish trend if later candles confirm the shift.
The Hanging Man Candlestick Pattern: Why Confirmation Is Essential
Here’s the single most important rule for trading any hanging man candlestick: never act on the pattern alone. A genuine hanging man is only a warning sign, not a guaranteed signal, and treating it as a standalone bearish trigger is one of the most common reasons traders produce false signals in their strategies.
What a Confirmation Candle Looks Like
A confirmation candle is the session (or sessions) immediately after the hanging man formation. Traders typically look for:
- A bearish candle closing below the hanging man’s low, ideally with a meaningful gap down or strong selling volume.
- A close below the midpoint of the hanging man’s real body suggests that subsequent bearish price action is genuinely taking hold.
- Increased trading volume on the confirmation candle, which strengthens the case that increased selling pressure is real rather than a one-session anomaly.
Without this confirmation candle, a hanging man that simply appears and is followed by continued buying should generally be treated as a false signal, not a confirmed bearish reversal.
Hanging Man vs Shooting Star: Don’t Confuse These Two Bearish Patterns
Both the hanging man and the shooting star are single-candle bearish pattern formations that appear at market tops, but their structure is essentially inverted from one another.
| Pattern | Body Location | Shadow Structure |
|---|---|---|
| Hanging Man | Small body near the top | Long lower shadow, minimal upper shadow |
| Shooting Star | Small body near the bottom | Long upper shadow, minimal lower shadow |
| Inverted Hanging Man | Often used informally to describe a shooting-star-like shape | Long upper shadow |
The term ‘inverted hanging man’ is sometimes used informally by traders to describe a shooting star-like formation, since it essentially flips the hanging man’s shadow structure upside down. Both patterns signal a possible bearish reversal, but they reflect slightly different intraday battles between buyers and sellers.
Trading the Hanging Man: A Practical, Cautious Approach
If you’re building a hanging man candlestick chart strategy, treating the pattern as one piece of a broader risk management framework – rather than a trading signal on its own – tends to produce far more consistent results.
A Few Things to Take Note of Before Trading This Pattern
- Wait for confirmation. Acting on the hanging man alone, before a confirmation candle appears, significantly increases the chance of being caught in false signals.
- Context is everything. A hanging man that forms mid-range, rather than after a genuine steady uptrend, carries far less weight and may not represent a real bearish reversal indicator at all.
- Combine with other technical analysis tools. Pairing the pattern with support and resistance levels, moving averages, or volume analysis can meaningfully improve reliability, according to recent quantified research, and traders often use them to judge whether the market is likely to enter a downward trend after confirmation.
- Set sensible stop-loss levels. A common, cautious approach places a stop just above the hanging man’s high, limiting downside if the bullish trend simply continues despite the warning sign.
- Remember candlestick analysis isn’t a guarantee. Even well-confirmed patterns can fail; treating the hanging man as a probability tool rather than a certainty is an important reminder for any trader.
Hanging Man in Different Markets: Forex, Stocks, Commodities, and Indices
One of the more useful things to know about the hanging man candlestick pattern is that it isn’t limited to one asset class. The same psychology — fading bullish momentum at the top of a rally — plays out across forex, equities, commodities, and indices alike, since candlestick patterns reflect universal trader behaviour rather than anything specific to a single market.
This versatility is part of why the hanging man pattern remains a staple of technical analysis education in 2026, taught alongside other single-candle formations like the doji, the shooting star, and various hammer candlestick patterns as part of a trader’s foundational toolkit.
Learn more about Chart Patterns Guide: Master Market Signals for Better Trading
Putting the Hanging Man Pattern Into Practice
Once you can confidently identify a hanging man appears scenario, confirm it with a follow-up candle, and frame your risk management around it, the pattern becomes a genuinely useful addition to a broader trading approach — particularly when reacting to fast-moving sessions around major economic releases.
Start Online CFD Trading with VT Markets Today
If you’re ready to put your understanding of candlestick patterns like the hanging man to work in live markets, VT Markets provides access to tools and platforms to help you get started. Trade on powerful platforms like MetaTrader 4 (MT4) and MetaTrader 5 (MT5), designed for speed, reliability, and advanced trading features — exactly what you need when a fresh hanging man candlestick appears and financial markets move fast.
New to trading? Practise risk-free with a VT Markets demo account before committing to a live account – ideal for simulating reactions to candlestick reversal signals across currency pairs, indices, and commodities without financial risk.
Open your live account with VT Markets today and access secure, transparent, and competitive CFD trading across some of the world’s most popular markets.
Frequently Asked Questions About the Hanging Man Candlestick
1. What is a hanging man candlestick pattern, in simple terms?
A hanging man candlestick pattern is a single-candle bearish reversal signal that appears after an uptrend, recognisable by a small body near the top, a long lower shadow at least twice the length of the body, and little to no upper shadow.
2. Is the hanging man pattern always bearish?
A genuine hanging man is generally considered a bearish signal, but it’s a warning rather than a guarantee. Without a confirmation candle closing below the pattern’s low, the bullish trend can simply continue, making the formation a potential bearish reversal rather than a confirmed one.
3. What’s the difference between a hanging man and a hammer candlestick?
A hanging man and a hammer candlestick share the same shape: a small body, long lower shadow, minimal upper shadow. The difference is entirely about market context: a hammer forms after a downtrend and suggests a potential bullish reversal, while a hanging man forms after an uptrend and suggests a possible bearish reversal.
4. Do I need confirmation before trading a hanging man pattern?
Yes. Trading a hanging man without waiting for a confirmation candle — typically a bearish candle that closes below the pattern’s low — significantly raises the risk of acting on false signals, as the uptrend can resume immediately after the pattern appears.
Final Thoughts on the Hanging Man Candlestick
The hanging man candlestick remains one of the most genuinely useful single-candle warning signs in technical analysis, precisely because it captures a subtle shift in market psychology that’s easy to miss otherwise: the first sign that sellers are testing a market’s resolve, even while price still technically closes near its highs. Used correctly—with proper confirmation, sensible risk management, and an awareness of the broader overall market trend—the hanging man can be a valuable addition to any trader’s technical analysis tools. Used in isolation, it’s just one small, easily misread candle among thousands.


