




Cryptocurrency markets are no strangers to volatility. Yet when prices fall sharply and rebounds prove short-lived, even experienced traders can find themselves questioning whether the worst is over.
The recent crypto market sell-off has brought that uncertainty back into focus. With Bitcoin retreating towards $62,000 in November 2026 and selling pressure extending across major altcoins, traders are navigating a market where sentiment can shift as quickly as prices. What looks like the beginning of a recovery one day may give way to another decline the next.
And with every new low comes a familiar question: Has the market finally found its bottom?
The temptation of catching the bottom.
For traders, the appeal is understandable. Buying near the lowest point of a decline offers the possibility of capturing more of the subsequent recovery. For those taking short positions, correctly identifying the bottom can be just as important, since a sudden rebound could quickly erode gains from a falling market.
Yet the difficulty lies in knowing whether the lowest price has actually been reached.
A market bottom is typically easier to identify in hindsight, once subsequent price action shows buyers have regained control. In real time, however, what appears to be a turning point may simply be a temporary pause before another decline.
This distinction matters in cryptocurrency markets, where significant price movements can unfold within a single trading session. The challenge is not necessarily predicting where prices might go next. It is deciding how much evidence is sufficient to act on that prediction.
Every trader dreams of the perfect entry
The pursuit of a market bottom is not purely a technical exercise. It is also psychological. When an asset falls sharply from a previous high, traders may begin to view it as undervalued simply because it is cheaper than before. Fear of missing out can reinforce the impulse, particularly when a sudden rebound creates the impression that the opportunity is slipping away.
Three common behavioural tendencies can influence these decisions:
| Trading tendency | How it can affect bottom-hunting |
| Anchoring | Treating a previous high as a reference for what the asset should be worth. |
| Fear of missing out (FOMO) | Entering prematurely because a rebound appears to be underway. |
| Overconfidence | Assuming a support level or indicator can reliably predict the turning point. |
Explore more: How Emotions Affect Traders in Falling Markets
The same psychological challenge applies to traders considering short positions. Entering after an extended decline may leave limited room for further downside while increasing exposure to a sharp rebound.
In both directions, the search for the perfect entry can distract from more important considerations: the conditions supporting a trade, the circumstances that would invalidate it, and the amount of risk a trader is prepared to accept.
Why crypto makes bottom-hunting harder
Cryptocurrency markets can intensify these behavioural pressures.
Unlike traditional equity markets with defined trading sessions, cryptocurrencies trade around the clock. Price movements continue through weekends and across global time zones, creating frequent opportunities for traders to reassess their positions.
Volatility adds another complication. A sharp intraday recovery can appear to signal renewed buying interest, even when the broader market remains under pressure.
This is where timeframe becomes important.
An asset may appear to be recovering on an hourly chart while continuing to form lower highs and lower lows over several days or weeks. Both observations can be valid, but they describe different aspects of the market.
Technical indicators may also offer conflicting signals. Momentum can improve before price establishes a sustained recovery, while news or changes in market sentiment can interrupt an otherwise promising setup.
Three recent examples from Bitcoin, Solana and Hyperliquid illustrate why these distinctions matter.
BTCUSD: When a rebound is not necessarily a reversal
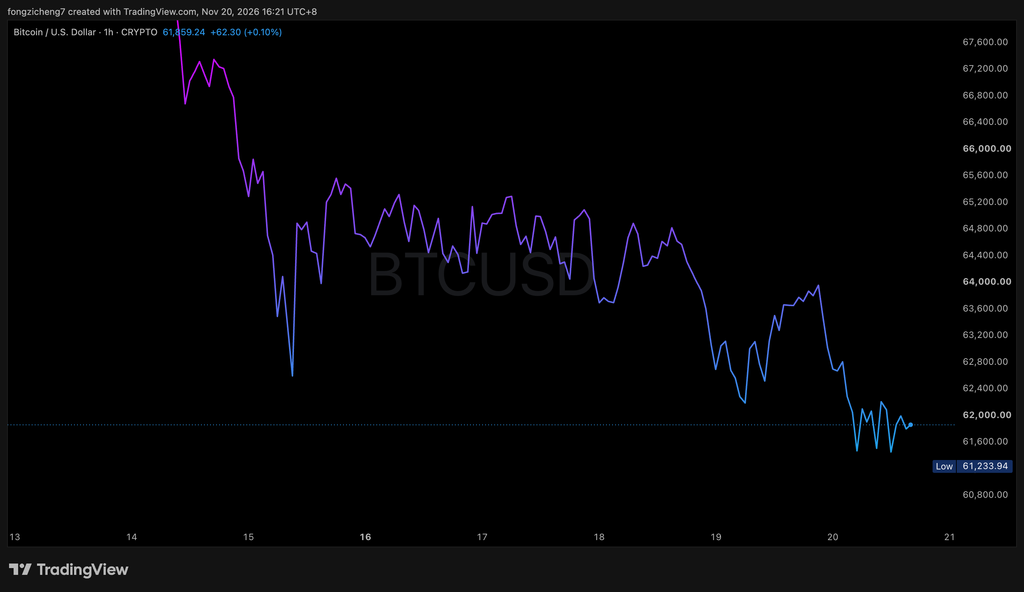
Bitcoin’s hourly price action this week offers a useful example of how quickly market expectations can change. The decline was not uninterrupted. Several upward movements appeared along the way, including rebounds after prices approached the lower end of the range.
For traders attempting to identify a bottom, each rebound could have appeared encouraging. Yet these recoveries did not immediately restore the earlier upward momentum.
The important technical distinction is between a temporary bounce and a change in market structure.
A series of lower highs and lower lows following a peak can suggest that sellers remain in control. A recovery above a recent swing high may begin to challenge that structure, but further price action is needed to assess whether the change can be sustained.
Bitcoin’s example highlights a common difficulty: the first rebound after a sharp decline may be an opportunity, but it is not proof that the decline has ended.
SOLUSD: When momentum improves but the trend remains weak
Solana offers another perspective on the difficulty of identifying a market bottom: the difference between weakening selling momentum and a confirmed price reversal.
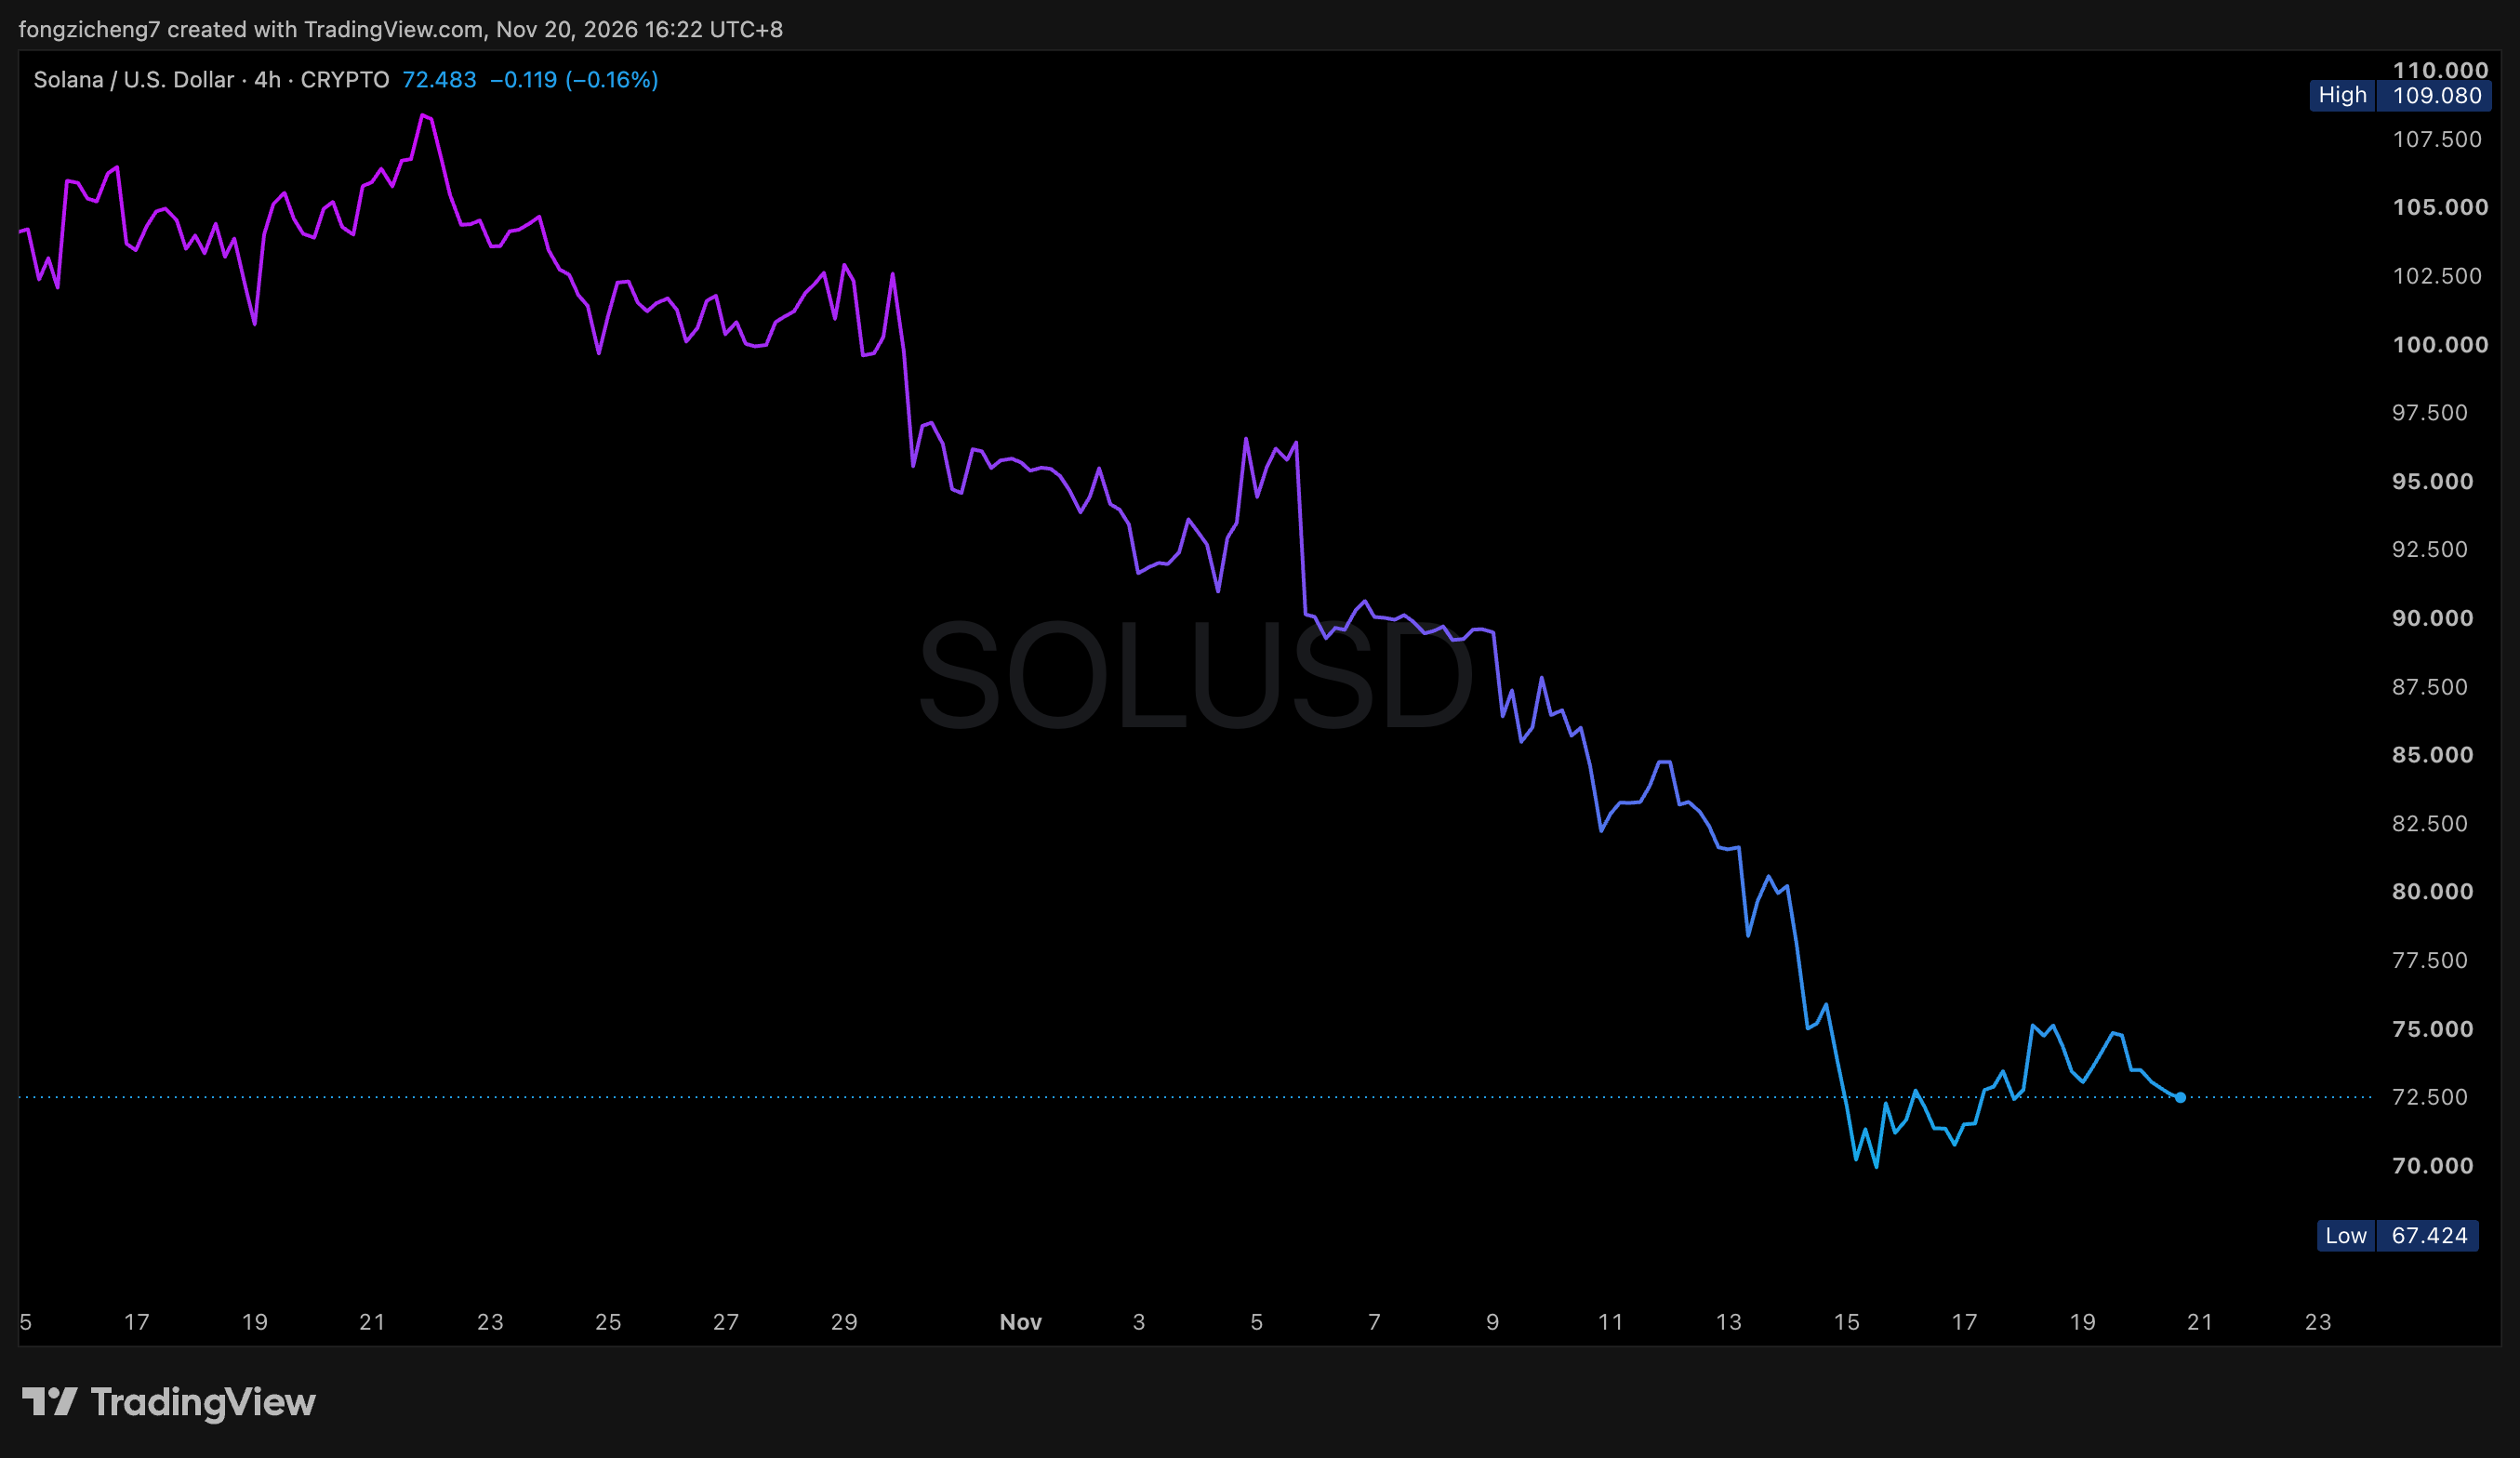
Across the broader observation period, SOLUSD declined from levels around $120 towards $80, with intermittent rebounds failing to establish a sustained recovery.
The shorter-term chart from November 7–9 presents a more complicated picture.
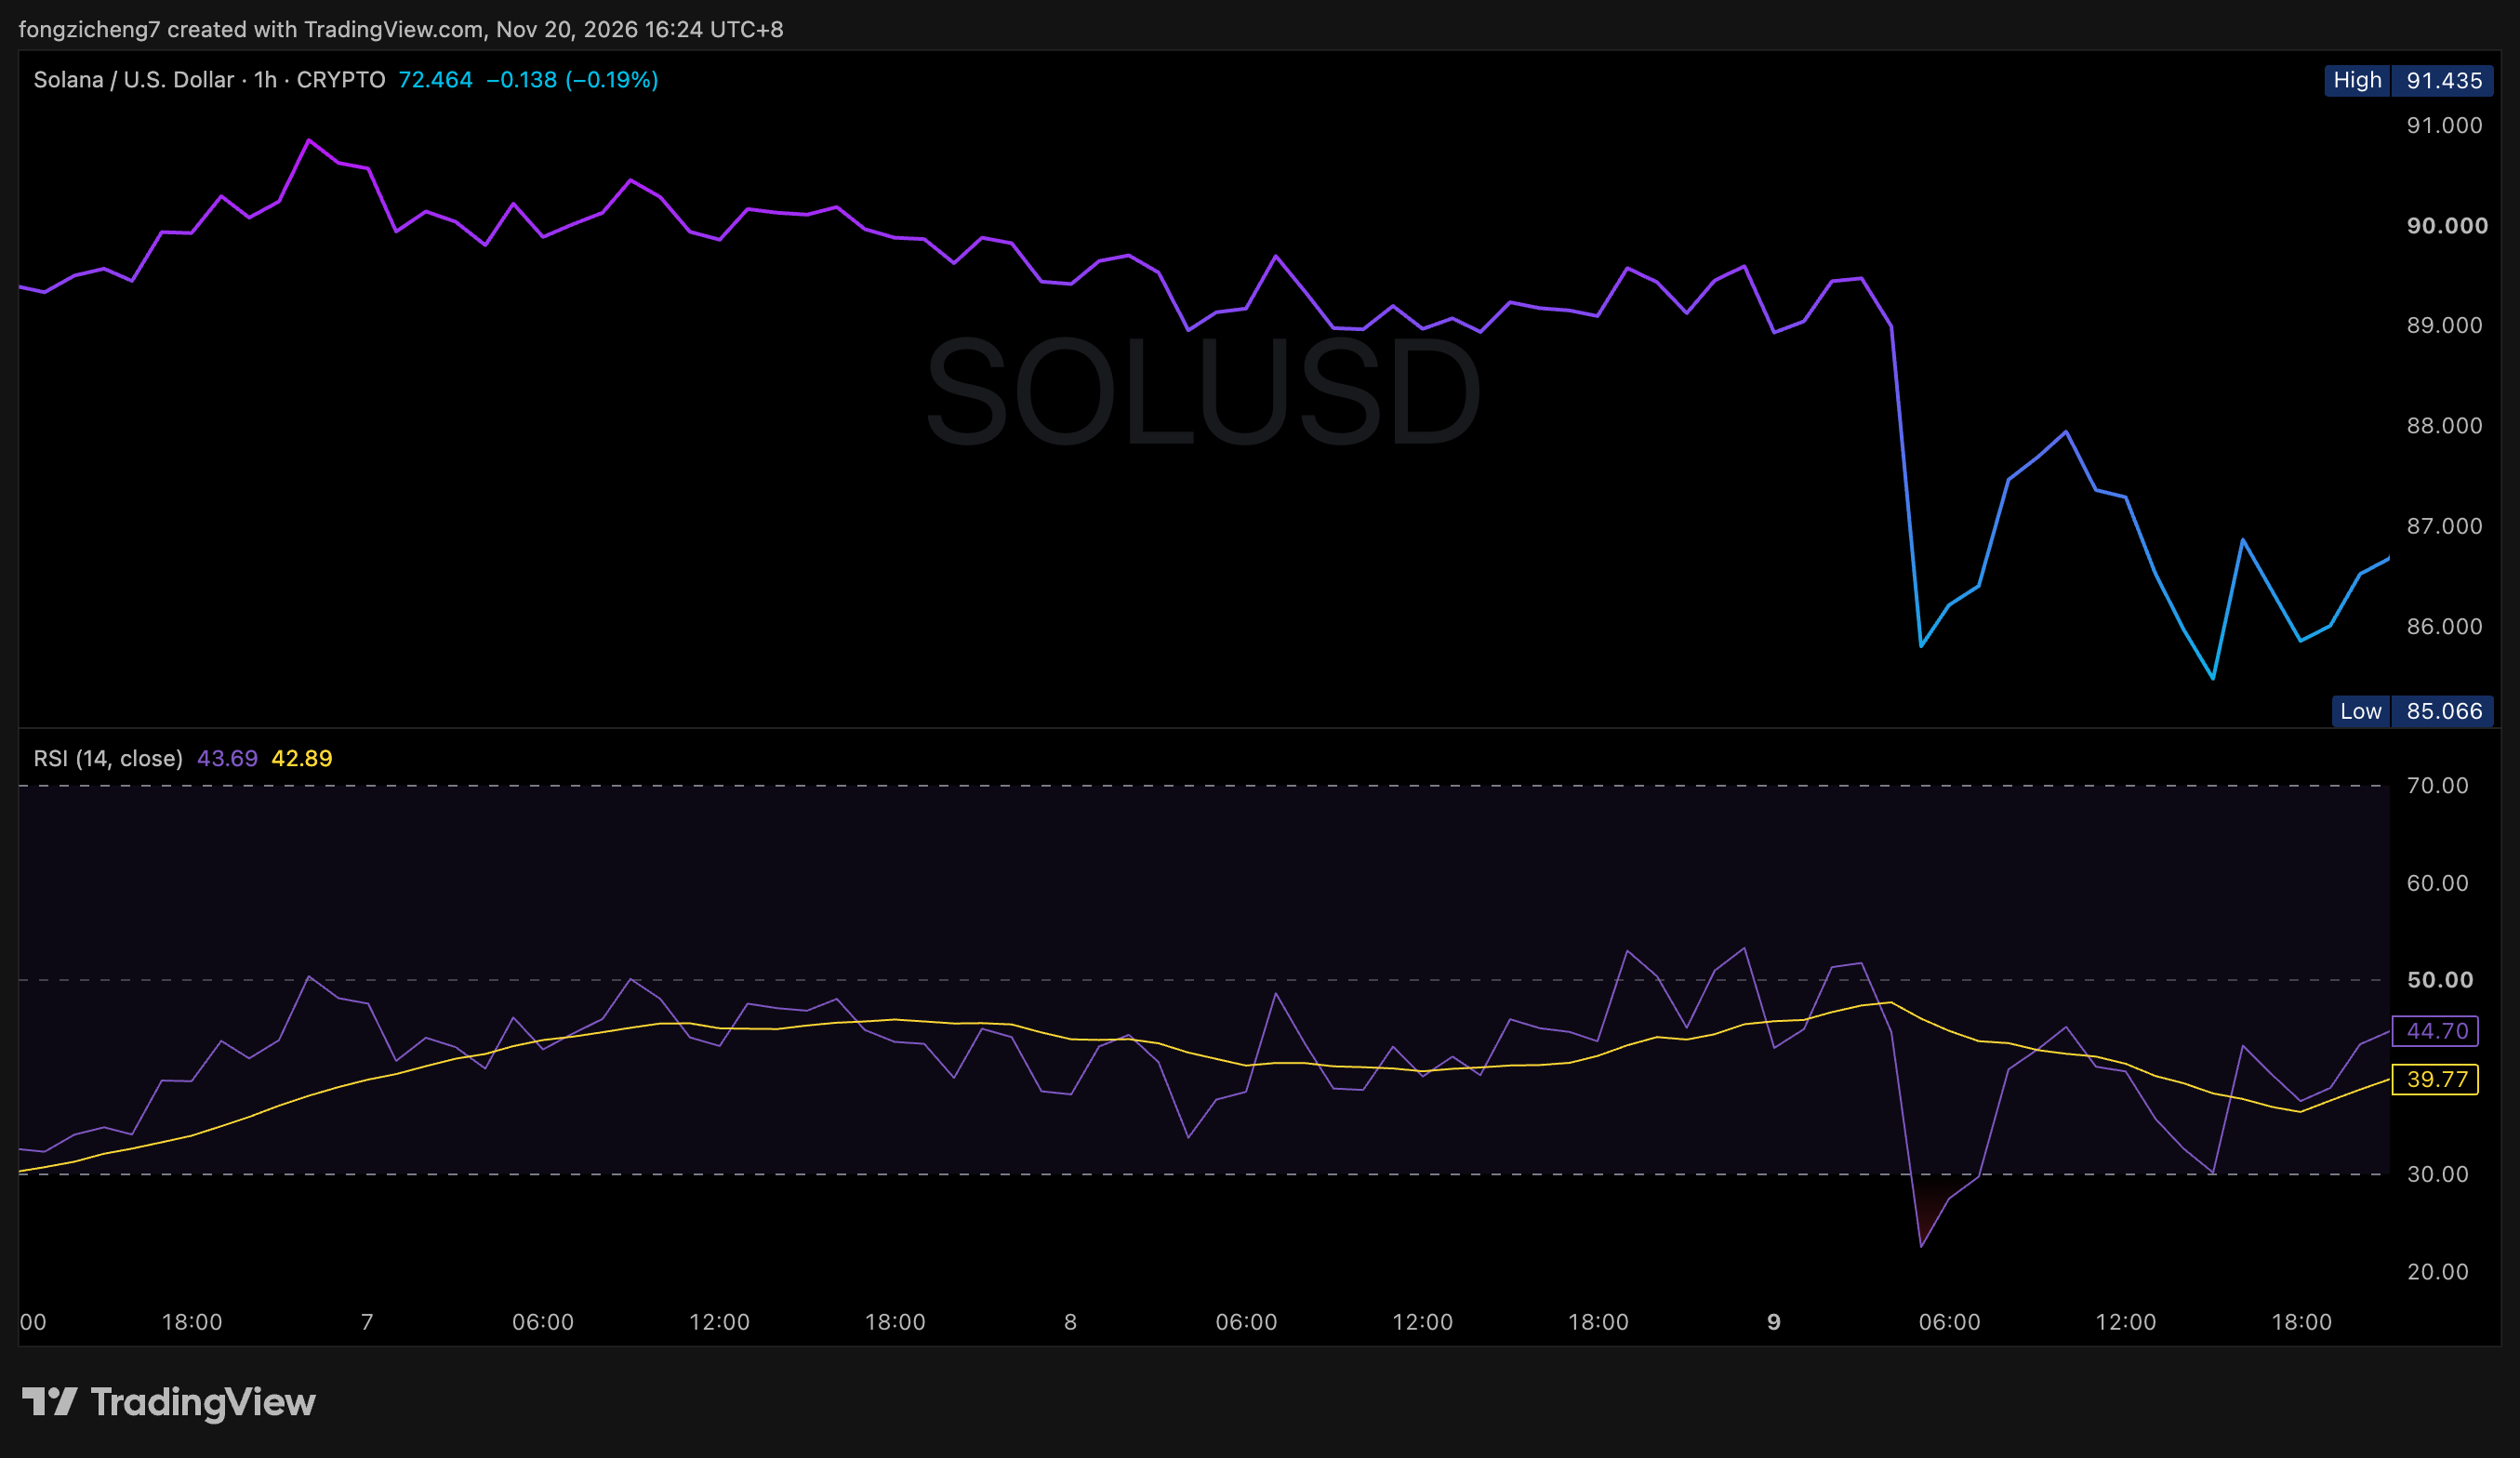
Following a sharp fall from approximately $89 to below $86, SOL experienced several attempts to rebound towards the $87–88 area.
Meanwhile, its Relative Strength Index (RSI), a momentum indicator used to assess the speed and magnitude of price changes, recovered from a low reading. An improving RSI can suggest that downward momentum is easing. However, it does not necessarily mean buyers have gained sufficient control to reverse the prevailing trend.
This is particularly important when traders interpret momentum indicators as early evidence of a bottom.
Even a bullish RSI divergence, where price records a lower low while RSI forms a higher low, is generally better understood as a potential warning of weakening selling momentum than as a guaranteed reversal signal.
In Solana’s case, the hourly chart illustrates a recovery in momentum, while the wider chart shows why a broader trend assessment remains necessary. The lesson is that an indicator may suggest conditions are changing before the price structure confirms that a recovery is underway.
HYPEUSD: When a sharp rally fails to change the bigger picture
Hyperliquid’s HYPE token introduces another consideration: the interaction between sharp price movements, market expectations and the broader trend.
The four-hour chart shows HYPE experiencing a pronounced rally towards $96 in late October, followed by an extended decline towards the $65 region in November.
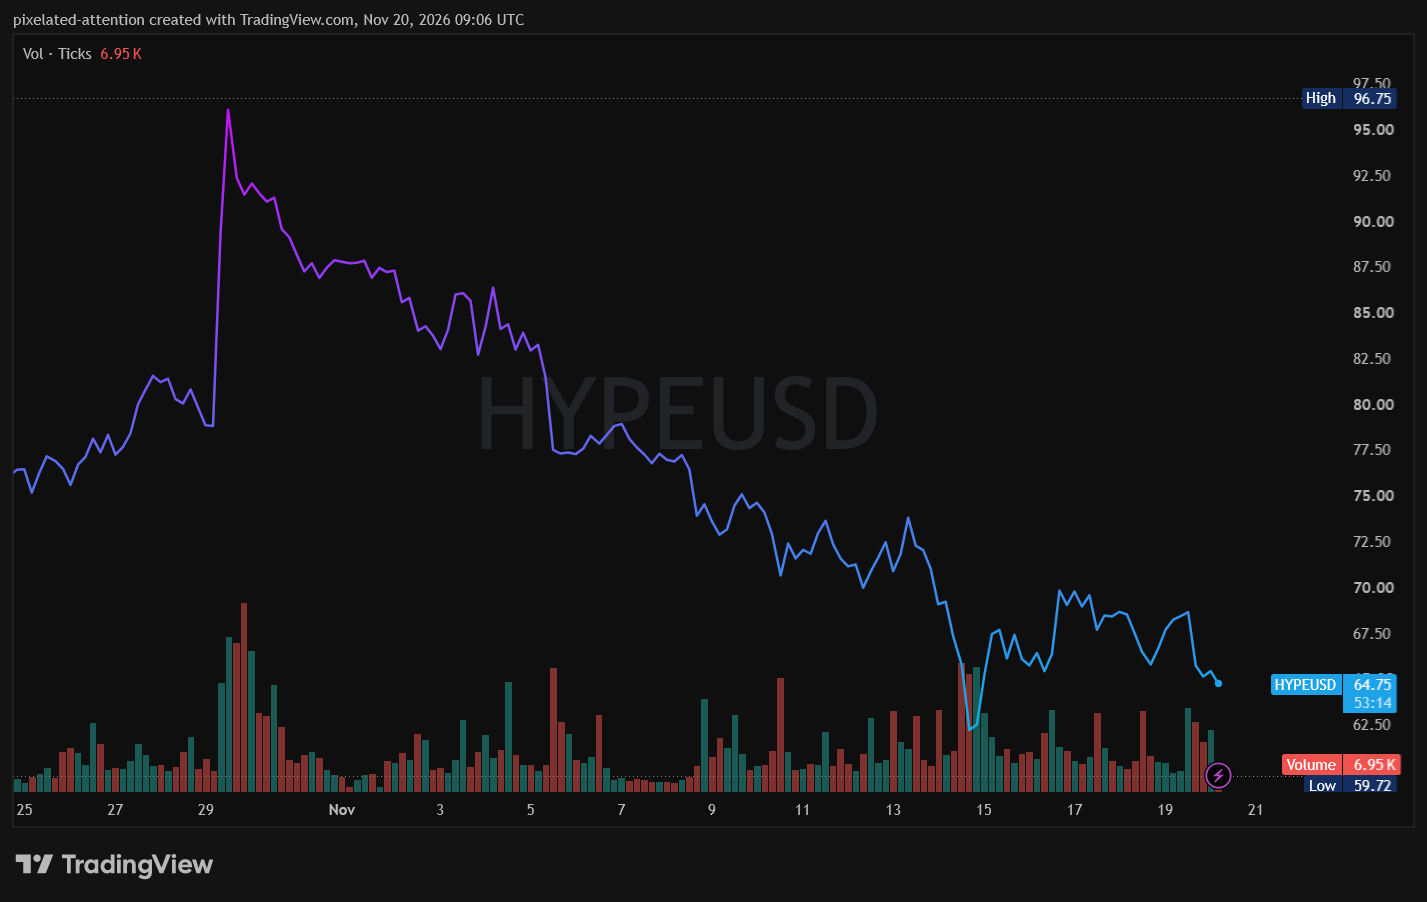
Despite intermittent recoveries, the wider price structure continued to weaken.
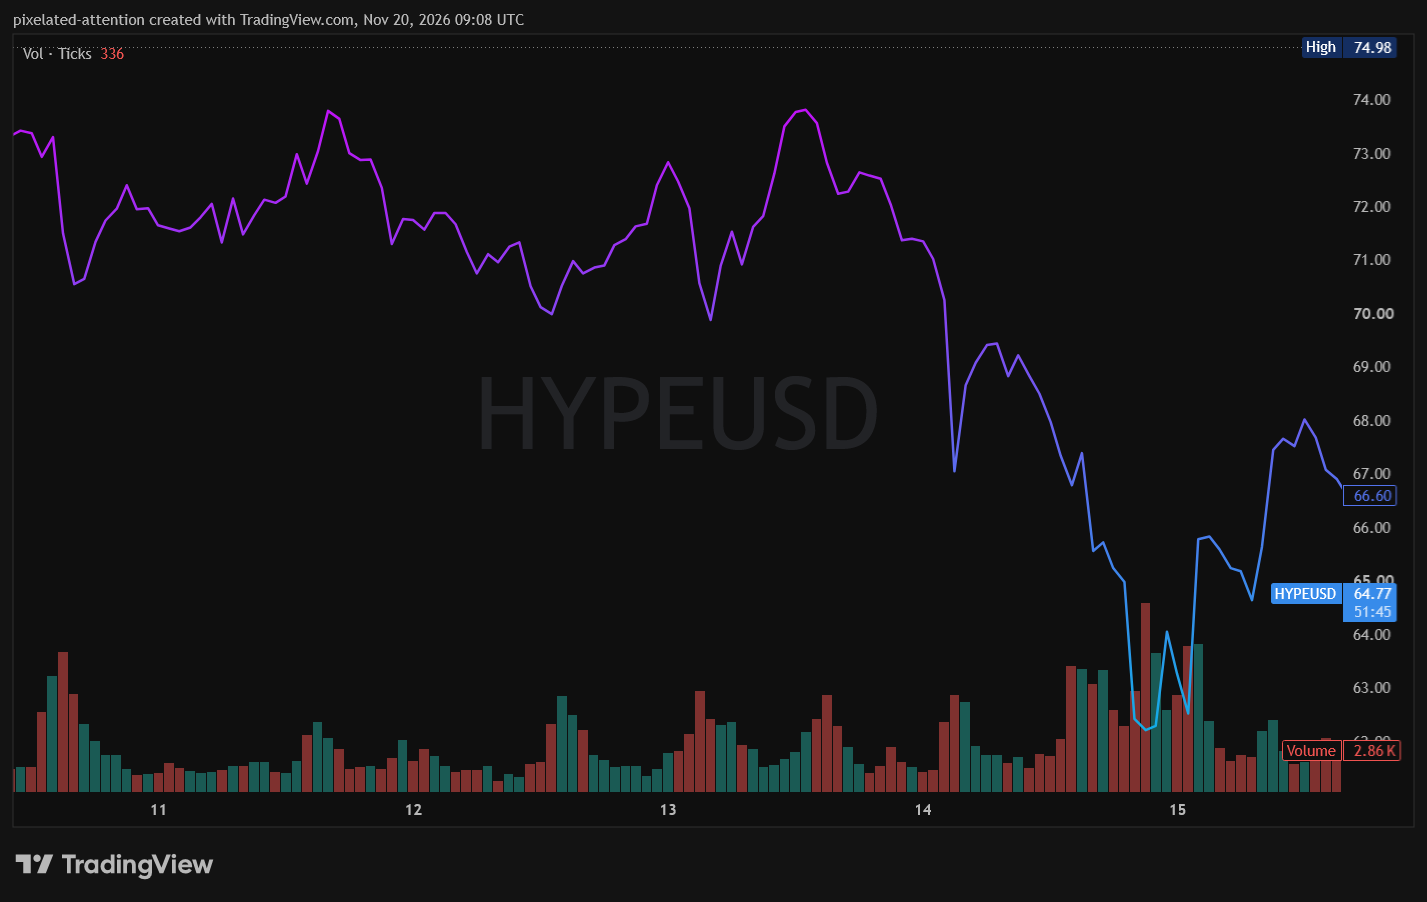
Between November 12 and 14, HYPE rallied towards $74 before reversing sharply. A subsequent rebound offered temporary relief, but the recovery struggled to hold, with prices falling again towards $67.
For traders watching only the shorter timeframe, the initial rally could have suggested that buying interest was returning. Viewed alongside the four-hour chart, however, the move was part of a much less convincing recovery.
Hyperliquid also has a fundamental dimension like platform development.
Hyperliquid’s protocol activity and token buyback mechanism can influence expectations about demand for HYPE. Yet supportive token economics do not necessarily prevent prices from falling when broader market sentiment or selling pressure remains negative.
This illustrates why a potential bottom cannot always be assessed through either technical signals or fundamental developments alone. A positive development may support the longer-term investment narrative without immediately changing the direction of price.
What these three cryptocurrency charts inform
Although Bitcoin, Solana and Hyperliquid exhibit different price behaviours, they share one important characteristic: signals that appear encouraging in isolation can become less convincing when viewed within a broader market context.
When assessing a potential bottom, traders may consider several technical observations together
- Price structure: Are lower highs and lower lows still forming, or is the market structure beginning to change?
- Momentum: Are indicators such as RSI showing signs of selling pressure weakening?
- Timeframe: Does a short-term retracement align with the broader trend, or contradict it?
- Confirmation: Has price confirmed a breakout above resistance, or is the rebound losing momentum?
These observations cannot eliminate uncertainty. Their value lies in helping traders distinguish between a possible turning point and a reversal supported by additional evidence.
Explore CFD price action on BTCUSD, SOLUSD, HYPEUSD and many more coins as Crypto CFDs on VT Markets.
What can traders do in a falling market?
The difficulty of timing a bottom does not mean traders must abandon opportunities in falling markets. Instead, it raises a different question: Does a trading strategy need to depend on identifying the lowest price?
There are several ways to approach this uncertainty.
- Trading the decline rather than waiting for the bottom
For traders expecting further downside, falling prices may present opportunities to consider short positions.
Contracts for Difference (CFDs), for example, allow traders to speculate on price movements without owning the underlying cryptocurrency. A short CFD position may benefit if the market declines, while CFDs can also be used to hedge certain existing exposures.
However, trading the downside brings its own timing challenges.
A sharp rebound can produce losses for short positions, and leverage can magnify those losses. Hedging also requires consideration of position sizing, costs and the relationship between the hedge and the exposure being protected.
The objective is therefore not to assume that prices will continue falling indefinitely, but to identify a trading setup with defined risk parameters. Learn how to set up your trading strategies in ‘How Short Selling Works in a Falling Market‘
- Waiting for evidence of a rebound
Another approach is to accept that entering at the exact bottom may not be necessary.
Rather than reacting to the first upward movement, traders may watch for signs that the market’s price structure is changing. These could include the formation of a higher low, a break above a previous swing high, improving momentum or stronger participation during a recovery. Learn to identify whether its a temporary rebound or developing recovery in ‘Bear Market, Capitulation, and Rebounds: What Do They Mean to Traders?’
No individual signal guarantees that the bottom is in place. However, combining price structure with other technical observations may provide a more considered basis for evaluating a potential reversal.
The trade-off is straightforward: waiting for confirmation may mean missing the lowest entry price. But it may also reduce reliance on an unconfirmed prediction.
- Choosing not to trade yet
There is also a third possibility that traders sometimes overlook: remaining on the sidelines.
When volatility is unusually high, market direction is unclear or available setups do not offer an acceptable balance between potential reward and risk, choosing not to open a position can be a deliberate strategy.
This does not mean abandoning the market. Traders can continue monitoring support and resistance levels, changes in momentum and emerging price patterns while waiting for conditions that better align with their trading plans. In an environment where prices can change direction rapidly, patience can be just as important as identifying opportunities.
We provide a useful decision-making diagram here in ‘Markets Are Falling: Should You Hold, Sell, Hedge or Stay Out?‘
The lowest price is not always the most important price.
There is an undeniable appeal to calling the exact bottom of a crypto market sell-off.
Yet Bitcoin’s short-lived rebounds, Solana’s changing momentum and Hyperliquid’s failed recoveries demonstrate how difficult it can be to distinguish a temporary pause from a meaningful turning point.
The challenge is not simply finding the lowest price. It is understanding what the market is signalling, how those signals fit within the broader trend and whether the available evidence supports a particular trading decision.
For some traders, that may mean considering opportunities during the decline. For others, it may mean waiting for stronger confirmation of a recovery — or choosing to remain out of the market altogether.
After all, a trader who enters at the exact bottom without a clear plan is not necessarily better positioned than one who enters later with defined conditions and controlled risk.
The bottom may make for a compelling headline. But in trading, the more useful question may not be how low the market can go — it’s what you plan to do next.
Make an account today | Try a Demo | Download VT Markets APP
Frequently Asked Questions
How can traders tell if a crypto market has reached its bottom?
There is no single indicator that can confirm a market bottom in real time. Traders may look for signs such as higher lows, a break above previous resistance, improving momentum or increased buying activity. However, these signals are not guarantees of a sustained reversal.
Can a cryptocurrency rebound while still in a downtrend?
Yes. Short-term rebounds, sometimes called relief rallies, can occur within a broader downtrend. A cryptocurrency may rise sharply on an hourly chart while continuing to form lower highs and lower lows over longer timeframes.
Is it better to buy the dip or wait for confirmation?
Both approaches involve trade-offs. Buying during a decline may offer a lower entry price but carries the risk of further losses. Waiting for confirmation may mean entering at a higher price, but it allows traders to assess additional evidence of a potential reversal.
Can traders benefit from falling crypto prices?
Traders may consider short positions through instruments such as CFDs to speculate on declining prices or hedge certain exposures. However, leveraged trading carries significant risks, and sudden rebounds can lead to substantial losses.
Risk disclosure: Cryptocurrency markets are highly volatile. CFDs are leveraged products and carry a high risk of rapid losses. Technical indicators and historical price patterns do not guarantee future performance. This article is for general educational purposes and does not constitute investment advice.



