

Key Takeaways:
- The ADX indicator measures how strong a trend is, not which way it points.
- Readings above 25 usually flag a strong trend, while readings below 20 suggest a weak or ranging market.
- The +DI and -DI lines reveal direction, so they pair naturally with ADX for a complete picture.
- ADX works across forex, indices, commodities, and crypto CFDs, and it sits ready to use on MetaTrader 4 and MetaTrader 5 at VT Markets.
Spotting a trend is the usual practice. However, finding out whether that trend has the muscle to keep going is another. This is exactly where the ADX indicator earns its place on a CFD trader’s chart. The Average Directional Index (ADX) measures trend strength on a simple scale from 0 to 100.
In this guide, we dissect how the ADX works, how to read it, and how to build a practical ADX indicator strategy around it. You will see examples, simple calculations, and pro-tips drawn from real trading conditions. Everything here applies whether you trade forex, indices, gold, or crypto CFDs on MetaTrader 4 or MetaTrader 5.
What is the ADX Indicator?

The ADX is a technical analysis tool that gauges the strength of a price trend. It does not care if price is rising or falling. It only tells you how strong the move is. That single focus makes it one of the most trusted trend strength indicators in a CFD trader’s toolkit. The reading sits on a 0 to 100 scale, and the higher it climbs, the more conviction is behind the move.
Treat it like a speedometer for momentum. A flat, low ADX means the market is drifting. A rising ADX means momentum is building. Pair it with direction tools, and you have a clear read on whether to trade with the trend or stand aside.
What does ADX stand for in trading?
ADX stands for Average Directional Index. It is the headline line of a wider system called the Directional Movement System. The name is important as it tells you what the tool does: it averages directional movement over time to produce one smoothed reading of trend strength.
In short, ADX answers a single question: how strong is this move, on average, right now?
What is a good ADX value?
What is a good ADX value is the question almost every new trader asks first. There is no hocus pocus number, but most traders work to a clear set of bands. These are widely used because they balance reliability with responsiveness.
| ADX reading | What it suggests | Typical trader response |
| 0 – 20 | Weak trend or ranging market | Avoid trend trades; look for range setups |
| 20 – 25 | Trend may be forming | Watch closely; wait for confirmation |
| 25 – 50 | Strong, healthy trend | Trade with the trend |
| 50 – 75 | Very strong trend | Trade with the trend; watch for exhaustion |
| 75 – 100 | Extremely strong trend (rare) | Manage risk tightly; trends rarely hold here |
As a rule of thumb, a reading above 25 is the line many traders use to call a trend strong. Below 20, the market is usually not worth trend-trading. The sweet spot for most setups sits between 25 and 50.
What is the difference between ADX, +DI, and -DI?
The ADX never travels alone. It comes bundled with two partner lines, the +DI (Positive Directional Indicator) and the -DI (Negative Directional Indicator). Together they form the Directional Movement Index (DMI). Here is how the three split the work:
- ADX line: Measures trend strength only. It is direction-blind.
- +DI line: Measures the strength of upward price movement.
- -DI line: Measures the strength of downward price movement.
In other words, the DI lines tell you which way price is leaning, while ADX tells you how hard it is leaning. You need both halves to read a chart properly.
Who created the ADX indicator?
The ADX was developed by J. Welles Wilder Jr., an American mechanical engineer turned market technician. He introduced it in his 1978 book New Concepts in Technical Trading Systems. The same book gave traders the RSI, the Average True Range, and Parabolic SAR, so Wilder’s fingerprints are all over modern charting.
Nearly five decades on, the ADX still ships as standard on almost every trading platform, including MetaTrader 4 and MetaTrader 5. That staying power says plenty about how well the maths holds up.
How Does the ADX Indicator Work?
The ADX tracks how much price moves in one direction compared with the other. It then smooths that data into a single line. You do not need to calculate it by hand, your platform does the heavy lifting, but understanding the logic helps you trust the signal.
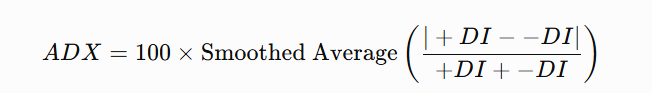
How is ADX calculated?
The ADX is built in three stages. Each stage feeds the next, which is why the final line looks so smooth.
- Directional Movement: Compare today’s high and low with yesterday’s to find +DM (up move) and -DM (down move).
- Directional Indicators: Divide the smoothed +DM and -DM by the Average True Range to get +DI and -DI.
- The ADX line: Take the difference between +DI and -DI, divide by their sum, then smooth the result over the chosen period.
A simplified version of the formula looks like this:
Here is a quick worked example:
Imagine +DI reads 30 and -DI reads 10:
- Difference: 30 − 10 = 20
- Sum: 30 + 10 = 40
- DX value: (20 ÷ 40) × 100 = 50
A raw DX of 50 is strong. The ADX line is simply this DX figure smoothed over the chosen period, which strips out the noise and gives you a steadier read.
What is the default ADX setting (period)?
The default period for the ADX is 14, exactly as Wilder designed it. On a daily chart, that means the calculation looks back over 14 days. The 14-period setting is the standard you will find pre-loaded on MetaTrader 4 and MetaTrader 5.
Pro-tip: A shorter period (say 7) makes ADX react faster but produces more false moves. A longer period (say 21) is slower but cleaner. Most CFD traders leave it at 14 until they have a clear reason to change it.
What do the +DI and -DI lines mean?
The DI lines are your direction guides. Reading them is refreshingly simple:
- +DI above -DI: Buyers are in control, so the bias is bullish.
- -DI above +DI: Sellers are in control, so the bias is bearish.
- The wider the gap: The more one-sided the move.
When the two lines cross, the balance of power is shifting. That crossover is the heart of many entry signals, which we cover further down.
Why does ADX not show trend direction?
By design, the ADX strips out direction so it can focus purely on strength. The maths uses the absolute difference between +DI and -DI, so a strong downtrend and a strong uptrend can both push ADX to the same high reading.
This is a feature, not a flaw. It keeps the signal clean. You simply read direction from the DI lines or from price itself, then let ADX confirm whether the move has the strength to follow through.
How Do You Read and Interpret ADX?
Reading the ADX comes down to two things: the level of the line and the direction it is heading. A high line means strength. A rising line means that strength is building. Combine the two, and the chart starts telling a clear story.
What does a rising ADX mean?
A rising ADX means trend strength is increasing. Momentum is feeding the move, whether it is up or down. This is the condition trend-followers wait for, because it suggests the current direction has room to run.
- Rising ADX + +DI on top = strengthening uptrend.
- Rising ADX + -DI on top = strengthening downtrend.
In both cases, the message is the same: the trend deserves your respect.
What does a falling ADX mean?
A falling ADX means trend strength is fading. The move is losing steam. Importantly, a falling ADX does not mean price is reversing, only that the existing trend is weakening. Price may simply be pausing or starting to range.
Pro-tip: when ADX rolls over from a high level, tighten your stops or take partial profit. A weakening trend is no place for a relaxed position.
What ADX level confirms a strong trend?
A reading above 25 is the level most traders use to confirm a strong trend with the ADX. Once ADX clears 25 and keeps rising, trend-following strategies tend to work best. Readings above 40 or 50 signal an especially powerful move, though such extremes rarely last.
| ADX level | Trend strength reading |
| Above 25 | Confirmed strong trend, favourable for trend trades |
| Above 40 | Very strong trend, but watch for exhaustion |
| Above 50 | Powerful trend, often near a climax |
What ADX level signals a weak or ranging market?
A reading below 20 signals a weak or ranging market. Here, price tends to chop sideways without clear direction, and trend strategies struggle. This is where the ADX earns its keep by simply keeping you out of bad trades.
- Below 20: Market is ranging; trend trades are risky.
- 20 to 25: A grey zone; wait for a clear break above 25.
- A flat, low line: Consider range or mean-reversion tactics instead.
How Do You Trade Using the ADX Indicator?

Knowing the theory is one thing. Putting it to work is where profit lives. A solid ADX indicator strategy combines the strength reading with direction and confirmation. Below are the core methods CFD traders rely on, each easy to apply on MetaTrader 4 and MetaTrader 5.
How do you use ADX to confirm a trend?
The simplest use of the ADX is as a confirmation filter. You spot a potential trend from price or the DI lines, then check that ADX agrees before you commit. A clean three-step routine looks like this:
- Identify direction from price structure or the DI lines.
- Check that ADX is above 25 and rising.
- Only take trend trades when both align.
This single filter alone can lift the quality of your setups, because it weeds out the flat markets where trend trades so often fail.
How do you combine ADX with other indicators?
ADX shines brightest in good company. Since it is a non-directional tool, it pairs perfectly with directional ones. Popular combinations include:
- ADX + Moving Averages: Use the moving average for direction and ADX to confirm strength.
- ADX + RSI: RSI flags overbought or oversold zones while ADX confirms whether the trend can push through them.
- ADX + support and resistance: A strong ADX adds weight to a breakout through a key level.
- ADX + MACD: MACD gives momentum and direction, ADX validates the strength behind it.
Pro-tip: Avoid stacking two strength tools together. Always pair ADX with a direction tool so each indicator answers a different question.
How do you use the DI crossover for entry signals?
The DI crossover is the classic ADX indicator buy sell signal. It uses the moment the +DI and -DI lines swap places, confirmed by a healthy ADX reading. The rules are clean:
| Signal | Conditions |
| Buy signal | +DI crosses above -DI while ADX is above 25 and rising |
| Sell signal | -DI crosses above +DI while ADX is above 25 and rising |
| Exit signal | ADX falls below 20 or the DI lines cross back |
Worked example:
Say the +DI crosses above the -DI on EURUSD, and at the same moment ADX is reading 28 and ticking higher. That is a textbook ADX indicator buy sell signal for a long position. If ADX were stuck at 15, you would skip the trade, because the move lacks strength.
Can ADX be used for trend-following and breakout strategies?
Yes, and this flexibility is a big reason the ADX stays so popular. It suits two very different playbooks:
- Trend-following: Enter in the direction of the trend once ADX confirms strength above 25, then ride the move while ADX holds firm.
- Breakout trading: A sudden jump in ADX from a low base often accompanies a genuine breakout, helping you separate real moves from false ones.
The common thread is confirmation. In both styles, ADX is there to tell you whether the move has the power to keep going.
What are the Limitations of the ADX Indicator?
No tool is flawless, and the ADX is no exception. Knowing its blind spots is what separates disciplined traders from hopeful ones. Used with awareness, its weaknesses become manageable.
Is ADX a lagging indicator?
Yes. The ADX is a lagging indicator, because it is built on smoothed averages of past price. By the time it confirms a strong trend, part of the move has already happened. That smoothing is exactly why the line is so reliable, but it also means ADX is better at confirming trends than predicting them.
Pro-tip: Treat ADX as a confirmation tool, not a crystal ball. Pair it with faster, leading signals when you need an early read.
Can ADX give false signals?
It can. In choppy, sideways markets, the DI lines may cross back and forth, producing whipsaws. A low ADX reading is your warning that any crossover signal is unreliable. This brings us to a question traders ask a lot.
Is ADX a reliable indicator? The honest answer is yes, when used correctly. ADX is highly reliable at measuring trend strength, which is its one job. It becomes unreliable only when traders ask it to do something it was never built for, such as predicting direction or timing tops and bottoms. Respect its purpose, and it rarely lets you down.
Is ADX good for day trading?
It can be, with the right settings. On lower timeframes, the standard 14-period ADX can feel sluggish, so some day traders shorten the period or use it strictly as a filter rather than a trigger. The key is to combine it with faster tools for entries.
- Use ADX to confirm there is a genuine intraday trend worth trading.
- Use a faster indicator or price action for the actual entry.
- Skip range-bound sessions where ADX sits below 20.
Is ADX better than other trend indicators?
Not better, just different. The ADX measures strength, while tools like moving averages and MACD lean towards direction and momentum. The smart move is not to crown one winner but to combine them so each covers the other’s blind spots.
ADX Across Markets and Timeframes
One of the great strengths of the ADX is how well it travels. The same logic that works on a forex pair works on an index, a commodity, or a crypto CFD. The maths does not care what you are trading, only how price moves.
What is the best timeframe for ADX?
There is no single best timeframe, but a few patterns hold true. Higher timeframes give cleaner, more reliable ADX signals. Lower timeframes give more signals but more noise. Match the timeframe to your style:
| Trading style | Suggested timeframe | Why it fits |
| Scalping | 1 to 15 minutes | Fast signals; use ADX as a filter only |
| Day trading | 15 minutes to 1 hour | Balances speed with reliability |
| Swing trading | 4 hours to daily | Cleaner trends, fewer false moves |
| Position trading | Daily to weekly | Strongest, most reliable readings |
Does ADX work for forex, stocks, and crypto?
Yes. The ADX works across forex, stock CFDs, indices, commodities, and crypto CFDs. Since it measures the universal quality of trend strength, it adapts to any liquid market. A few points worth knowing:
- Forex: ADX is a long-standing favourite for spotting strong currency trends.
- Stock and index CFDs: Works well, especially on higher timeframes where trends are cleaner.
- Crypto CFDs: Useful for filtering the sharp, fast moves crypto is known for, though expect more volatility.
At VT Markets, the ADX is built into both MetaTrader 4 and MetaTrader 5, so you can apply it to any of these markets in a couple of clicks.
What is the best ADX indicator strategy for beginners?
For newcomers, the best ADX indicator strategy is the simplest one. Keep it to a clean, rule-based routine you can follow without second-guessing:
- Set ADX to the default 14-period on MT4 or MT5.
- Only consider trend trades when ADX is above 25 and rising.
- Use the +DI and -DI lines to decide direction.
- Enter when +DI crosses above -DI for longs, or -DI above +DI for shorts.
- Exit when ADX falls below 20 or the DI lines cross back.
- Always use a stop-loss; ADX confirms strength, not safety.
Pro-tip: Practise this routine on a demo account first. Master the rules with no money on the line, then move to live trading once the process feels automatic.
Frequently Asked Questions (FAQs)
Q1: Is the ADX indicator a buy or sell signal on its own?
Not by itself. The ADX line only measures trend strength, so it cannot tell you direction. A genuine ADX indicator buy sell signal comes from combining the ADX reading with a DI crossover, where +DI crossing above -DI suggests a buy and the opposite suggests a sell.
Q2: What is a good ADX value for confirming a trend?
Most traders treat a reading above 25 as confirmation of a strong trend, while anything below 20 points to a weak or ranging market. The 25 to 50 band is often seen as the healthiest zone for trend trades.
Q3: Is ADX a reliable indicator for CFD trading?
Yes, when used for its intended job. ADX is highly reliable at measuring trend strength across forex, indices, commodities, and crypto CFDs. It becomes unreliable only when traders expect it to predict direction or time reversals, which it was never designed to do.
Q4: Can I use the ADX indicator on MetaTrader 4 and MetaTrader 5?
Absolutely. The ADX indicator ships as a standard tool on both MetaTrader 4 and MetaTrader 5. At VT Markets, you simply add it from the indicator list, leave it on the default 14-period setting, and apply it to any chart.
Place the ADX Indicator to Work with VT Markets
The ADX indicator will not hand you a winning trade on its own. What it does is sharpen your judgement. It keeps you out of flat, going-nowhere markets and gives you the confidence to back trends that have real strength behind them. Master it, and you trade with clarity rather than guesswork.
The best way to learn any ADX indicator strategy is by doing. Open a chart, add the indicator, and watch how it behaves across the markets you care about. With VT Markets, you get the ADX indicator ready to go on MetaTrader 4 and MetaTrader 5, fast execution, and tight spreads across forex, indices, commodities, and crypto CFDs.
Open your live account today, or sharpen your skills risk-free on a demo account first. Trading can be easy when you have the right tools and the right partner behind you.


