What is the forex market?
The Forex or FX market, is short for the foreign exchange market, is the place in which individuals, companies, and governments all trade different currencies with one another. Put simply, the Forex market is the marketplace where money is bought and sold.
Open 24 hours a day and 5 days a week, unlike stock or bond markets, the Forex market does not close at the end of each day. Instead, trading just shifts to different financial centres around the world. The day starts with the Sydney session and moves to Tokyo, London, Frankfurt and finally New York before it is time for Sydney to do it all over again!
When compared to various stock, commodities, and bond markets worldwide, the Forex market is by FAR the biggest financial market in the world. The NYSE sees an average of $22.4 billion per day in volume traded, while the London Stock Exchange sees an average day turn over $7.2 billion in volume traded.
They sound like big numbers, don’t they? Well the Forex market does a massive $5.3 TRILLION, monstering them all in comparison!
The most appealing thing about trading Forex is just how accessible it is to trade for regular people like you! Known as ‘retail traders’, these are the people trading the Forex market from their own homes with nothing more than a computer, a connection to the internet and their own personal trading account with a Forex broker such as VT Markets.
Can you make it trading Forex alongside companies, governments, and central banks?
Open a demo account with VT Markets.
Why trade forex?
If you were to ask someone on the street what their opinion of Forex trading was, you’d most likely get the following responses:
“Why on Earth would you want to throw your money away like that?”
“Your broker will steal your money.”
“You’re much safer investing in blue chip stocks for the long term.”
For one reason or another, Forex is unfortunately seen by many as a risky, get rich quick scam. But is that a fair assessment? Well the answer is actually both yes and no.
Like most things in life, people fear what they don’t actually understand and if you don’t educate yourself and dive in head first with your life savings trading Forex with an unregulated broker, what the heck do you expect? Of course, you’re likely to lose your money…
On the other hand, if you put in the time to properly educate yourself as a Forex trader, understand the leverage available to you, your broker’s financial regulation and most importantly how to manage your risk, then Forex could well be the perfect market for you to trade!
So what are some of the advantages that Forex trading has over trading stocks and other markets?
Forex trading is easy - Unlike other forms of investing, Forex trading is easy to get started. When you compare what you need to get started trading Forex with what you need to get started in stocks, options, or futures trading, they all pale in comparison.
All you need to trade Forex is a computer, an internet connection and a mind that wants to learn! Open an account with a Forex broker such as VT Markets with as little as $200 and take advantage of the copious amounts of free Forex education that is on our website!
Forex trading is cheap - As you just read, Forex trading doesn’t require you to deposit tens of thousands of dollars into your account just to get started. You can open an account and begin trading Forex with as little as a $200 deposit.
Another huge advantage that Forex trading has over stocks, options and futures is costs to enter and exit a trade. With other financial instruments and markets, you can pay huge fees to simply enter and exit a one size fits all trade. Forex on the other hand allows you to trade just 0.01 of a standard lot, paying just the spread.
The ability to trade Forex anywhere, anytime
unlike your 9 to 5 day job, Forex trading doesn’t restrict you to your desk or worksite. If you don’t want to be inside, then don’t be inside! Forex gives you the ability to trade anywhere, anytime. Trade wherever and whenever you want, it’s up to you.
Access your MetaTrader 4 account on a computer, laptop, web browser, tablet, or mobile phone. All you need is an internet connection. Always be connected to the market and never let a trading opportunity go by wishing you could have profited from it!
Now here’s a question for you - How many stock charts have you looked at and seen gaps scattered throughout the chart?
Remember that gaps mean that you can’t get in or out of a trade at those prices because there is simply no one looking to buy or sell there. This adds a whole other element of risk to stock traders that Forex traders don’t have to worry about.
The Forex market is the biggest, most liquid market in the world. Get involved with a FREE demo Forex trading account and start your journey with VT Markets today.
Indices
As we outlined in our what is Forex section, the Forex market is open 24 hours a day and 5 days a week. As one part of the world wakes up, the centre of trading focuses around that section of the globe and slowly shifts between financial centres as the day unfolds throughout the world.
The major Forex trading sessions are outlined in the following table:
As a basic rule, you are better off trading the respective currency pair during its corresponding session. For example, AUD/USD is more likely to move during the relatively quiet Sydney session because of market moving news releases. On the other hand, EUR/GBP probably isn’t going to experience the same types of moves during Asia as both Europe and the UK is asleep.
Now, as you can see some of the Forex trading sessions actually overlap one another. During these session cross over times, it is seen as one of the optimal times to be trading Forex as you have highly liquid market conditions where good quality moves often come. But why are they seen as good quality moves? Shouldn’t a move be a move? Well the simple answer here is no, not all moves are good for trading.
For example, a move during the illiquid end to the New York trading session might be prone to a fake out rather than a sustained, more predictable move. You could be much better off taking a breakout trade during the London session open when the market is at its most liquid and moves are better. On your Forex sessions diagram, take note of important times such as session open and closes when major market participants might look to open or close major orders.
As with everything in Forex, nothing here is actually set in stone. Just because a breakout happens during the relatively quiet Asian session doesn’t mean that it will automatically be a fake-out like the textbooks may tell you.
Stay on top of Forex session times and market moving news headlines with free access to the Forex News Terminal when you fund your live Forex trading account with VT Markets.
What are the currency pairs?
Now we know a little more about what the Forex market is, let’s take a look at the currencies that are traded and how they are traded. We have talked about how massive the Forex market is as a whole, so let’s now dig down a little deeper into the individual currencies that make up this huge market.
Below is a list of the most popular, actively traded currencies in the Forex market as well as their abbreviations that traders use:
US Dollar (USD)
Euro (EUR)
Japanese Yen (JPY)
Pound Sterling (GBP)
Australian Dollar (AUD)
Swiss Franc (CHF)
Canadian Dollar (CAD)
But in the Forex market, you cannot simply buy or sell these single currencies alone. In Forex, currencies are actually quoted and traded in pairs, hence the name currency pairs. It makes sense when you think about trading currencies with real world applications and not simply as a paper share in a company or a futures contract. When you want to buy a specific currency, what are you going to pay for it with? Of course, another currency. This is where the idea of Forex currency pairs comes from.
Here we have listed the most commonly traded Forex currency pairs:
Euro / US Dollar (EUR/USD)
US Dollar / Japanese Yen (USD/JPY)
Pound Sterling / US Dollar (GBP/USD)
US Dollar / Swiss Franc (USD/CHF)
Australian Dollar / US Dollar (AUD/USD)
US Dollar / Canadian Dollar (USD/CAD)
Now let’s look at an example of a Forex trade. Say that your analysis is telling you to buy EUR/USD. This essentially means that you are buying the Euro and selling the US Dollar. Because each currency pair is actually a relationship between the two different currencies quoted, you have a few different scenarios that could put your trade in a profitable position.
Put simply, you will profit if the Euro rises and the US Dollar falls. But the currency pair relationship also means that you will profit if both currencies are rising but the Euro rises more and likewise if both currencies are falling but the USD is falling faster.
Be sure to log into your VT Markets MT4 demo account and try both buying and selling different Forex currency pairs to get your head around the relationships.
How are forex currency pairs written?
Here we can see the different parts that make up a Forex currency pair.
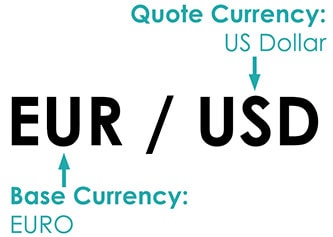
The first currency listed in the pair is known as the base currency and the second currency listed in the pair is what’s known as the quote currency.
Have you ever noticed that a currency pair is always written in a set order? For example, EUR/USD is always written with the EUR as the base currency and not the other way around. This is due to standards that have been universally set, whereby each currency has a ranking relative to one another. If one currency is ranked higher than another, when quoted as a currency pair it will receive base currency status.
The universally accepted ranking order is as follows:
EUR
GBP
AUD
NZD
USD
CAD
CHF
JPY
The rankings were established according to the relative values of the currencies at the time, but new currencies such as the Euro were subjectively inserted.
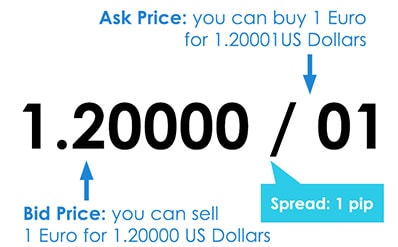
When a Forex currency pair is displayed as a quote like the example above, the price shows how much of the quote currency (in this case, the USD) is required to buy 1 unit of the base currency (in this case, the EUR). For example, EUR/USD at 1.2000 means that 1 Euro can buy 1.2000 US Dollars.
In a Forex currency quote, the first number is what is called the bid price, or the price at which you are able to buy the currency pair. The second number is called the ask price and is the price at which you can sell the currency pair. The difference between the bid and ask price is what is known as the spread and is the price that you must pay to enter your trade.
On the VT Markets MT4 terminal, take a look at the quote board and check the base and quote currencies and the tight spreads that VT Markets can offer its traders.
Normal spreads on STP and ECN accounts
For Standard STP account
| Currency pairs | Spreads (ref only) |
|---|---|
| EURUSD | from 1.3 |
| GBPUSD | from 1.8 |
| AUDUSD | from 1.6 |
| USDJPY | from 1.5 |
For RAW ECN account
| Currency pairs | Spreads (ref only) |
|---|---|
| EURUSD | from 0.0 |
| GBPUSD | from 0.6 |
| AUDUSD | from 0.4 |
| USDJPY | from 0.5 |
ECN commission charges
Please refer to the following table for a full list of RAW ECN commission charges, in the denomination of your trading account. We have split the table between commission per 0.01 lots and 1.00 lots to make it easier for you to calculate, depending on your trading volume.
| Trading Account Currency | Commission per 0.01 LOTS (1,000 base currency) | Commission per 1 LOT (100,000 base currency) |
|---|---|---|
| AUD Australian Dollar | AUD $0.03 (round turn $0.06) | AUD $3 (round turn $6) |
| USD US Dollar | USD $0.03 (round turn $0.06) | USD $3 (round turn $6) |
| GBP Pound Sterling | GBP £0.02 (round turn £0.04) | GBP £2 (round turn £4) |
| EUR Euro | EUR €0.025 (round turn €0.05) | EUR €2.5 (round turn € 5) |
| CAD Canadian Dollar | CAD $0.03 (round turn $0.06) | CAD $3 (round turn $6) |
Going long & going short
Put simply, Forex markets go both up and down. Every regular guy you chat to on the street is going to be able to tell you that. So why do so many investors only buy and hold assets like shares in a company or commodities such as gold? What I find even more questionable, is why do these ‘buy only’ investors sell their assets when they know the market is going to go down, but don’t do anything else to profit from the move? They predicted it was coming, but they do nothing!
Wouldn’t it be great if instead of just selling your assets when you predict a fall in the market, you could profit from your prediction too? Forex trading isn’t like investing in stocks where you just buy and hold. Trading Forex gives you the opportunity to profit in ALL market conditions. Whether the market is going up or going down won’t bother you as you’ll see trading opportunities in both directions.
As we described on the Forex currency pairs lesson, when trading Forex, you cannot simply buy or sell a single currency. In Forex, currencies are written in pairs meaning that you must buy one currency pair by selling another (and vice versa).
If you want to buy a Forex currency pair, then you are going long (or taking a long position). This means that you want the base currency to rise in value when compared to the quote currency so you can sell it at a higher price. This is straight forward, but what if you wanted to profit in a falling market?
On the other hand, if you want to sell a Forex currency pair, then you are going short (or taking a short position). In this scenario, you want the base currency to fall when compared to the quote currency so you can buy it back at a lower price.
Try taking both long and short positions yourself on a VT Markets MT4 demo account.
Lot size and leverage
When you’re trading Forex online, it’s not like you can load your car up with cash, drive to a designated meeting place and trade your Dollars for Yen. You are of course doing business via online contracts. Contracts that have standard sizes called lots in place to make online Forex trading standardised around the world.
The following is a list of common lot sizes and the corresponding number of currency units that you are in fact buying or selling.
1 STANDARD lot represents 100,000 units of currency.
1 MINI lot represents 10,000 units of currency.
1 MICRO lot represents 1000 units of currency.
Both the Standard STP and RAW ECN Forex trading accounts at VT Markets are by default set to be trading using standard lots. At first glance, this may seem like it is only suitable for big traders but don’t worry because the VT Markets MT4 platform allows you to trade down to 0.01 of a standard lot, effectively giving you the opportunity to trade Micro lots if you please. By playing with fractions of a standard lot, traders of all levels are able to trade on a standard account.
The next question then becomes: Do I need $100,000 in my Forex trading account just to trade 1 single standard lot?! Don’t stress, the answer is no. This is where Forex traders utilize what is known as leverage.
When you trade Forex using leverage, you actually are able to control more money than the balance of your own trading account. The term comes about because with the broker’s help, you are ‘leveraging’ the money that you have. Using leverage allows you to increase your profits because you are able to trade bigger size than a non-leveraged investment would allow.
At VT Markets, a standard account has leverage of 500:1. This means that for every $1,000 in your trading account, you are actually able to control $500,000 of currency. Think of leverage as your broker lending you the $500,000 so you can trade standard lot sizes. Your $1,000 account is what’s known as margin and can be seen as a good faith deposit while you are using their money to trade standard lot sizes.
For example, let’s say your Standard STP trading account at VT Markets has a balance of $5,000 and the leverage you are using is 500:1. If you wanted to go long 1 standard lot of EUR/USD then VT Markets would set aside $200 as margin and would allow you to take the position.
This is an extreme example and also highlights the risks that leveraged Forex trading exposes you to. If the ‘Margin Level’ in your MT4 Terminal drops to 50%, then your position will be automatically closed and you will have experienced what is called a margin call.
What is a forex pip?
A pip, short for "percentage in point" or "price interest point," represents a tiny measure of the change in a currency pair in the Forex market. It can be measured in terms of the quote or in terms of the underlying currency.
A pip is a standardized unit and is the smallest amount by which a currency quote can change. It is usually $0.0001 for US dollar related currency pairs, which is more commonly referred to as 1/100th of 1%, or one basis point. This standardized size helps to protect investors from huge losses. For example, if a pip was 10 basis points, a one-pip change would cause greater volatility in currency values.
How to calculate the value of a pip?
In this article, Base currency refers to the first currency in a pair (ie EUR in EURUSD) and quote currency refers to the second (ie USD).
To Calculate:
1) If account is denominated in USD and USD is the quote currency (EURUSD):
Pip Value = 0.0001 x Units
Example: You have a 5,000 USD account and go long 25,000 EURUSD (.25 lots):
Pip Value = 0.0001 x Units
Pip Value = 0.0001 x 25,000
Pip Value = $2.50
2. If account is denominated in another currency (ie AUD) and USD is the quote currency (EURUSD)
Pip Value = 0.0001 x Units / AUDUSD
Example – You have a $5,000 AUD account and you go long $25,000 EURUSD:
Pip Value = 0.0001 x Units / AUDUSD
Pip Value = 0.0001 x 25,000 / .7150
Pip Value = $2.50 / .7150
Pip Value = $3.50
Note at current market rates, pip value is substantially larger if account is denominated in AUD – this is very important to know when calculating stop losses.
2) If account is denominated in USD and USD is the base currency (USDCHF):
Pip value = 0.0001 x units/quote
Example – You have a $5,000 USD account and go long $25,000 USDCHF:
Pip value = 0.0001 x units / quote
Pip Value = 0.0001 x 25,000 / USDCHF
Pip Value = $2.50 / .9915
Pip Value = $2.52
3.) If account is denominated in another currency (ie AUD) and USD is the base currency (USDCHF):
Pip Value = 0.0001 x units / quote / AUDUSD
Example – You have a $5,000 AUD account and go long $25,000 USDCHF:
Pip value = 0.0001 x units / quote / AUDUSD
Pip Value = 0.0001 x 25 000 / USDCHF / AUDUSD
Pip Value = $2.50 / .9915 / AUDUSD
Pip Value = $2.52 / .7150
Pip Value = $3.52
3) If account is denominated in USD and you are trading a cross with no USD component such as EURGBP:
Pip Value = 0.0001 x Units x Quote currency rate (GBPUSD).
Example: You have a 5,000 USD account and go long 25,000 EURGBP (.25 lots):
Pip Value = 0.0001 x Units x GBPUSD
Pip Value = 0.0001 x 25 000 x GBPUSD
Pip Value = $2.50 x 1.4350
Pip Value = $3.59
If we used the above example but with an AUD account, we could either divide the final USD pip value by the AUDUSD rate, or use GBPAUD instead of GBPUSD as the quote currency rate.
Note that for a pair like EURCHF, the quote currency is not available as CHFUSD, therefore you would use 1/(USDCHF) for the quote currency rate. Also, with some pairs a multiplier other than 0.0001 must be used (if JPY is the quote currency for example, the multiplier is 0.01).
All too confusing? Try a VT Markets RAW ECN demo account.
Types of forex orders
The term Forex order simply means how you will enter or exit a trade. When you’re trading Forex, you have many more options at your fingertips to take advantage of trading opportunities, both now and in the future, than just simply buying and selling at the current market price and we go through your options here.
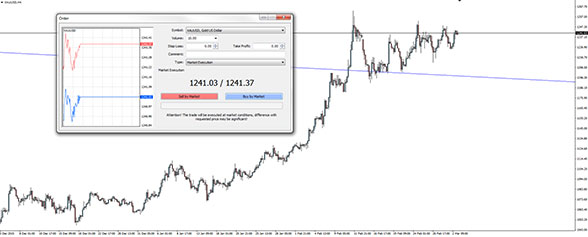
A market order can be both a buy or sell order that will enter you into a trade at the current market price. That is the price you see right now on your MT4 chart. If you enter a market order then you will be instantly entered at the best available price.
Market orders are best used when you see a trading opportunity that needs you to act quickly. Click buy/sell at market and you’re in the trade instantly. For example, the bid price for AUD/USD is currently at 0.7228 and the ask price is at 0.7230. If you wanted to go long AUD/USD at market, then you would be entered at the ask price of 0.7230. You would click buy and your VT Markets MT4 platform would instantly execute a buy order at that exact price.
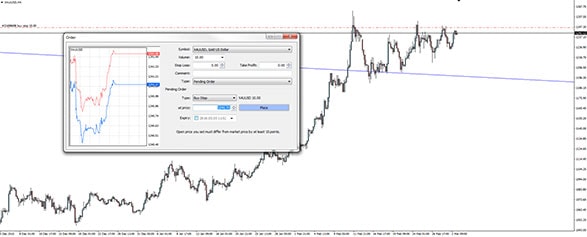
A stop order can be both a buy stop, or a sell stop and is used when you would like to buy above the market or sell below the market. This is best used for trading breakouts or trend continuation strategies when you want the market to just keep going.
For example, AUD/USD is currently trading at 0.7230 and is trending upward. You believe that price will continue to go up, and actually break-out of resistance at 0.7300. Instead of sitting in front of your computer and hitting buy at market, possibly missing your perfect entry price, set a buy stop order at 0.7300. You don’t have to be in front of your computer when price hits your stop order.
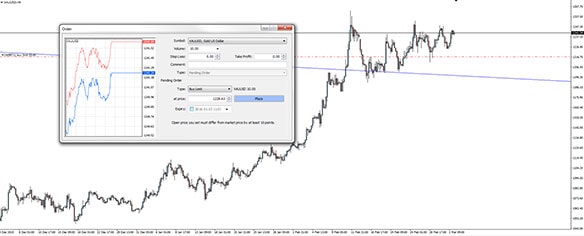
If on the other hand, you think that price will reverse when it hits a certain price, you can use what is called a limit order. Limit orders can be either a buy limit, or a sell limit, depending on which way the market is headed before your expected reversal. A buy limit is used to by below the market and a sell limit is used to sell above the market.
For example, AUD/USD is currently trading at 0.7230 and your analysis tells you that resistance at 0.7300 will likely hold so you want to short if price reaches this level. You can either sit in front of your trading station and wait for price to hit 0.7300 and sell at market, or you can use a sell limit order.
The best way to understand the different types of Forex orders are to use them under real trading conditions on a VT Markets MT4 demo account.
What is forex swap? Can I make money collecting forex swap?
Swap is an interest fee that is either paid or charged to you at the end of each trading day. When trading on margin, you receive interest on your long positions, while paying interest on short positions. The net interest difference is known as the carry and traders seeking to profit from this are known as carry traders.
Positive carry results when you receive more in interest than you are required to pay, and is added directly to your account. If the carry is negative, it is subtracted from your account. If you open and close a trade within the same day, the trade has no interest implications.
If you’re interested in placing a carry trade, the first step is finding a high yielding and low yielding Forex currency pair. Some examples of low yielding (or funding currencies) are the Japanese Yen (JPY), the Swiss Franc (CHF) and the Euro (EUR). As far as high yielding currencies go, the Dollar (AUD) and New Zealand Dollar (NZD) are popular, though more advanced carry traders might look to the South African Rand (ZAR) or other exotic currencies.
Let’s use the Euro and Dollar: rates in the Eurozone are currently below 0, whilst interest rates in are relatively higher, currently 2%. This means that there is an opportunity to earn carry buying AUD with EUR ie going short EURAUD. Great, simple right?
Sadly it’s not that easy – there is no point earning a pip a day in swap if the pair is moving against you 100 pips / week. That is, if we wanted to perform a carry trade on EURAUD, we would wait until the pair was trending down, sell into any strength and hold for the length of the down trend.
Think of swap as an added bonus or incentive for holding a trade long term (or in the case of negative swap, a deterrent).
Are you looking to profit from the carry trade long term? Open a VT Markets live account today.
How oil rollover works
When you’re trading Oil futures on the MT4 platform, if you hold a position over the monthly expiration date of the futures contract that price is based on, you will encounter a rollover. If you do not wish for your position to be rolled over, then you should close your position beforehand.
This is because Oil is a futures contract which has a set expiration date. If you want to continue to hold your position over the expiration date, the old position must be closed as the contract expires, and a new one opened on the new futures contract.
For more, please click here.
How to avoid a margin call and forced closure
Forex traders have the ability to leverage a small amount of capital and open positions hundreds of times larger than their account balance, unlocking the door to incredible profits. Leverage however, is a double-edged sword: with great profit potential, comes the potential for large losses. If you open too large a position, or too many smaller positions, and the coin-toss goes against you, you could face a margin call and forced closure, leaving you with a small fraction of your original balance. So how can you avoid a margin call and forced closure?
Position Sizing
Safe, calculated position sizing goes hand in hand with successful Forex trading. Before entering a trade, you should know where you are going to place your stop loss and how much you are risking on the position – how far your stop loss is from your entry and how much you are risking per trade determines the size of your position. It should never be the other way around: the size of your position should not determine your stop loss, or risk per trade.
Some education outlets and gurus will tell you that it is OK to risk as much as 5% per trade. Most professional traders on the other hand, will tell you this is far too much risk for a single position. Imagine you are trying to keep your drawdown below 20%: if you are risking 5% per trade and lose 4 trades in a row, you have already met your drawdown tolerance. The more an account draws-down, the harder it is it to build back up. Large drawdowns are also very tough on the mind and you could begin to revenge-trade or open even larger positions in order to try and make back your losses – this is not trading – it is gambling in every sense of the word.
In general, you should never risk more than 2% of your account balance on any one trade. If you are just starting out, 1% might be more appropriate. Once you have learned the ropes and you are confident with yourself and your strategy, then you could consider increasing your position size a little. Either way though, 5% is probably too much for the majority of strategies. Even the best professional traders can have losing streaks well in excess 4 trades.
If you want to trade larger positions, you should fund your account appropriately. This is the only safe way of trading with size.
Number of positions and correlation
The number of positions you have open determines your risk at any one time. Just because you are only risking 2% per trade, don’t think you can go crazy and open 10 simultaneous positions – this is a sure-fire way to receive a margin call.
Even if you only have two positions open, but you are trading highly correlated markets, you are still essentially risking 4% on a single trade. An example of this would be risking 2% on a long AUDUSD position, whilst simultaneously risking 2% on a long NZDUSD position – if the USD surges, you will be stopped out of both positions simultaneously, and lose 4%.
On the flipside, don’t take opposite trades in highly correlated markets and assume your risk is zero. If we take the above example, except you go long AUDUSD and short NZDUSD; yes the USD components theoretically cancel each other out, but you still have long AUD and short NZD exposure. Also, correlated markets don’t always move in lockstep and in times of high volatility, the market can move violently in both directions in just a few minutes and take out both of your stops.
In general, you should never have more than two or three positions open at the same time, and you should try to avoid trading highly-correlated markets, or at least be aware of the risks.
Margin call and forced closure
If the equity in your account falls below 100% of your margin requirements, you will receive a margin call (in modern times this is just an email – no one will physically call you!). The margin call is informing you that you have insufficient equity in your account and you should either close some of your positions, or top-up your account with appropriate funds. You can close, or partially close your positions from your MT4 terminal, or log into your client area and top up your account with a credit card, or one of our other instant funding options.
If you ignore the margin call warning and your equity continues to fall, reaching 50%, your positions will be automatically closed and your floating losses will be realized. This is what’s known in trading circles as a ‘blown account’ – you will be left with a very small portion of your original balance. Exactly how little you are left with depends on how much leverage you were using and how many positions you had open. If you have lots of positions open, they won’t all be closed simultaneously, but progressively. This means you could be left with only a few dollars in your account. Blown accounts must be avoided at all costs.
It’s all on you
Though we can educate you in regards to proper risk management and notify you when your equity falls too low, at the end of the day, managing your position sizing and ensuring your account remains sufficiently funded, is your responsibility. VT Markets offers clients large amounts of leverage so our clients are free to trade in a manner that suits them and trade any strategy. Most scalping strategies for example, require large amounts of leverage, even when they are only risking 1 or 2%. If you are not scalping, chances are you don’t actually need a lot of leverage – consider setting your leverage to 50:1 or 100:1.
Leverage is an incredibly powerful tool if used correctly, but with great power, comes great responsibility, and that responsibility lies squarely with you.
The upside
If you trade with an appropriate amount of leverage, restrict your risk-per-trade to no more than 2%, size your positions appropriately and never open more than a couple of positions at any one time, it is nearly impossible to receive a margin call. Proper risk management is the difference between successful trading and gambling. Perfect risk management and you will be well on the path to becoming a profitable and successful Forex trader.
Forex risk: Reward and win rates
When trading a Forex currency pair, one of two things could happen – price could either go up or down. Your job as a trader is to be on the right side of this move. That is predict it correctly. Alright, so we have two possibilities, that’s essentially a 50/50 chance either way. Here lies the problem: If you win one, lose one, win one, lose one, etc how do you make money? Simple, all else equal, you won’t!
To make money trading Forex you need to have some form of edge. You either need to be able to pick the market correctly more than half the time (this is known as a positive win rate) or, win more than you lose on each trade (known as a positive risk to reward ratio). The best Forex traders will do both and achieve great success – not only do they pick markets right more often than not (this comes with experience), but they win more than they lose on each trade as well.
Imagine this: You place four trades, winning two and losing two. On each trade you have a stop loss of 10 pips and a take profit level of 20 pips. What’s your net result? +20, +20, -10, -10 = +20. You haven’t got any better at picking Forex markets since the first paragraph, but you are now trading with a positive risk:reward ratio. Instead of breaking even, you are now profitable! Your breakeven level falls from 50% to 33.33%. This is a 1:2 risk to reward ratio – your average losses are half the size of your average wins.
This is an example of a 1:2 trade – we are long EUR/USD, risking 80 pips to potentially make 160:

Note we could actually squeeze 1:3 out of this range:
If making 1:3 trades, you only have to be right 25% of the time in order to break even.
If you want to make money trading Forex you have to have some form of edge. Find your trading edge with VT Markets.
Trading economic data releases: News trading
The biggest and most obvious part of fundamental analysis is trading economic data releases, or more simply as traders call it: News trading.
So that everyone in the market has a level playing field when it comes to market sensitive news, each economic data release has a set time and date that it must be released. This means that at this particular time EVERYONE is watching and trading that particular Forex market. All this attention leads to volatile market conditions as everyone tries to outwit each other in the race to best position themselves.
There are literally hundreds of economic data releases every single day. Think about it. Every single country in the world releasing data such as unemployment, retail sales, GDP, trade balance. The list goes on forever. But just because a piece of economic data is released, doesn’t mean that it is relevant to you and your trade!
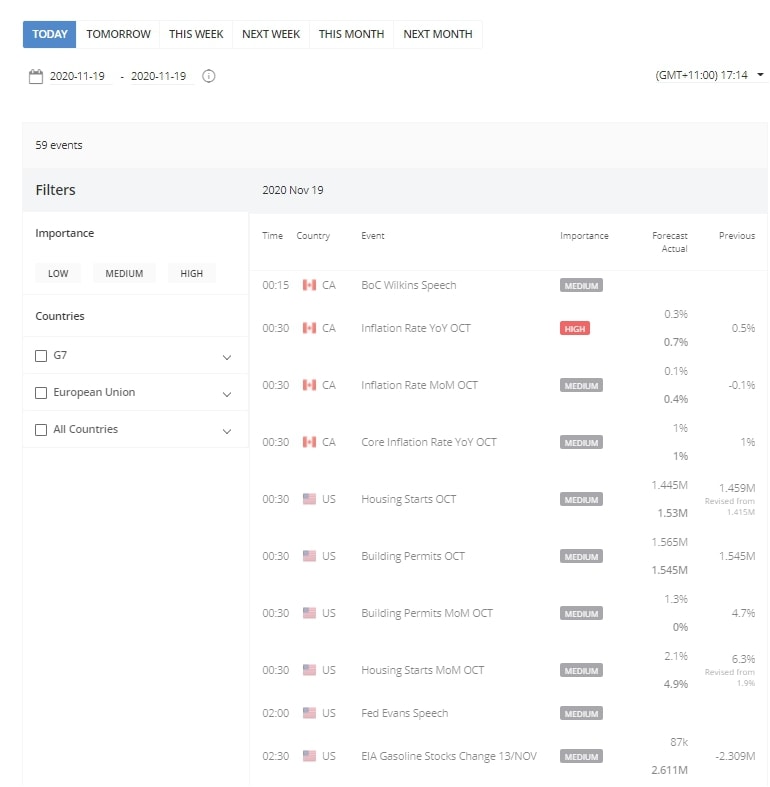
Our economic calendar allows you to filter news releases by both country and expected market impact, making sure you’re only focusing on the news that is most relevant to you and your particular Forex trade.
If you are trading EUR/USD, then the GDP of South Africa contracting shouldn’t really have too much of an effect on either the Euro or the US Dollar, should it? Of course not.
But on the other hand, a big and unexpected drop in the tier 1 US unemployment rate could have catastrophic effects on not only USD Forex pairs, but across the entire Forex market. This is because the US economy is still the biggest and weakness at the top of today’s interconnected world so easily sends shockwaves through the entire world. Do you remember the GFC?
Did you know:
“The US Non-Farm Payroll report is one of the most significant pieces of economic news on the Forex calendar. NFP, as traders refer to the release, is the monthly change in the number of employed people in the US economy with farming excluded. It is a major barometer for the health of the US economy and in term the globe.”
So where can you stay up to date with the most important economic data releases?
The VT Markets Forex Economic Calendar.
Our Forex economic calendar should be the first point of call for all traders starting their morning routine. As outlined above, the calendar can be fully customised and filtered to only show you the scheduled Forex data releases most important to you and your trades.
Trading central bank decisions: Hawkish vs. dovish monetary policy
To achieve certain economic mandates or goals, a country’s most potent weapon is monetary policy. Monetary policy is determined by a country’s central bank acting independent from government (unless you’re China of course!).
Monetary Policy is the process of setting the interest rate and controlling the supply of money.
There are three main goals that monetary policy helps a central bank achieve. Those being:
Economic growth targets.
Inflation in the target band.
Low unemployment.
Now we have gone through what monetary policy is, let’s go one step further. Have you ever heard monetary policy referred to as being Hawkish or Dovish? No, economists aren’t watching birds or performing magic tricks, they’re actually describing the types of monetary policy that central banks have at their disposal.
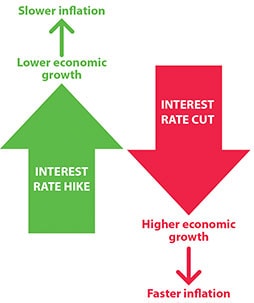
Hawkish monetary policy is indicative of rising interest rates. It is sometimes referred to as tightening because essentially the central bank is looking to tighten the economy and slow it down in the wake of higher inflation.
Under a hawkish scenario where interest rates are rising, the borrowing of money by both business and consumers becomes more expensive (due to higher interest repayments) so spending and investment decreases as a result.
Dovish monetary policy is the opposite, and indicative of falling interest rates. A central bank may decide to loosen monetary policy by cutting interest rates with the goal of stimulating a stagnating economy in mind.
Under a dovish scenario where interest rates are falling, money is being made cheaper and more accessible to business and consumers which encourages them to invest or spend. This spending then stimulates a stagnant economy.
By using the different types of monetary policy, a central bank can somewhat control, and in the end smooth the wild swings between the good and bad times experienced by an economy. Both economies and markets want stability and there is no point in experiencing huge booms if they are followed by equally as devastating busts in a regular business cycle.
Trading event risk: Trading headlines
After going through the highly organised data releases and central bank decisions, there is one last piece of fundamental analysis that you need to be aware of. Event risk is anything that will move markets, but that you can’t see coming.
News Headlines:
There are just so many different types of headlines that come from a whole range of different places. Some credible and some not. Funnily enough, it is often the least credible headlines that get the most attention from markets!
Keep an eye on the News Terminal for streamed news headlines that have the potential to move Forex markets. These could be central banker or politician comments, unexpected good or bad economic news or even something as wacky as a new life changing invention! If it’s something confronting flashing up on trader’s screens, so often they hit the buy/sell button first and ask questions later.
Natural disasters:
Natural disasters are one headline that nobody wants to read, but unfortunately for all of us, they are a fact of life. I’m sure you all remember the devastating Japanese earthquakes that rocked the island and triggered multiple tsunamis? This saw USD/JPY instantly shoot up as traders exited their Japanese Yen exposure and sought the safety of US Dollars.
Natural disasters aren’t something that the people can plan for, but they are reported instantly on social media wherever they happen in the world. You have no excuses if you let yourself get caught out by a natural disaster headline.
Terrorist attacks:
Terrorist attacks, declarations of war and political tensions all have an effect on Forex markets. In our recent memory we of course have the devastating attacks in the French capital of Paris. This saw money leave the Euro, as fears over what sort of an impact this would happen on consumer confidence and spending in the Eurozone, as well as a flight to US Dollars in the risk-off market.
It is almost a sad reflection on where human society is at right now, that a terrorist attack actually might not move markets at all due to the frequency that they occur and are now reported. If North Korea reporting the successful test of a hydrogen bomb can’t move markets, then really what will?
The question of whether being able to profit from events that often see such widespread loss of property and even life comes up here and isn’t something that we can ever answer. We do however say that these events are a fact of life in the world we live in today and first and foremost, you must manage your risk around them at the very least.
Types of forex charts
Forex traders use charts to determine market direction and identify possible buying and selling opportunities. There are three types of charts commonly used in Forex that you can flick between on MT4:
Line chart;
Bar chart;
Candlestick chart.
Line Chart:
These charts are handy for quickly determining the trend – only the current/close price is graphed – as such these charts should not be used for placing stop loss or take profit orders.
Bar Chart:
The chart is created with the use of bars where each bar has a high (top) and a low (bottom) with a line on either side; right side being the opening price and the left side being the closing price for the selected time period
Different colours can be used to identify bars that close higher than the open (bull or up bars) or lower than the open (bear or down bars). The example above has green lines for up bars and red bars for down bars. These charts show all the information you need but most traders and analysts tend to favour the third option – Candlestick charts.
Candlestick Chart:
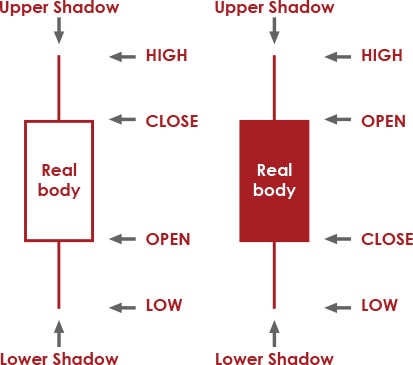
This chart is created much like bar charts, with the only difference being that candlesticks add dimension and colour to the Bar Chart by depicting the area of the bar between the open and close as a two dimensional real body.
Candlesticks are comprised of a body which represents the difference between the open and close prices. An up candlestick occurs when the close is higher than the open – and down candlesticks occurs when the close is lower than the high. In the chart example above, up candlesticks are green whilst down candlesticks are red. If the open is equal to the close there will not be a body, just a line – this type of candle is referred to as a “Doji”.
The thinner lines extending beyond the body are called ‘Wicks’ – above the body is the high and below the body is the low for the selected time period. A large wick (relative to the body), indicates a potential turning point (support/resistance).
Which type of chart do you prefer trading off? Flick between the three on your MT4 Forex demo account.
What is a candle?
Select the candle chart option on your MT4 platform when you open up your charts.
Candle patterns
In this section we’re going to take a look at trading off Forex candles on your MT4 charts. There are many different Forex candle patterns – we’ll have a look at some of the more common and reliable ones here. Candle patterns often indicate a turning point or reversal in the Forex market, so we’ll break this section up into ‘Bearish Reversal Candles’ and ‘Bullish Reversal Candles’.
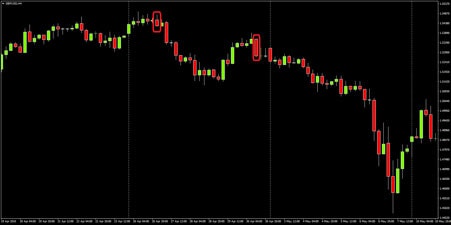
Bearish Reversal Candles
Shooting Star:
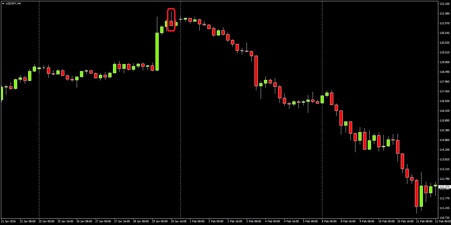
The Shooting Star is a single candle bearish reversal pattern that occurs at the end of an uptrend. Price initially moves higher, before eventually closing near the open, leaving a long wick with a short body. Wick should be at least 1.5x the length of the body. Note in the above example, this Forex candle leads to a decline of nearly 1000 pips in less than two weeks.
Bearish Engulfing:
The Bearish Engulfing is one of the more common bearish reversal and continuation patterns. The candle will close lower, with a body that completely engulfs the body of the relatively smaller previous candle. Note this candle continues to occur frequently throughout the down trend, signalling continuation (we have only circled two which occur at peaks).
Hanging Man:
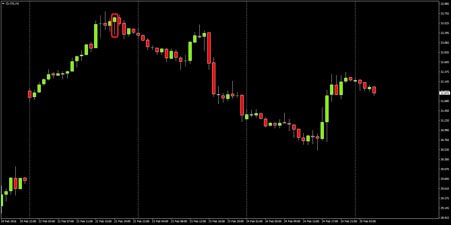
The Hanging Man is another relatively common bearish reversal candle that occurs at peaks. Price will move signifcantly lower at the start of the perioid but will come back to finish near the open, leaving a long wick and small body (simmilar to the Shooting Star, but the wick is below the candle not above). If this Forex candle occurs in the lows of a down trend it is a bullish candle known as a hammer.
Bullish Reversal Candles
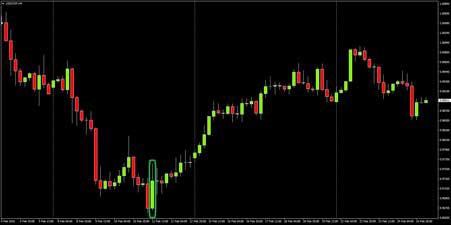
Bullish Hammer:
The Bullish Hammer is a common reversal pattern that looks identical to the Hanging Man candle but occurs in the bottoms of down trends. Price will move signifcantly lower at the start of the perioid but will come back to finish near the open, leaving a long wick and small body. Note in this example, the following candle actually breaches the Hammer’s low – Forex traders should always set their stop a reasonable distance from any reversal candle.
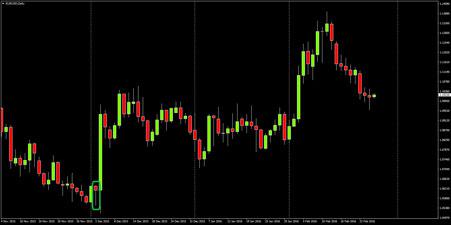
Bullish Engulfing:
The Bullish Engulfing is identical to the Bearish Engulfing but it is an up candle occuring at the end of a down trend. The body of the new candle will completely engulf the previous candles body signalling a major shift in sentiment.
These are just a few of the more common Forex candle patterns with high success rates. Remember some candles appear identical so you have to then determine whether the candle is appearing at a peak in an advance (Hanging Man) or at a trough in a decline (Bullish Hammer)?
Don’t forget to set your stops a safe distance from the relevant candle’s high/low – though many reversals are immediate, there is some times noise which you should adjust for.
Go back on your MT4 charts and see how many of each Forex candle pattern you can find and come up with a trading strategy around them.
Chart patterns (Part 1)
In this section we will cover chart patterns, these are patterns that are comprised of many candles and take considerably more time to form. Once again, there are multitudes of chart patterns to draw up on your MT4 platform, so we will try to only cover the more common and reliable patterns.
Head and Shoulders – Bearish Reversal Pattern
This is by far one of the most common and easy to recognise chart patterns, it is also the most reliable. Forex traders love these patterns for both their reliability and the fact they offer clear entry and stop loss levels:
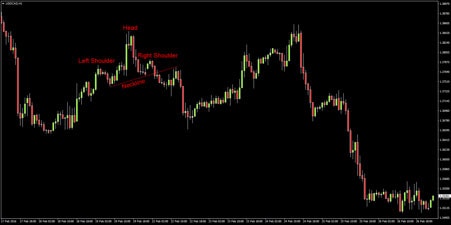
These patterns have four components:
Left Shoulder – small rounded top. Pattern is not yet visible
Head – Pair breaks above the left shoulder before retracing 100%, or the majority of the ascent – potential pattern visible to the keen eyed chart trader
Right Shoulder – pair forms a lower high to the right of the head, usually similar magnitude to left shoulder, but variance is not uncommon. Head and Shoulders top is now clearly visible.
Neckline – Though the chart pattern is now clearly visible, it is not a confirmed top until there is a break below the neckline. The Neckline connects the lows of the left and right shoulders. This is often a straight line, though in the above example it is ascending – patterns with ascending necklines are even more reliable than the standard, flat neckline Head and houlders.
Once price breaches the neckline, the trader enters short. Stop can be placed above the right shoulder, or above the head (depending on your risk tolerance). Note that price often comes back to test the underside of the neckline – this can be very handy if you’ve missed the original break and reinforces bearish bias. In this example, once price breaches the neckline, there is a ecline of over 100 pips.
Deformed Head & Shoulders – the above example was very clean, though some times, these patterns can exhibit ‘deformities’ such as dual or multiple right shoulders, descending neck lines or shoulders that exceed the top.
Cleaner patters tend to be more reliable, though the key to a successful trade is always waiting til the pattern is confirmed ie the Neckline breaks. Here are some examples of the above deformities:

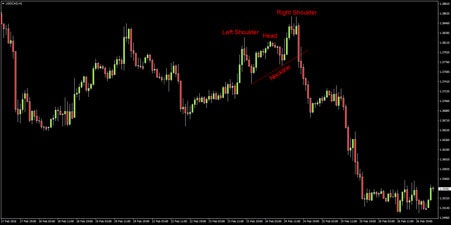
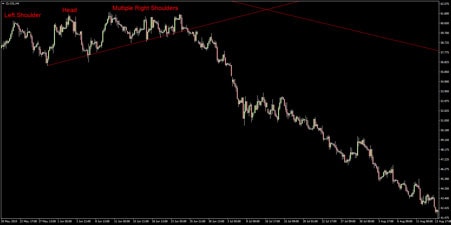
Head and Shoulders patterns are extremely reliable and offer the trader clear entry and exit points, but always remember – the setup is not confirmed until the neckline is breached.
Inverse Head and Shoulders – Bullish Reversal Pattern
As the name suggests, these patterns are identical to a standard Head and Shoulders, but appear upside down (on their heads) and signify a potential bottom. Not quite as reliable as the standard H&S, but still a very reliable pattern. These patterns are often more difficult to spot than their bearish counterparts, but recognition becomes easier as you gain charting experience.
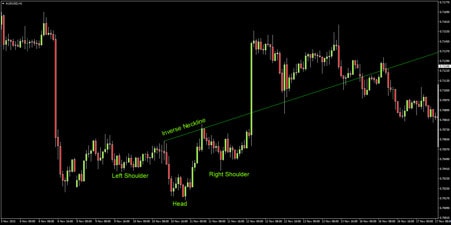
Once again, the key here is waiting til the neckline is breached.
Double Top – Bearish Reversal Pattern
The Double Top or ‘M’, is another reliable chart pattern favoured by many traders. Like the H&S, it offers the trader clear entry and stop loss levels. With the Double Top, the entry trigger is known as the Confirmation Line:
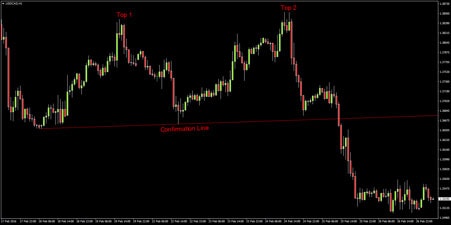
The Double Top is characterized by two tops of similar magnitudes, originating from roughly the same point. The Confirmation Line connects the two origin points and tends to be flat or ascending at a slight gradient. Just like the H&S, the trader does not enter short until the Confirmation Line is breached and the top is confirmed. Note the two tops often take the shape of H&S or smaller double top patterns (this M features the two H&S examples from earlier).
Double Bottom – Bullish Reversal Pattern
The Double Bottom or ‘W’ is the inverse of the Double Top – it’s shape is reminiscent of the letter ‘W’ and the pattern signals a potential bottom.
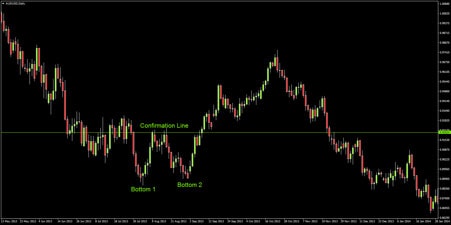
As with the other reversal patterns we’ve covered, the trader waits until the Confirmation Line is breached before entering a Buy position.
Chart patterns (Part 2)
Ascending Triangle – Bullish Continuation Pattern:
The Ascending Triangle is one of the most reliable bullish continuation or accumulation patterns. It is characterized by a series of higher lows failing at a flat top – this means it is a ‘terminal’ pattern – eventually price will have to stop carving higher lows, or more often than not, the top will have to break.
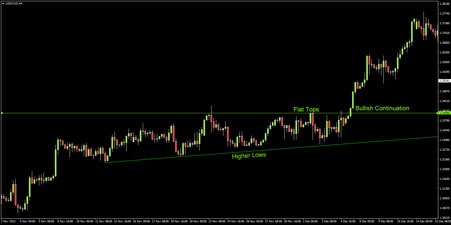
Just like the reversal patterns discussed in the previous section, the buy signal occurs when the top breaks and the pattern is confirmed.
Descending Triangle – Bearish Continuation Pattern:
The Descending Triangle on the other hand, is a very reliable bearish continuation pattern. The pattern is characterized by a series of lower highs meeting a flat bottom.
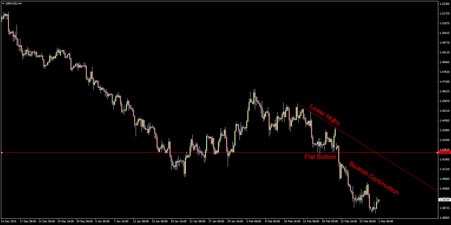
Traders will enter short when the flat bottom is taken out. As we discussed in the Trend Trading section, price can decline quite quickly in a bear market – these patterns often yield impressive moves lower.
Bull Flag – Bullish Continuation Pattern:
Bull Flags or Pennants are an extremely reliable bullish continuation pattern. They are deceptive to the novice trader as price is temporarily trending down, but at a relatively shallow pace. Bull flags are characterized by a series of parallel lower highs and lower lows within a dominant uptrend:
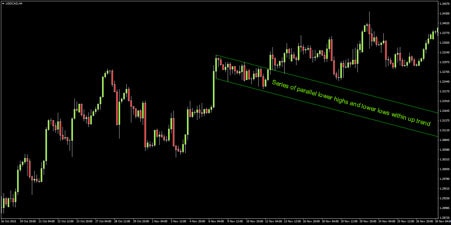
A buy signal is triggered when the upper parallel is breached.
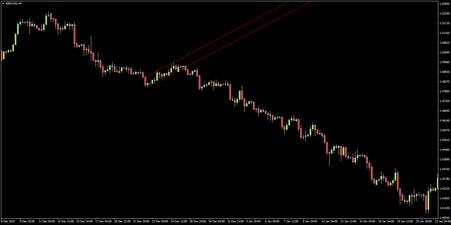
Bear Flag – Bearish Continuation Pattern:
The last continuation pattern we will look at is the Bear Flag. The opposite of the Bull Flag, characterized by a series of parallel higher lows and higher highs within a dominant down trend:
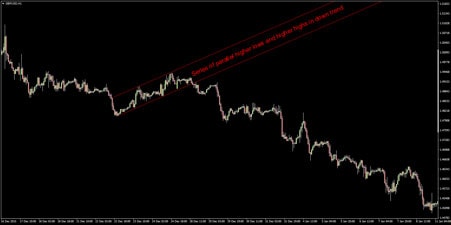
Traders will look to enter short once the lower parallel breaks. Just like the Descending Triangle, these patterns can lead to some fierce bearish continuation – in this case, GBPUSD declines over 800 pips in less than a month.
The Take Away: Chart patterns are often high probability, high reward trades that offer the trade clear entry and stop loss levels. Patterns are confirmed when the relevant line breaks – not before – wait for the breakout.
Support and resistance
In Forex trading, support and resistance refers to levels where price is likely to pause, bounce or even reverse. Support is a lower price point or zone where the currency pair is considered ‘cheap’, spurning buying interest. Resistance is an upper price point or zone where the pair is considered ‘expensive’ and is likely to encounter sellers:
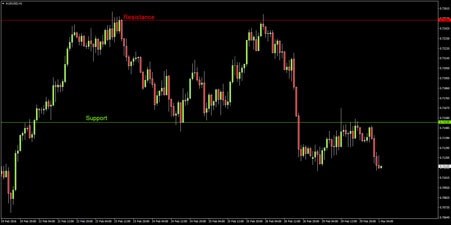
In the above example, the Australian Dollar is finding buyers around 7150, but encountering strong selling interest above 7250 – note pair spikes above 7250 resistance five times, but is unable to close above there. It is also worth noting that when there’s an hourly close below 7150 support, pair is then unable to close back above the level – former support is now acting as resistance:
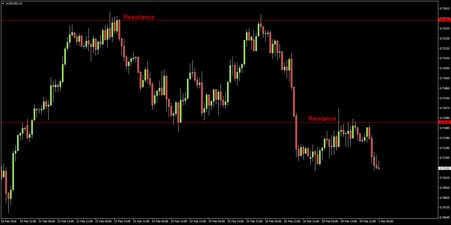
This is a fairly common occurrence in Forex trading – levels that previously encouraged buying interest will nearly always encourage selling interest after they break down (and vice versa).
You’ve heard the old saying “Buy Low, Sell High”? Forex traders look to sell into resistance and buy into support, this leads to higher probability setups, allows the trader to set tight stops and leaves plenty of room for rewarding trades.
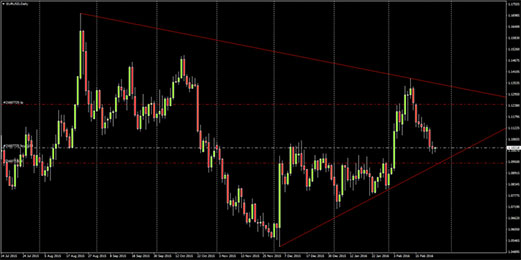
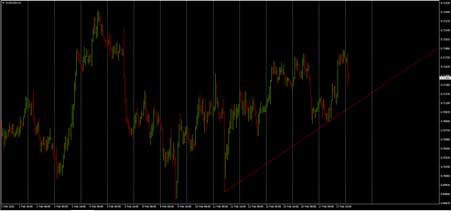
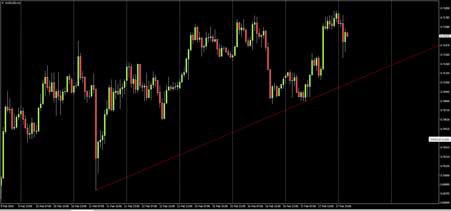
Now we’ve had a look a horizontal support and resistance, let’s take a quick look at trend resistance and support:
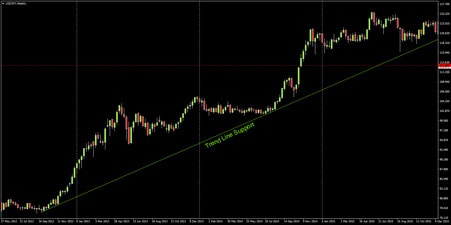
This is the trend line that supported USDJPY from September 2012 – January 2016. Note pair finds buying interest whenever price nears trend support.
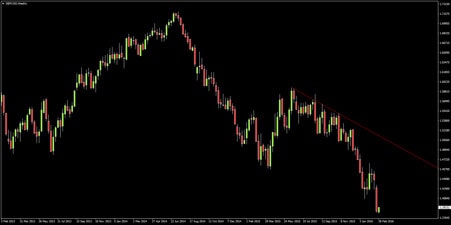
Here we have the recent down trend in GBPUSD, note pair is unable to close the week above trend line resistance and eventually turns lower.
Remember: If you want high probability, rewarding setups – Buy low, sell high – buy into support, sell into resistance.
Fibonacci
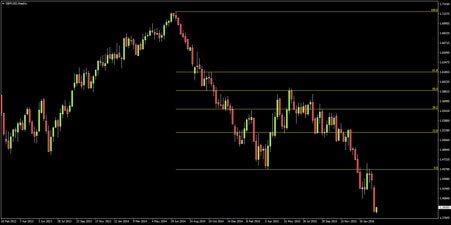
Fibonacci retracements are a quick and easy way of predicting support and resistance levels in Forex. The Fibonacci tool works on the principle that markets tend to ‘retrace’ a portion of a move prior to continuing the dominant trend. Traders use the Fibonacci tool on MT4 to connect the lows and highs of a recent trend, swing or range and the tool displays likely support and resistance levels derived from the Fibonacci Sequence (Golden Ratio). Fibonacci levels appear again and again in Forex – this tool is surprisingly reliable when it comes to predicting support and resistance:
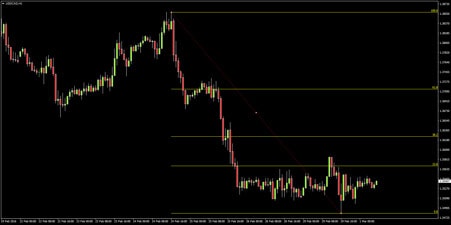
This is the recent down move in USDCAD. If we use the Fibonacci tool to connect the previous peak to the range low, we are shown three potential resistance levels. The standard Fibonacci retracement levels are 23.6, 38.2 & 61.8, but many traders also use the 78.6 and 50 levels. 50 is not actually derived from the Fibonacci sequence, but the importance of the level cannot be denied – 50% retracements are very common place:
Let’s take another look at USDCAD:
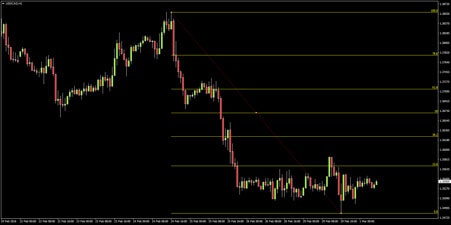
Despite a false break above in late February, pair is essentially capped by the 23.6 Fib. Above the 23.6 we have the 38.2, a break above the 23.6 would likely encounter resistance here. These levels are very common; a trend can retrace these percentages and still be considered healthy. Next we have the 50% mark, note this level is important as it coincides with former support. Above 50% and traders are beginning to question the recent move – is this a retracement or a reversal? Having said that; 61.8 retracements, prior to continuation are also fairly common. The 78.6 is considered the be all and end all – if a pair retraces more than 78.6% of the prior move, chances are it’s heading straight back to the origin (100%). It may have completely reversed direction or is range bound.
A trader with a bearish bias on USDCAD would wait for a break above the 23.6 and look for a reaction at one of the higher fib levels, before entering short. On the other hand, a trader with a bullish bias might trade a break above the 23.6 with a stop below the recent lows, or wait for a break above one of the higher fibs.
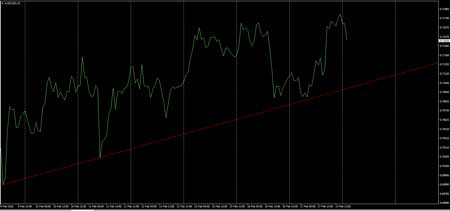
The previous examples were all assessing down moves; let’s take a look at an up move:
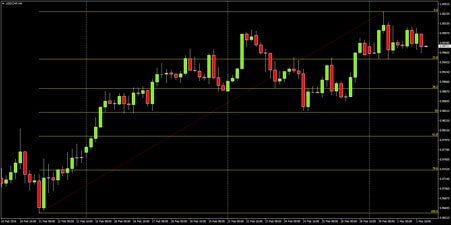
The process is the same, but instead of dragging the Fibonacci tool from the high to the low; we drag it from the low to the high. A trader looks at this chart and see’s USDCHF is trending up and decides they want to buy. They know not to buy into resistance, so they use the Fibonacci tool to identify probable support levels. They notice that price seems to be respecting the 50% level and decide they will attempt to enter long there. They have two options:
1) Watch and wait for a correction to, reaction at the 50% level
2) Place a Buy Limit order just above the 50% level
The first option is probably ‘safer’, as the trader is not blindly buying into a potential support level. On the other hand, the second option means the trader does not have to sit and watch the market. Either way, our trader has four options for placing their stop, depending on their risk tolerance:
1) A tight stop just below the 50% level
2) A more reasonable stop below the 61.8
3) A considerably looser stop below the 78.6
4) A stop below 100 – if price moves below here the trader’s bullish bias is unquestionably invalidated as pair has set a new low
The first option is likely a little too risky, most traders would probably opt for the balanced choice under the 61.8. With the latter two, the trader risks holding on to a losing position for longer than necessary and is sacrificing reward.
Fibonacci Retracements are a great way of identifying potential support and resistance levels. When analysing a down move, the trader uses the tool from the high to the low. When looking at a rally, the trader drags from the low to the high. The standard 23.6, 38.2 and 61.8 Fib levels are great, but many Fibonacci traders add in the 78.6 and 50 levels too. Trade breaks of key Fibs or reactions, depending on your strategy and bias.
Moving averages – Basics
Moving averages – Crossovers
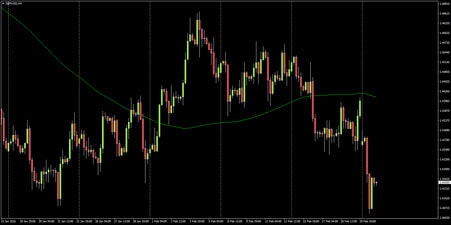
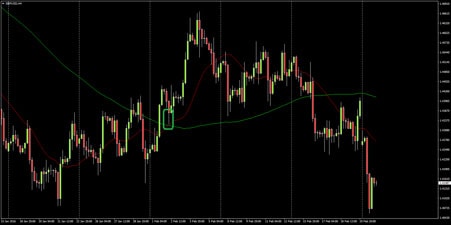
In the last section we introduced Moving Averages or Mas. We used a single MA in isolation and let it guide us into possible buying and selling opportunities. We used the 100SMA (100 Period Simple Moving Average) on a 4 hour GBP/USD chart – this is a relatively ‘slow’ MA. In this section, we will take our look at MA’s a little further and look at Moving Average Crosses using both a ‘fast’ and ‘slow’ MA:
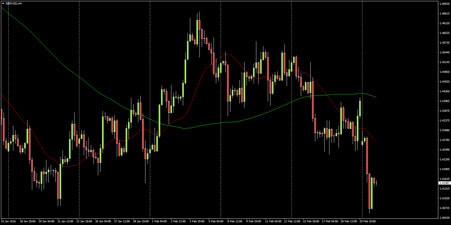
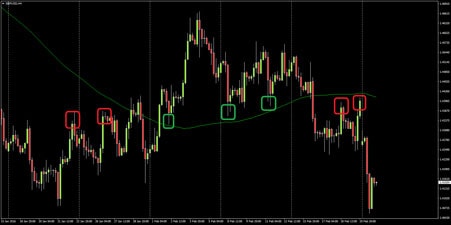
We have kept the ‘slow’ 100SMA from the previous section (green line) and added in a ‘fast’ MA: the 20SMA (red line). In the previous section, we looked at price’s relation to the 100SMA and used that to determine our buying/selling bias. Here we will go a little further and look at the relationship between the fast and slow MAs. Note that when the fast MA (red) crosses above the slow MA (green) on the 2nd of February, GBP/USD appreciates over 300 pips.
However, when the fast MA crosses back below the slow on the 17th of February, GBP/USD eventually declines around 240 pips (this move is probably still active):
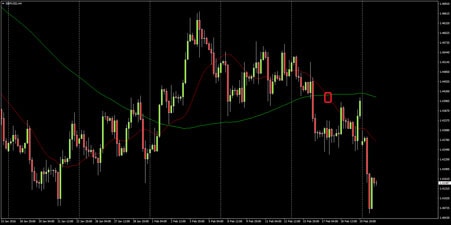
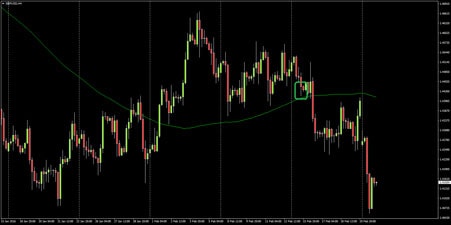
“But it went up first!” you say?
True, but note after the Fast MA crossed below the slow MA, price never again breached the slow MA ie a trader with his stop above the 100SMA survived the noise and caught the move lower.
Note that this approach is a lot more systematic than the subjective selling highs/buying lows strategy in the previous section. Trading systematically takes the guess work out of Forex trading and tends to be less taxing mentally than pure discretionary trading.
Wondering where to exit the trade? A lot of Forex traders simply take a multiple of their stop loss for their profit target, but this might not be for you.
In the next section we will discuss another type of indicator; the Oscillator. Oscillators can be very handy when determining whether or not an instrument is oversold/overbought and hence, when to exit.
RSI – Basics
In the last section we looked at Moving Average crosses and using Moving Averages to determine the trend. In this section we will move on to a new type of indicator – the Oscillator. Unlike the MA, Oscillators tend to appear below your MT4 chart in a separate window. We’re going to take a look at one of the most common oscillators, the Relative Strength Index or RSI:
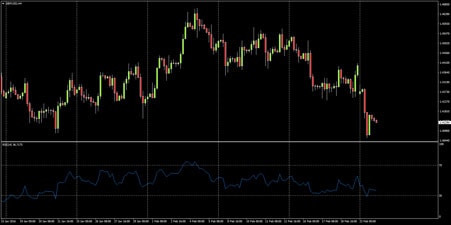
RSI looks at an instrument’s ability to close higher/lower over a given period. When RSI is above 70, a Forex currency pair is considered ‘overbought’ and when it’s below 30, it’s considered ‘oversold’. It’s important to note that just because a security is overbought/oversold, does not mean it’s going to reverse – Indicators can read overbought/oversold for extended periods of time. A sell signal does not occur until RSI crosses back from overbought/oversold into the 70-30 range:
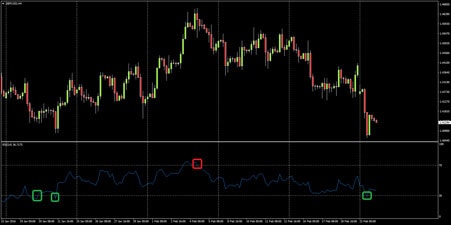
Let’s look at the first buy signal – when RSI crosses back above 30 on the 20th of Jan. Note that the Forex pair actually sets a new low (and issues a second signal) before moving higher. The first signal occurs at 1.4182, the new low is over 100 pips lower at 1.4079 – chances are most traders would have been stopped out on this signal.
The second buy signal is better, but there is still significant whip saw before the trader eventually nets 380 pips. This sell signal tells the trader to exit their long and go short – the Forex trader then proceeds to make another 422 pips before the next buy/exit signal!
So let’s have a look, our hypothetical RSI trader’s first trade was a loss of 100 pips, before making 380 and 422 pips on his second and third trades. That’s 2 wins out of 3 trades, with a net profit of 702 pips!
But what now? RSI is telling the Forex trader to buy even though the currency pair has just broken below the late February lows. The trader could well lose 110 pips on this signal. That would bring their win rate down to a more realistic 50% and net profit to 590 Pips.
What if our trader had ignored buy signals? GBP/USD is in a major down trend after all. Well, we would have had 1 trade, 1 win and net profit of 422 pips. Over such a small sample size it is hard to compare the two, but long term testing shows better performance when trading RSI with the trend.
RSI – Trading divergence
In the previous Forex education section, we introduced the Relative Strength Index (RSI) and buying and selling when the indicator crosses back from oversold and overbought. In this section we will move past the basics and introduce a more advanced concept: Divergence.
Divergence occurs when a Forex currency pair makes a new high or low and the indicator (in this case RSI) does not confirm:
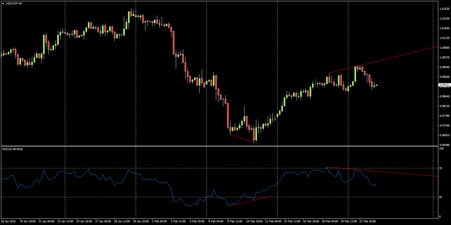
This is a 4 hour chart of USD/CHF which shows both bullish and bearish RSI divergence. Bullish divergence occurs when price move to new lows, while RSI carves a higher low.
Conversely, bearish divergence occurs when price moves to new highs, but RSI stops short of the previous peak. We’ve highlighted bullish (buy) signals in green and bearish (sell) signals in red:
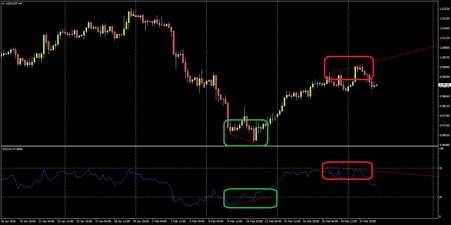
The buy signal (green), yields over 200 pips before a basic overbought cross tells the Forex trader to exit. Note that there is a slight pause between this exit signal and the bearish divergence signal. This move is yet to play out, but the Forex pair has already declined 90 pips. Let’s take a closer look:
Note that before the bullish divergence signal, RSI issues 3 basic buy signals as it crosses back above 30 (red crosses). The first two are pretty shocking; USD/CHF declines over 250 pips before eventually turning higher. The third signal is comparably better – the pair only declines around 115 pips before the bullish reversal. Conversely, the bullish divergence signal coincides perfectly with the actual bottom.
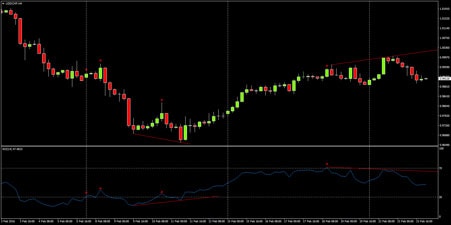
There is only one basic sell signal before the bearish divergence – USD/CHF appreciates another 50 pips before the top – this is not as bad as the false buy signals, but there’s always room for improvement. This time, the divergence signal does not coincide with the top perfectly – but the difference is negligible – approximately 5 pips.
A Forex trader taking basic RSI signals on their MT4 platform would have had at least 1 losing trade with this example (possibly 3 depending on their stop loss). On the other hand, a divergence Forex trader would have netted two winners and not lost a single trade.
The take away: A Forex trader who waits for divergence, will likely avoid some losing trades and enter the market at a better price than your basic RSI trader. This allows for tighter stops and easier targets and should yield an improved win rate. RSI often precedes moves in price. Meaning that RSI will often begin to trend up/down before price does – this can give the divergence Forex trader a profitable head start over your average price action Forex trader.
Accepting losses and learning to trade forex systematically
Even the best Forex traders in the world have losing trades – losing is a part of trading – but how do you react when you lose? How do you feel? If you’re angry or sad; chances are you were risking too much, or taking a trade you knew you shouldn’t – or both.
Whether looking at a successful breakout trader, trend follower or scalper; there is always a common theme: they all have a trading system and they stick to it. These traders don’t get emotional when they take a loss; they were trading according to their rules and the trade didn’t work out. They lost a pre-determined amount they were comfortable with and accept it as an unavoidable part of trading. They move on to the next trade, knowing their system is profitable over the long term.
An inexperienced Forex trader might open a long position in an uptrend thinking the market is continuing to move up. They didn’t put a stop loss on the trade, as they were confident about the overall direction and worried about getting needlessly stopped out. They think “I’ll exit if it moves against me” … Bearish news breaks and the market quickly move 100 pips against them. They are now looking at a 100 pip loss when it could have been limited to a fraction of that.
Now what? The market snaps back 50 pips. The inexperienced trader is relieved “maybe it’s going back up?!”. BAM! classic 50% retrace before continuation: the market falls another 100 pips. This is too much for our trader; he finally cuts the trade at the lows, losing 150 pips. Over the next few sessions the pair recovers to his original entry and beyond, in line with the trend. Did they do the right thing, cutting at -150? Maybe – it well could have continued to fall.
The fact is, our trader should have never been in this position in the first place and was forced to make a less than optimal decision. If they’d had a clear exit strategy in place, there would have been no question about what to do. Their stop loss would have been hit or they would have exited manually, (yet systematically) for a much smaller loss.
Whether your entries are discretionary or systematic, you should always have a clear exit plan for each and every trade. Don’t be left saying “What do I do?”
Plan your exit and react accordingly.
Managing greed in forex trading
If you want to be a successful Forex trader, greed is probably the biggest obstacle you’ll have to overcome. If you try to get rich on every trade, you’ll more than likely end up blowing your account – slow and steady wins the race. It’s the great paradox that all traders face – if you want to get rich quickly, you have to do it slowly.
Imagine you’re risking your entire balance on a trade. Sure you might win the first two, or three trades and triple your balance a few times, but eventually you’ll lose one (and lose everything!). Now what if you were still aiming to make double your risk when you trade, but only risking 1% per trade? Say you place 10 trades in a week and get half of them right – 5 winners/5 losers:
1. -1%
2. +2%
3. -1%
4. -1%
5. +2%
6. -1%
7. +2%
8. +2%
9. -1%
10. +2 %
Total = +5%
Okay, so with your modest $5000 balance that might not be life changing ($250 a week)… but what happens when you compound that return over a year?
5,000 x 1.0552 = $63,214
That’s a return of over 1,260% without ever risking more than 1%. Now work out the return for the following year!
You can get rich relatively quickly through trading Forex, but it doesn’t happen overnight. It happens over hundreds, if not thousands, of systematic, high probability and low risk trades. In order to ‘get rich quick’, you have to be patient – If you truly want to satisfy your greed, keep it in check.
Are you ready to take the next step in your Forex trading? It’s time to open a live account with VT Markets!
سجّل
قم بالتسجيل للحصول على حساب التداول المباشر الخاص بشركة VT Markets.قم بالإيداع
قم بتمويل حسابك عبر طريقة الدفع المفضلة لديك.اكسب عوائد
تلقى عائد 13% سنويًا عندما تبقى نشطًا*