




Key Points
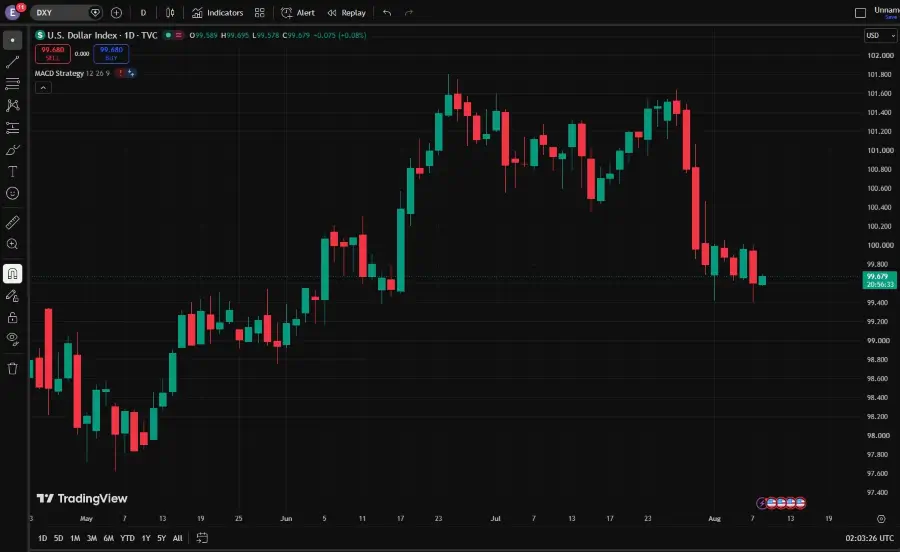
- The US Dollar Index (DXY) is holding around 99.6, near its lowest level since early June.
- US payrolls unexpectedly fell by 23,000 in July, while the unemployment rate edged down to 4.1%.
- The weak labour data reduced expectations for a September Federal Reserve rate hike and pushed Treasury yields lower.
- Markets are now looking to US inflation data for further clues on the Fed’s policy path.
- DXY is approaching a key technical area around 100 as traders assess whether the recent decline can extend.
The US dollar remains under pressure after a weaker-than-expected US jobs report changed expectations around Federal Reserve policy.
The US economy unexpectedly lost 23,000 jobs in July, against expectations for an increase. Previous employment figures were also revised lower, although the unemployment rate edged down to 4.1%.
The Dollar Index subsequently fell to around 99.5 and was holding near 99.6 on Monday, close to its lowest level since 2 June.
For currency markets, the main issue is how the weaker labour data affects expectations for US interest rates.
Why Traders Are Watching DXY
The employment report reduced expectations for a September Fed rate hike. Market pricing for a September hike had fallen below 50%, while Treasury yields also moved lower following the data. Lower expected US rates can reduce the relative yield appeal of dollar assets, putting pressure on DXY.
The next major test is inflation. Investors are awaiting the July CPI for further evidence on whether the Fed has room to maintain its current policy stance or whether persistent price pressures could keep rates higher for longer.
Core CPI is expected to rise 0.2% month on month and 2.5% year on year.
Key Trading Levels
| Price Level | What Markets Are Watching |
| 100.5 | Key resistance if the dollar recovery strengthens. |
| 100.0 | Immediate resistance and first recovery level. |
| 99.7 | Current trading area and short-term reference. |
| 99.5 | Key support following the recent decline. |
| 99.0 | Next support if selling pressure increases. |
| 98.5 | Deeper support if the downside move continues. |
DXY remains below the 100.0 level after its recent decline, leaving the short-term structure relatively cautious.
A move back above 100.0 would bring 100.5 into focus as the next resistance, while a break below 99.5 could expose 99.0 and potentially 98.5.
The immediate trading range is therefore centred around 99.5–100.0, with the next directional move likely to depend on which side of this range gives way.
Bullish and Bearish Setups
| Setup | Trigger | Potential Market Reaction |
| Dollar Recovery | Move above 100.00 | DXY may attempt to recover towards 100.50. |
| Bullish Continuation | Break above 100.50 | Buyers may regain control and extend the recovery. |
| Range Consolidation | Hold between 99.50 and 100.00 | Price may stabilise while markets reassess the next direction. |
| Bearish Breakdown | Fall below 99.50 | Selling pressure may increase towards 99.00. |
| Further Weakness | Break below 99.00 | DXY may move towards the 98.50 support zone. |
A bullish scenario would develop if DXY moves above 100.00, potentially shifting attention towards 100.50.
A bearish scenario would emerge if DXY breaks below 99.50, putting 99.00 and 98.50 on the downside map.
Disclaimer
The price levels and market scenarios above reflect the author’s view at the time of writing and do not represent financial advice or an official recommendation from VT Markets. Traders should conduct their own analysis and manage risk carefully.
Why Trade DXY as a CFD?
DXY CFDs provide exposure to movements in the US dollar against a basket of major currencies without directly owning the underlying currencies.
This allows traders to monitor broader dollar strength alongside individual currency pairs such as EUR/USD, GBP/USD and USD/JPY.
CFDs are leveraged products and can result in losses as well as gains.
Start trading indices with VT Markets today.
What to Watch Next
The US dollar’s next direction will depend largely on how upcoming US economic data shapes expectations for Federal Reserve policy.
Key factors include:
- US CPI Data: Inflation trends that could influence expectations for the Fed’s September policy decision.
- US PPI Data: Producer-price trends that could provide further clues on inflation pressures.
- Retail Sales: US consumer spending data that could offer additional insight into economic momentum.
- Fed Rate Expectations: Changes in market pricing for the timing and pace of potential rate moves.
- Treasury Yields: Movements in US yields as interest-rate expectations adjust.
- Major FX Pairs: EUR/USD, GBP/USD and USD/JPY movements as the dollar responds to changing expectations.
- Risk Sentiment: Broader shifts in market risk appetite that could influence demand for the US dollar.
From a technical perspective, traders are watching 100.00 as the key recovery level, while 99.50 remains the immediate support area.
Frequently Asked Questions
Why is the US Dollar Index falling?
DXY has weakened after July US payrolls unexpectedly declined, reducing market expectations for a near-term Fed rate hike.
What happened to US jobs in July 2026?
US payrolls unexpectedly fell by 23,000, while the unemployment rate edged down to 4.1%. Previous employment figures were also revised lower.
What could support the US dollar?
Stronger US inflation or other economic data could reinforce expectations for higher US interest rates and potentially support the dollar.
What are the key DXY levels to watch?
The immediate levels are around 99.5, followed by 100.00 on the upside. On the downside, 99.0 and 100.5 are the next reference areas.
What is the next major catalyst for DXY?
The US CPI is the key near-term catalyst, followed by PPI and retail sales later in the week








