





Key Points
- SP500 and other US futures declined ahead of key US economic data.
- Higher Treasury yields and a stronger US dollar continue to pressure growth stocks and broader equity valuations.
- The upcoming PCE inflation report, ISM manufacturing data and non-farm payrolls report will likely influence expectations for future Federal Reserve policy.
- The SP500 remains near record levels, but short-term momentum has weakened after failing to extend recent gains.
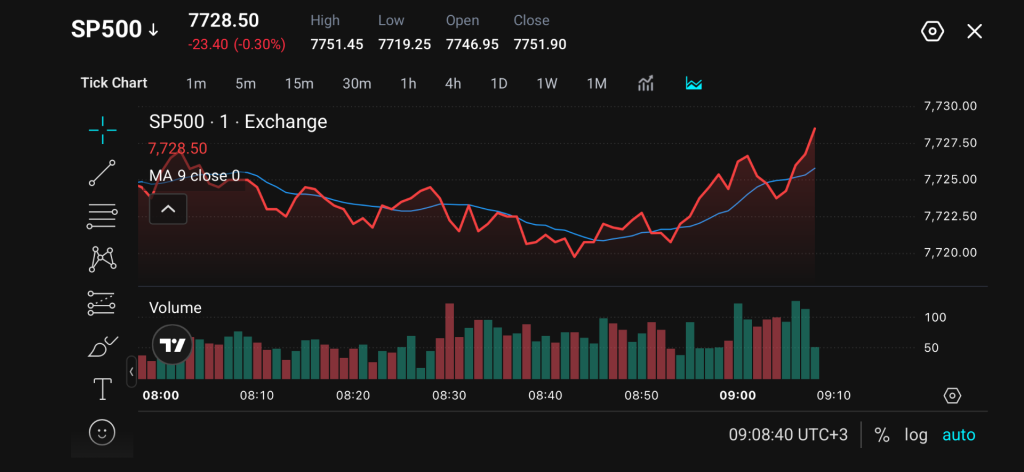
- The index is trading around 7,728, with price recovering above the short-term MA 9 indicator.
Market Move
The SP500 started the week low as investors assessed elevated yields, currency strength and upcoming economic data. SP500 futures fell around 0.3%, while Nasdaq futures declined approximately 0.5%, reflecting renewed caution toward technology and growth shares.
SP500 is currently trading around 7,728, slightly above the MA 9, suggesting short-term buying interest has returned after the earlier pullback.
Momentum remains limited as traders await signals for the next move. The next big driver includes US inflation data and employment figures, which could affect expectations for interest rates and market positioning.
Why Traders Are Watching
US stock futures provide an early indication of market sentiment before the regular Wall Street session opens. Movements in S&P 500 futures and Nasdaq futures can signal how investors are positioning ahead of major economic data and changes in interest rate expectations.
As the SP500 is trading near elevated levels, traders are watching whether the index can hold key support areas or regain upward momentum as markets adjust to changing inflation, oil prices and rate expectations.
Key Trading Levels
| Level | Price Area | Significance |
| Resistance 1 | 7,750 | Recent intraday high and immediate upside barrier |
| Resistance 2 | 7,780 | Potential breakout area if buyers regain momentum |
| Support 1 | 7,720 | Intraday support near recent lows |
| Support 2 | 7,680 | Previous consolidation zone and downside reference |
The index is currently testing whether buyers can maintain control above the 7,720 support area. A sustained move above 7,750 would suggest renewed upside momentum, while a break below 7,720 could expose the market to further downside pressure.
Bullish and Bearish Setups
| Scenario | Key Condition | Potential Direction |
| Bullish Setup | Price breaks above 7,750 and holds above the MA 9 | SP500 may retest 7,780, followed by 7,820 |
| Bearish Setup | Price falls below 7,720 and loses short-term support | SP500 may move towards 7,680, followed by 7,620 |
A bullish scenario would develop if the SP500 breaks above the 7,750 resistance level and maintains trading momentum above the MA 9 indicator. This would suggest buyers are regaining control after the recent consolidation phase.
A bearish scenario could emerge if the SP500 fails to hold the 7,720 support level. A break below this area would indicate that sellers are gaining strength after the recent recovery attempt.
Disclaimer
The price levels and market scenarios above reflect the author’s assessment at the time of writing. They do not represent financial advice or an official recommendation from VT Markets. Traders should conduct their own analysis and manage risk carefully.
SP500 Prediction: Major Drivers
The SP500 remains in a broader uptrend, but short-term direction will likely depend on upcoming inflation and labour market data.
If economic data supports a softer inflation outlook, traders may continue pricing a more supportive environment for equities. In this scenario, the index could attempt to regain recent highs. However, stronger inflation or employment data could keep Treasury yields elevated, creating pressure on equity valuations.
If oil prices stabilise or retreat, inflation concerns may ease, potentially allowing Treasury yields to moderate. Lower yield pressure could provide support for equities and improve risk appetite, giving the S&P 500 room to challenge higher levels.
If oil prices continue climbing, investors may become more cautious. Higher energy costs could keep inflation expectations high, reducing expectations for monetary policy easing and putting additional pressure on US indices.
Trade SP500 with VT Markets
The S&P 500 remains closely watched during periods of technology-sector volatility, major economic releases and shifting Federal Reserve expectations.
With VT Markets, traders can access SP500 and other index CFDs alongside forex, gold, oil, share CFDs, ETF CFDs and other global markets through one platform. This allows traders to monitor broad market movements while comparing developments across technology stocks, commodities, currencies and other major asset classes.
Use VT Markets’ charting tools to monitor support, resistance, moving averages and breakout behaviour as the next SP500 setup develops.
Learn more about trading Indices on VT Markets today.
Frequently Asked Questions
What is driving the SP500 lower today?
The SP500 is under pressure from higher Treasury yields, a stronger US dollar and caution ahead of key US inflation and employment data.
Why are traders watching the PCE inflation report?
The PCE report is closely monitored because it provides insight into inflation trends and may influence expectations for future Federal Reserve interest rate decisions.
What are the key SP500 levels to watch?
The immediate resistance level is around 7,750, while support is located near 7,720. A break above or below these levels may signal the next short-term direction.
How do Treasury yields affect the SP500?
Higher yields can increase financing costs for companies and reduce the relative appeal of equities, particularly growth-focused stocks. Lower yields may provide more support for equity valuations.
Start trading now — click here to create your real VT Markets account.








