





Key Takeaways:
- A momentum trading strategy aims to buy assets rising strongly and sell or short those falling fast, riding the move while it lasts.
- Momentum is measured with technical indicators such as the RSI, MACD, moving averages and the Rate of Change, not guessed by eye.
- It is close to trend following, but it focuses on the speed and strength of a move rather than only its direction.
- Momentum works across forex, stocks, indices, commodities and crypto, on platforms like MetaTrader 4 and MetaTrader 5 at VT Markets.
- Clear entry and exit points, sensible position sizing and strict risk management separate a profitable approach from a costly one.
Markets rarely move in straight lines. However, when they pick a direction and run, that motion is hard to ignore. A momentum trading strategy is built to ride it. The idea is simple. Assets already moving strongly tend to keep moving the same way, at least for a while.
This guide explains what a momentum trading strategy is and how it works. We build one step by step, compare the best indicators, run worked examples and cover the risks. You will also see how to apply momentum across forex, stocks, commodities and crypto on MetaTrader 4 and MetaTrader 5.
What is a Momentum Trading Strategy?
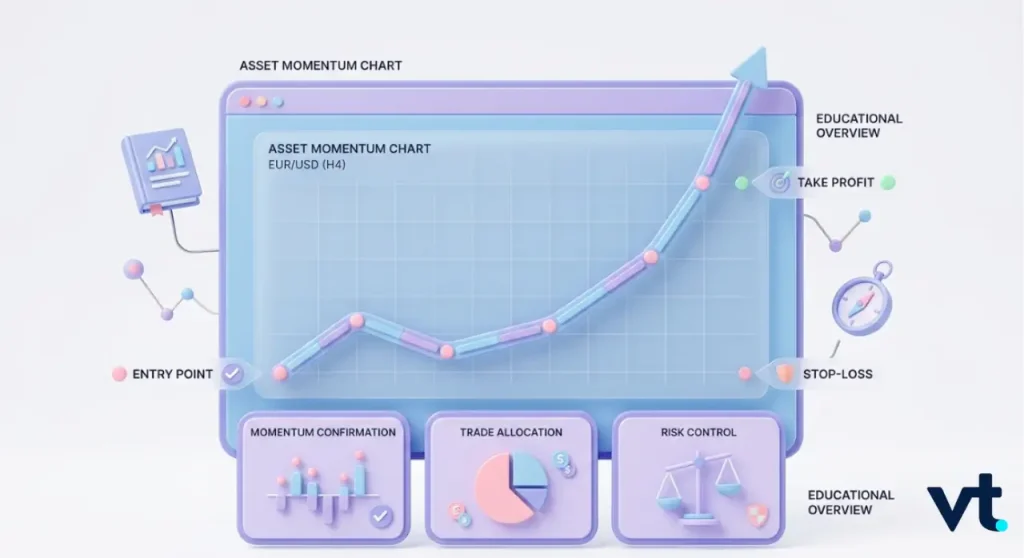
A momentum trading strategy focuses on the strength and speed of a price move. It does not ask whether an asset is cheap or expensive. It asks whether the asset is moving, and how fast. When the move is strong, momentum traders join it in the same direction.
In practice, traders use the approach to:
- Buy assets showing strong upward, or bullish momentum
- Sell or short assets showing strong downward, or bearish momentum
- Exit quickly once the move begins to lose steam
What Does Momentum Mean in Trading?
Momentum is the rate at which a price changes. Think of a moving car. Speed is how fast you are going. Momentum is how hard it would be to stop.
- Strong momentum means a market is moving far and fast.
- Weak momentum means price is drifting with little conviction.
It is measured with indicators, not judged by eye. The most common are:
- The relative strength index (RSI)
- The moving average convergence divergence (MACD)
- Moving averages
- The rate of change (ROC)
How is Momentum Trading Different from Trend Following?
Momentum trading and trend following are close cousins, and often confused. The difference is simple:
- Trend following focuses on direction. It asks whether the market is rising or falling, then stays in the move while the direction holds.
- Momentum trading focuses on strength and speed. It asks how powerful the move is right now, and favours the fastest movers.
| Feature | Trend following | Momentum trading |
| Main focus | Direction of the move | Speed and strength |
| Typical hold time | Weeks to months | Hours to weeks |
| Entry trigger | Confirmed trend | Acceleration, new highs or lows |
| Exit style | When direction changes | When momentum fades |
How Does a Momentum Trading Strategy Work?
A momentum trading strategy works in three stages: find an asset moving strongly, confirm that strength with indicators, then ride the move with a planned exit. The aim is not to call the exact top or bottom, but to capture the middle of a strong move. A typical process looks like this:
- Scan markets for assets making new highs or lows
- Confirm the move with a momentum indicator
- Enter in the direction of the move
- Use a stop-loss order to cap the downside
- Trail your stop or exit when momentum fades
Why Does Momentum Exist in Financial Markets?
Momentum exists partly because people are slow to react. When news hits, prices drift towards fair value over days and weeks. Three behaviours help it persist:
- Herding: Traders pile into assets that are already rising.
- Anchoring: Investors update their views slowly, so prices catch up gradually.
- Fund flows: Strong performers attract fresh buying from funds and retail traders alike.
None of this guarantees a move continues. However, it explains why strong moves often have further to run.
What Signals do Momentum Traders Look for?
Momentum traders rely on repeatable signals, not gut feel. The most common include:
- New highs or lows over a set period, such as 20 or 50 days
- Rising trading volume that confirms genuine interest
- A rising RSI that holds above the midpoint
- A MACD line crossing above its signal line
- Price holding above key moving averages
When several line up at once, the signal is far stronger than any one alone.
How to Build a Momentum Trading Strategy Step by Step
Building a momentum trading strategy need not be complicated. A clear, rules-based plan beats a clever but vague one. Here is a simple framework to adapt.
How do You Identify Momentum in a Market?
Define what strong means for you. A common method measures the rate of change over a fixed lookback period.
A worked example using the rate of change (ROC):
- ROC = [(Current price − Price n periods ago) ÷ Price n periods ago] × 100
- EUR/USD trades at 1.0800 today and sat at 1.0500 ten days ago
- ROC = (1.0800 − 1.0500) ÷ 1.0500 × 100 = +2.86%
A positive, rising ROC points to bullish momentum. A negative, falling ROC points to bearish momentum. The further from zero, the stronger the move.
How do you set Entry and Exit Rules for your Momentum Trading Strategy?
Clear entry and exit points keep emotion out of trading. A momentum trader might use rules like these.
Entry rules (example):
- Price breaks above its 20-day high, a simple form of breakout trading
- RSI is above 50 and rising
- The MACD line is above its signal line
Exit rules (example):
- RSI falls back below 50
- Price closes below a short moving average
- A trailing stop is hit
Written rules turn a vague idea into a testable plan you can check against history first.
How do you Size Positions and Manage Exposure?
Position sizing is where many strategies fall apart. Risk a small, fixed share of your account on each trade.
A simple position sizing example:
- Account balance: $5,000
- Risk per trade: 1% = $50
- Stop-loss distance: 25 pips
- Maximum loss per pip = $50 ÷ 25 = $2 per pip
Match a position size to $2 per pip, roughly 0.2 lots in most majors. Two habits protect the account:
- Avoid stacking correlated trades, since they can turn against you together
- Treat strong risk management as the routine that keeps you trading next month
Which Indicators Work Best for a Momentum Trading Strategy?

If you are wondering which indicator is best for momentum trading, no single tool wins alone. The strongest setups combine two or three indicators that confirm each other. The four most popular are the RSI, MACD, moving averages and ROC, all built into MetaTrader 4 and MetaTrader 5.
| Indicator | What it measures | Typical setting | Momentum signal |
| RSI | Speed and size of price changes | 14 periods | Above 50 bullish, below 50 bearish |
| MACD | Gap between two moving averages | 12, 26, 9 | Line crosses above signal |
| Moving averages | Underlying direction | 20 and 50 periods | Short crosses above long |
| Rate of Change | How fast price is moving | 10 periods | Rising and far from zero |
Using RSI to Gauge Momentum
The relative strength index (RSI) measures the speed and size of recent price changes on a 0 to 100 scale.
A simplified RSI example:
- RSI = 100 − [100 ÷ (1 + RS)], where RS = average gain ÷ average loss
- Average gain over 14 periods is 1.2%, average loss is 0.6%
- RS = 1.2 ÷ 0.6 = 2
- RSI = 100 − (100 ÷ 3) = 66.7
Momentum traders read the RSI against a few key levels:
- Above 70 is often called overbought
- Below 30 is often called oversold
- Above 50 points to bullish momentum, below 50 to bearish
Using MACD to Confirm Momentum
The moving average convergence divergence (MACD) compares two moving averages to show whether momentum is building or fading. It works best as confirmation.
Key MACD signals include:
- The MACD line crossing above the signal line, which is bullish
- The MACD line crossing below the signal line, which is bearish
- A widening histogram, which shows momentum accelerating
Many traders wait for the RSI and MACD to agree before acting. Two signals are harder to argue with than one.
Using Moving Averages and the Rate of Change Indicator
Moving averages smooth out noise and reveal direction. A popular signal is a moving average crossover:
- A short moving average (20 periods) crossing above a longer one (50 periods) signals strengthening upward momentum
- The reverse crossover signals weakening momentum
The rate of change (ROC) then shows how fast price is moving. The pairing is a tidy core for any plan:
- Moving averages show the direction of the move
- The ROC shows the speed behind it
Momentum Trading Strategy vs Other Strategies
A momentum trading strategy is one of several approaches. The table shows where it sits next to its main rivals.
| Strategy | Core idea | Buys | Typical hold |
| Momentum | Strong moves keep moving | Strength | Hours to weeks |
| Trend | A direction persists | Confirmed trends | Weeks to months |
| Mean reversion | Stretched prices snap back | Weakness | Days |
| Swing | Capture one price swing | Either | Days to weeks |
Momentum Trading vs Trend Trading
The two are close, but they hunt for different things:
- Trend trading rides a direction patiently and tolerates slow grinds
- Momentum trading prioritises the fastest movers and may exit sooner
Momentum Trading vs Mean Reversion
Mean reversion is the opposite philosophy. The two approaches sit on different sides of the same chart:
- Mean reversion traders bet stretched prices will snap back to an average, so they buy weakness
- Momentum traders bet strong moves will continue, so they buy strength
Both can work, but rarely at the same time on the same market.
Find out more about mean reversion strategy as it helps you trade to the return to average price.
Is Momentum the Same as Swing Trading?
Not quite. They overlap, but they describe different things:
- Swing trading describes a holding period of days to weeks
- Momentum describes the type of move, not how long you hold it
You can swing trade with momentum, or use it to day trade and position trade too.
Does a Momentum Trading Strategy Work, and What are the Risks?
A fair question is whether is momentum trading a good strategy over the long run. The research is encouraging, not a promise.
- Academic studies found that momentum has paid off for decades and across global markets, with winners-minus-losers strategies earning around 6% to 12% a year before costs, though returns fall after fees and can swing hard during sudden reversals.
- The effect showed up across many markets, not just one.
- Past performance does not guarantee future results, and CFD trading carries a high risk of loss.
The Advantages of Momentum Trading
Momentum trading appeals to many traders for good reasons:
- Clear, rules-based signals that are easy to test
- It works across forex, stocks, indices, commodities and crypto
- Strong moves can offer attractive risk-to-reward ratios
- It suits both short and longer timeframes
The Drawbacks and Common Pitfalls
No strategy is flawless. The main drawbacks include:
- Sharp reversals can hand back gains quickly
- False signals and whipsaws are common in choppy, sideways markets
- Chasing a move too late often means buying near the top
- Higher trading frequency can raise costs
How to Manage Risk and Avoid False Signals
Good risk management keeps a momentum trader in the trade. A few habits help:
- Always use a stop-loss, and set it before you enter
- Wait for two indicators to agree before acting
- Avoid trading momentum in flat, rangebound markets
- Risk only 1% to 2% of your account per trade
- Bank partial profits as a move extends
Where can you Apply a Momentum Trading Strategy?
One strength of a momentum trading strategy is its flexibility. The same idea works across asset classes, which is why multi-asset platforms such as MetaTrader 4 and MetaTrader 5 at VT Markets are popular with momentum traders.
| Market | Main momentum driver | Watch out for |
| Forex | Rate decisions and economic data | News spikes and reversals |
| Stocks and indices | Earnings and sector rotation | Gaps over weekends |
| Commodities | Supply shocks and macro news | Sudden volatility |
| Crypto | Sentiment and large fund flows | Very fast, large swings |
Momentum Trading in Forex
Currencies trend well around rate decisions and economic data. Forex suits momentum because it offers:
- Deep liquidity on major pairs such as EUR/USD and GBP/USD
- Tight spreads that keep trading costs low
- Round-the-clock trading across global sessions
Momentum Trading in Stocks and Indices
Shares and indices offer some of the cleanest momentum signals:
- Individual shares can move hard around earnings releases
- Indices such as the S&P 500 or FTSE 100 smooth out single-stock noise
- Sector rotation creates rolling momentum from one group to the next
Momentum Trading in Commodities and Crypto
Commodities and crypto move fast, with more risk:
- Gold and oil react strongly to supply shocks and macro news
- Cryptocurrencies are famously momentum-driven, with large swings
- Both demand tighter stops and smaller positions
Choosing the Right Timeframe for your Momentum Trading Strategy
Your timeframe should match your schedule and temperament. The table is a useful starting point.
| Trader type | Chart timeframe | Typical hold | Best suited to |
| Scalper | 1 to 5 minutes | Minutes | Full-time, fast reactions |
| Day trader | 15 to 60 minutes | Hours | Active, screen-based traders |
| Swing trader | 4-hour to daily | Days to weeks | Part-time traders |
| Position trader | Daily to weekly | Weeks to months | Patient, hands-off styles |
There is no single answer to what is the best momentum strategy. It’s because the right timeframe and indicator mix depend on you. Beginners often do best on the daily chart, where signals are clearer and the pace is calmer.
Here is a complete momentum trading strategy example to tie it together:
- Market: EUR/USD on the daily chart
- Entry: price breaks above its 20-day high, RSI above 50, MACD line above signal
- Stop-loss: just below the recent swing low
- Exit: RSI closes back below 50, or a trailing stop is hit
- Risk: 1% of account per trade
Backtest this rules-based plan on MetaTrader 4 or MetaTrader 5 with VT Markets before committing real funds.
Frequently Asked Questions (FAQs)
Q1: What is a momentum trading strategy?
A momentum trading strategy buys assets rising strongly and sells or shorts those falling fast, aiming to ride the move while it lasts. It uses indicators such as the RSI, MACD and moving averages to measure the strength of a price move.
Q2: What is the best indicator for momentum trading?
There is no single best indicator. The RSI, MACD, moving averages and rate of change are the most widely used. Most traders combine two or three so the signals confirm one another, rather than relying on one tool alone.
Q3: What is the difference between momentum and trend trading?
Trend trading focuses on the direction of a move and holds for as long as it lasts. Momentum trading focuses on the strength and speed of a move, favouring the fastest movers and often exiting sooner when that speed fades.
Q4: Is momentum trading suitable for beginners?
It can be, if you start carefully. Beginners benefit from simple rules, the daily timeframe and strict risk management of 1% to 2% per trade. Practising on a demo account first helps build confidence before risking larger capital.
Q5: What timeframe is best for momentum trading?
The best timeframe depends on your schedule. Scalpers use minute charts, day traders use 15-minute to hourly charts, and swing traders use the daily chart. Beginners often find the daily chart easiest, as its signals are clearer and less noisy.
Place Your Momentum Trading Strategy into Action with VT Markets
Whether you are taking your first steps or refining an existing approach, a momentum trading strategy rewards clear rules, patience and disciplined risk management. The tools to find, confirm and manage strong moves are already built into the platforms you can access today.
With VT Markets, you can trade momentum across forex, indices, shares, and commodities on MetaTrader 4 and MetaTrader 5. Test your ideas on a demo account, then put your plan into motion when you are ready. Build your strategy, manage your risk, and trade assets in strong motion with confidence.








