





- A mean reversion strategy assumes price tends to return to its average after stretching too far in one direction.
- It performs best in ranging markets and weakens during strong, sustained trends.
- Core tools include the RSI, Bollinger Bands, the Z-score and Keltner Channels, all measuring how far price sits from the mean.
- Clear entry and exit rules, a defined deviation threshold, disciplined position sizing and backtesting separate a real plan from guesswork.
- VT Markets supports MetaTrader 4 and MetaTrader 5, where these indicators and automated rules can be applied directly.
Markets rarely move in a straight line. Prices stretch, snap back, and settle, again and again. A mean reversion strategy is built on exactly this behaviour: the idea that when an asset drifts unusually far from its average price, it tends to pull back towards it.
For CFD traders, this offers a structured way to spot stretched conditions and trade the return to the middle. This guide walks you through what a mean reversion strategy is, the indicators that power it, how to build and test one, and where it works best across forex, stocks and crypto.
What Is A Mean Reversion Strategy?

A mean reversion strategy is a method that treats extreme price moves as temporary. When price runs well above or below its typical level, the strategy positions for a move back towards that level. Rather than chasing a breakout, you are fading the stretch and waiting for balance to return.
It places itself within a broader family known as mean reversion trading, used across forex, indices, shares and commodities. The logic is simple to state but demanding to apply: identify the average, measure the distance from it, and act only when that distance becomes statistically unusual.
Mean Reversion Strategy Explained in Trading Terms
In trading terms, a mean reversion strategy assumes that price and its average are linked by an invisible elastic band. Stretch the band too far and tension pulls price back. That stretch tends to show up as:
- A sharp spike that leaves price far above a moving average
- A steep sell-off that pushes price well below recent norms
- An overbought or oversold reading on an oscillator
Your job is not to predict the exact turning point. It is to enter when the odds of a snap-back improve, then exit as price drifts back towards the average.
The Statistical Basis, Regression to the Mean
The concept draws on a statistical principle called regression to the mean. Put simply, extreme outcomes tend to be followed by more moderate ones. A run of unusually high readings is often followed by readings closer to the average, not because of any force pushing them back, but because extremes are rare by definition.
In markets, this appears as reversion to the mean after emotional overreactions. Fear and greed push price away from fair value, then calmer conditions bring it back. A worked example helps:
- Suppose EUR/USD has a 20-day average of 1.0850.
- Price spikes to 1.0980 on a single headline, then liquidity thins.
- A reversion approach treats 1.0980 as stretched and looks for a move back towards 1.0850.
What Counts as “The Mean” (Moving Average, VWAP, Equilibrium Price)
“The mean” is whatever average you choose to measure against. Common choices include:
- A moving average, such as a 20-period simple moving average (SMA), which smooths recent prices into a single line
- VWAP (volume-weighted average price), popular with intraday traders because it weights price by traded volume
- A longer-term equilibrium price or fair value estimate, used by swing and position traders
Each defines a different centre of gravity. The shorter the average, the more often price crosses it, and the more signals, and noise, you will see.
How and Why A Mean Reversion Strategy Works
A mean reversion strategy works because markets spend a large share of their time ranging rather than trending. With no strong catalyst, buyers and sellers push price back and forth around a rough centre, creating the very oscillations the strategy is designed to trade.
Why Prices drift back towards an Average
Prices drift back towards an average for practical reasons, not magic:
- Liquidity providers and market makers lean against stretched moves
- Short-term traders take profit after sharp moves, easing the pressure
- Overreactions to news fade once the initial shock passes
None of this guarantees a reversion. It simply explains why, in calm conditions, extreme prices often prove temporary.
The Conditions that Create Reversion
Two conditions make the approach more reliable:
- A ranging market (also called a range-bound market), where price oscillates between rough support and resistance rather than trending
- Overextension, where price has moved several standard deviations from its average in a short time
When both are present, the snap-back odds improve. When a strong trend takes hold, they collapse, which is why market selection matters as much as the signal itself.
When a Deviation is Signal versus Noise
Not every move away from the mean is a setup. The skill is separating a genuine deviation worth trading from ordinary noise. A few filters help:
- Require a minimum distance from the mean before acting, such as two standard deviations
- Confirm with a second tool, so one indicator is not making the decision alone
- Avoid signals that fire just before major news, where a real trend may begin
Treating every wobble as a signal is the fastest way to overtrade.
Indicators That Power A Mean Reversion Strategy
Indicators turn the idea of “too far from average” into a number you can act on. A mean reversion strategy usually combines one momentum oscillator with one volatility-based band.
RSI for Overbought and Oversold Conditions
The Relative Strength Index (RSI) measures the speed and size of recent price moves on a scale of 0 to 100. The standard 14-period reading flags:
- Overbought conditions above 70, a potential fade lower
- Oversold conditions below 30, a potential bounce higher
RSI does not tell you when to act on its own. In a strong trend it can stay overbought for a long time, so it works best as one input among several.
Bollinger Bands and Standard Deviation
Bollinger Bands plot a moving average with an upper and lower band set a number of standard deviations away, usually two. As roughly 95% of values in a normal distribution fall within two standard deviations, a touch of the outer band marks a statistically stretched move.
A classic reversion read:
- Price tags the lower band, then closes back inside: possible long
- Price tags the upper band, then closes back inside: possible short
Z-Score and the Distance from the Mean
The Z-score states exactly how many standard deviations price sits from its average. It is the cleanest single measure of stretch, and the formula is straightforward:
Z = (Current Price − Mean) ÷ Standard Deviation
A worked example:
- Mean (20-period): 1.2500
- Standard deviation: 0.0040
- Current price: 1.2580
- Z = (1.2580 − 1.2500) ÷ 0.0040 = +2.0
A Z-score of +2 says price is two standard deviations above its mean, a textbook overbought stretch. A reading of −2 is the oversold mirror image. A simple mean reversion strategy calculator can compute this Z-score automatically as new prices arrive, so you are not running the maths by hand on every candle.
Keltner Channel and ATR for volatility-adjusted bands
The Keltner Channel frames price with bands based on the Average True Range (ATR) rather than standard deviation. Since ATR measures real volatility, the channel widens in fast markets and narrows in quiet ones. Many traders pair the two:
- Bollinger Bands for the statistical stretch
- Keltner Channel for the volatility-adjusted context
When both bands agree that price is extended, the signal carries more weight.
Moving Average Distance and Reversion Bands
A final, lightweight method simply measures the percentage distance between price and a chosen moving average. When price sits a fixed percentage above or below the average, the deviation is flagged as a reversion candidate. It is less precise than a Z-score but easy to chart and quick to read.
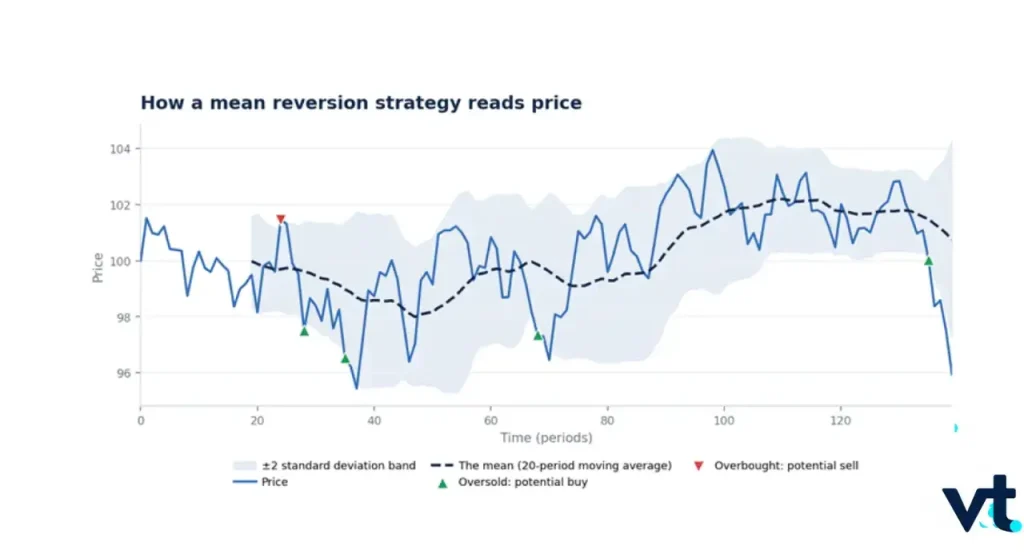
Note: Price oscillating around its 20-period mean, with stretches to the outer bands flagging potential reversion entries.
| Indicator | What it measures | Typical mean reversion signal |
| RSI (14) | Momentum on a 0–100 scale | Above 70 overbought, below 30 oversold |
| Bollinger Bands (20, 2) | Distance in standard deviations | Touch of the outer band, then close back inside |
| Z-score | Standard deviations from the mean | A reading of +2 or −2, or beyond |
| Keltner Channel | ATR-based volatility bands | Close outside the channel |
How To Build And Trade A Mean Reversion Strategy
Knowing how to use mean reversion strategy tools is only half the task. The other half is turning them into rules you can follow without hesitation. A workable plan has four parts: entry and exit rules, a deviation threshold, position sizing, and testing.
Defining Entry and Exit Rules
Clear rules remove guesswork. A simple template:
- Entry: price closes beyond the lower band and RSI is below 30 (for longs), with the mirror for shorts
- Exit (target): price returns to the moving average, the mean itself
- Exit (stop): price closes a set distance beyond the entry band
Notice the exit at the mean. A mean reversion strategy aims for the return to average, not a home run, so targets are usually modest and frequent.
Choosing the Lookback Period and Deviation Threshold
Two settings shape every signal:
- The lookback period, how many candles feed the average and the bands
- The deviation threshold, how far price must stretch before you act
Shorter lookbacks react faster but fire more false signals. A wider threshold, say 2.5 standard deviations instead of 2, trades less often but with cleaner setups. There is a genuine trade-off here, and the right balance depends on the instrument and timeframe.
Position Sizing and Stop Placement
As mean reversion entries lean against the current move, risk management is non-negotiable. Sound habits include:
- Risking a small, fixed share of capital per trade, often 1% to 2%
- Placing a stop-loss beyond the band, so a genuine breakout exits you quickly
- Sizing positions from the stop distance, not from a fixed lot size
A worked example on a $5,000 account:
- Risk per trade: 1% = $50
- Stop distance: 25 pips on EUR/USD
- Position size is then set so 25 pips of loss equals $50, capping the loss at plan
The point is simple: define the loss before the entry, every time.
Backtesting before Going Live
Before risking real capital, test the rules on historical data. Backtesting shows how the plan would have performed and exposes weak settings early. A practical sequence:
- Backtest the rules across at least a few years of data
- Forward-test on a demo account to confirm live behaviour
- Only then commit small, controlled size
On MetaTrader 4 and MetaTrader 5, the built-in Strategy Tester lets you backtest a coded mean reversion strategy candle by candle, and VT Markets supports both platforms for live and demo use.
Where A Mean Reversion Strategy Works Best
A mean reversion strategy is not universal. It thrives in some markets and conditions and struggles in others.
Mean Reversion in Forex
Forex suits mean reversion because many currency pairs spend long stretches range-bound rather than trending. Pairs from stable, closely linked economies often oscillate around a familiar level, and pairs trading between correlated currencies is a popular extension. It weakens, though, when a central bank shifts policy and a pair enters a strong directional run.
Mean Reversion in Stocks and Indices
In equities, mean reversion appears most often:
- In broad indices, which tend to be less jumpy than single shares
- Around clear support and resistance after an overreaction
- In statistical arbitrage setups that trade two related stocks against each other
Single stocks carry gap risk around earnings, so many traders prefer indices for cleaner reversion.
Mean Reversion in Cryptocurrency
Crypto is the hardest case. High volatility creates frequent, dramatic stretches from the mean, which can look like ideal setups. Nevertheless, the same volatility produces powerful trends that punish early entries. Mean reversion can work on crypto in clearly ranging phases, though tight risk control is essential.
Best Timeframes and Market Conditions
There is no single best timeframe. As a rough guide:
| Timeframe | Typical use | Notes |
| 5–15 minutes | Intraday reversion | More signals, more noise |
| 1–4 hours | Swing reversion | Cleaner ranges, fewer trades |
| Daily | Position reversion | Slow but higher quality |
In every case the same rule holds: favour ranging conditions, and step aside when a strong trend takes over.
A Mean Reversion Strategy Compared With Trend Following
The clearest way to understand mean reversion is to set it beside its opposite.
Mean Reversion versus Momentum and Trend Following
A mean reversion strategy trades against the current move, expecting a return to the average. Trend following and momentum strategies trade with the move, expecting it to continue.
| Feature | Mean reversion | Trend following |
| Core belief | Price returns to average | Price keeps moving |
| Best market | Ranging | Trending |
| Entry | Against the move | With the move |
| Typical profile | Higher win rate, smaller wins | Lower win rate, larger wins |
| Main risk | A trend that does not revert | A range that chops you up |
When to Favour One Approach over the Other
The choice comes down to market state:
- Favour mean reversion when price is oscillating in a defined range
- Favour trend following when price is making clear higher highs or lower lows
- Stand aside when conditions are unclear, rather than forcing a fit
Combining Both in a Single framework
Many experienced traders run both, switching by condition. A simple framework:
- Use a trend filter, such as a long moving average, to read the regime
- Apply mean reversion only when the filter shows a range
- Apply trend rules only when the filter shows a trend
This is where traders often ask what is the best mean reversion strategy, and the best one is matched to the market it is used in. A reversion plan that ignores a strong trend is not a strategy, it is hope.
Risks And Limits Of A Mean Reversion Strategy
No method profits in every condition, and a mean reversion strategy has clear weak points worth respecting.
When Mean Reversion Fails (strong trends, structural breaks)
The strategy fails when the average it relies on stops being meaningful:
- A strong trend keeps extending instead of reverting, so each “stretched” entry loses
- A structural break, such as a policy shift or a shock, resets fair value entirely
In both cases price does not come back, and trades placed against the move keep bleeding.
The Risk of Catching a Falling Knife
Entering against a sharp sell-off is often called catching a falling knife. Price looks oversold, you buy, and it keeps falling. This is the single most common way mean reversion accounts are damaged. A hard stop-loss beyond the band is what separates a controlled loss from a large one.
Whether a Mean Reversion Strategy is Profitable
Many traders ask, is mean reversion strategy profitable, before committing capital. The realistic answer:
- It can be profitable in ranging or oscillating markets, with disciplined risk control
- It tends to lose in strong, sustained trends
- Its strength comes from many small, high-probability wins, not occasional large ones
So a mean reversion strategy is profitable only when it is applied to the right conditions and paired with strict risk management. Skill in market selection matters as much as the indicators themselves.
Keen to know about trend reversal? Find out more about it here.
Frequently asked questions (FAQs)
What is a mean reversion strategy?
A mean reversion strategy is a trading method that assumes price tends to return to its average over time. Traders identify when price has stretched unusually far from that average, using tools such as moving averages, Bollinger Bands or the Z-score, then position for a move back towards the mean.
How does mean reversion work?
Mean reversion works on the idea that extreme price moves are usually temporary. When price moves well above or below a statistical average, the strategy treats the gap as a setup, entering against the move and exiting as price returns towards the mean. It performs best in ranging markets.
Which indicators are best for mean reversion?
The most widely used are the RSI, Bollinger Bands, the Z-score and Keltner Channels. RSI flags overbought and oversold momentum, Bollinger Bands and Keltner Channels frame volatility-adjusted boundaries, and the Z-score measures exactly how many standard deviations price sits from its average.
Is a mean reversion strategy profitable?
A mean reversion strategy can be profitable in ranging or oscillating markets, but no strategy profits in all conditions. It tends to underperform in strong trends, where price keeps extending rather than reverting, so risk controls, stop placement and market selection determine the outcome.
Does mean reversion work in forex?
Mean reversion can suit forex because many currency pairs spend long periods range-bound rather than trending. It is often applied to ranging pairs and to correlated pairs through pairs trading, though it weakens during strong directional moves driven by interest rate or policy shifts.
Set a Mean Reversion Strategy to Work
A mean reversion strategy rewards patience, clear rules and honest risk management more than any single indicator. Master the average, measure the stretch, and only act when the odds genuinely favour a return to the middle.
The next step is to test your rules in a live-grade environment. With VT Markets, you can backtest and trade a mean reversion strategy on MetaTrader 4 and MetaTrader 5, apply the RSI, Bollinger Bands and Keltner Channels covered here, and refine your setup on a demo account before going live.
Explore the VT Markets platforms guide to see how MT4 and MT5 can support your mean reversion strategy from first backtest to live trade.








