





Key Takeaways
- A dragonfly doji forms when the opening price, high, and closing prices sit at (or near) the top of the candle’s range, leaving a long lower shadow beneath and little to no upper shadow.
- The dragonfly doji pattern is generally read as a potential bullish reversal signal, particularly when it appears at the bottom of a downtrend — though it’s a reversal pattern, not a promise.
- A green dragonfly doji (where the close is marginally above the open) is often viewed as a slightly stronger bullish pattern than a red one, though both share the same underlying dragonfly doji chart pattern shape.
- The dragonfly doji vs the gravestone doji comes down to where the small body sits: at the top of the range for a gravestone and at the bottom of the range for a dragonfly.
- Waiting for a confirmation candlestick to appear after the dragonfly doji forms is one of the simplest ways to avoid acting on false signals.
- According to VT Markets’ own 2025 trading data, candles with pronounced shadows have become around 28% more common compared to 2023, a trend widely linked to greater volatility from algorithmic trading – relevant context for anyone studying dragonfly doji candlestick formations today.
What Does a Dragonfly Doji Candle Mean?
So, what does a dragonfly doji candle mean in simple terms? During a single trading session, sellers pushed the asset price down significantly, creating a long lower shadow, which suggests that sellers were able to push the price down before buyers recovered it by the close. But by the close, buyers had fought back so hard that the price ended up almost exactly where it opened — near the top of the session’s range.
This tug-of-war is why the dragonfly doji indicates something quite specific: the dragonfly doji candlestick pattern is a bullish candlestick pattern traders watch for a potential reversal because sellers tried to take control but ultimately failed to hold it. The small body sitting at the top of the candle, combined with little to no upper shadow, tells you that once buyers stepped in, there was barely any pushback on the way back up.
In candlestick terminology, the dragonfly doji is one of the clearer expressions of market sentiment shifting mid-session — the pattern signals indecision before the late-session bullish shift by the close. For a broader primer on how individual candles are built and read, VT Markets’ guide on candlestick trading explained is a useful companion piece to this one.
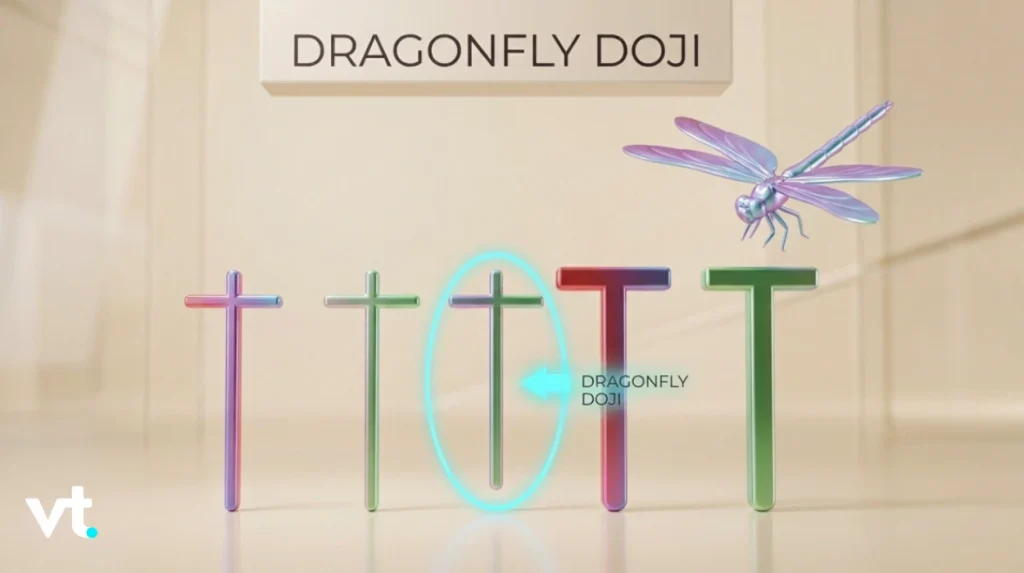
Anatomy of the Dragonfly Doji Candlestick
Understanding exactly how a dragonfly doji candlestick is built makes it much easier to spot on a live chart.
| Component | What It Looks Like in a Dragonfly Doji |
|---|---|
| Opening price | Sits near the top of the session’s range |
| Closing prices | Close almost exactly where the session opened |
| High | Barely above the open/close – creating little to no upper shadow |
| Low | Considerably below the open/close, forming the long lower shadow |
| Small body | Thin, sometimes just a horizontal line |
Traders usually identify this pattern formation on candlestick charts by its flat top and long lower shadow. Because the opening and closing prices are nearly identical and both sit near the candle’s high, the dragonfly doji candle takes on its distinctive “T” shape – a flat top with a wick trailing down like a dragonfly’s tail. This is different from a long-legged doji, which has extended shadows on both sides rather than just below.
Dragonfly Doji vs Gravestone Doji: What’s the Difference?
One of the most common comparisons traders search for is the dragonfly doji vs its counterpart, the gravestone doji. They’re essentially mirror images of one another.
| Feature | Dragonfly Doji | Gravestone Doji |
|---|---|---|
| Body position | Near the top of the range | Near the bottom of the range |
| Shadow | Long lower shadow, little upper shadow | Long upper wick, little lower shadow |
| Typical location | Bottom of a downtrend | Top of an upward trend |
| Common interpretation | Potential bullish reversal | Potential bearish reversal |
While a dragonfly doji appears after sellers are rejected and buyers close near the highs, a gravestone doji shows the opposite: its long upper shadow reflects buyers failing to hold higher prices before sellers drag it back down to the open, while the dragonfly can hint at a price reversal if confirmation follows. Both are considered doji candlestick patterns rooted in market indecision, but their positioning within a prevailing trend gives each a different leaning.
Is a Dragonfly Doji Bullish or Bearish?
This is where nuance matters. A dragonfly doji is technically a doji pattern, meaning it’s rooted in indecision rather than being inherently one-directional. That said, its shape does carry a lean.
Bullish Dragonfly Doji
When a dragonfly doji bullish setup occurs — typically when the pattern appears at the bottom of a downtrend or near a known support zone — traders often read it as a possible shift into a bullish trend after a price decline. In that context, the candle can reflect strong buying pressure once buyers regain control by the close. If the bullish dragonfly rises further on the next candle, many traders take this as reasonable evidence that buyers regained control of the market trend.
A green dragonfly doji, where the close finishes fractionally above the open, is sometimes viewed as marginally more encouraging than a red one, since it implies the tiniest edge for buyers even within an otherwise flat session.
Bearish Dragonfly Doji
Context can flip the read entirely. A bearish dragonfly — the same shape, but appearing after a strong uptrend or right at overhead resistance — can actually hint at exhaustion rather than a fresh bullish momentum shift. In that setting, the long lower shadow might simply reflect a brief dip-buying attempt within a market that’s already running out of steam, rather than the start of a genuine trend reversal.
This is precisely why the pattern is best read in combination with technical indicators such as the relative strength index, rather than judged on shape alone.
Dragonfly Doji vs Other Doji Patterns
The dragonfly doji is just one member of a broader doji family, and understanding such a pattern in context helps avoid confusing it with its relatives.
- Long-legged doji – has extended shadows on both sides, reflecting indecision without a clear directional lean.
- Gravestone doji – the bearish-leaning mirror image, discussed above.
- Four-price doji – an extremely rare, flat-line candle with virtually no shadows at all, usually seen in very thin trading.
- Doji star – a two-candle setup where a doji (dragonfly or otherwise) gaps away from the prior candle’s body.
Unlike Rising Three Methods or Mat Hold, it is not usually treated as a continuation pattern. For a wider look at how these doji candlestick variations sit alongside other formations like the hammer and shooting star, see VT Markets’ technical analysis basics guide.
How to Trade a Dragonfly Doji Pattern
A dragonfly doji candle pattern works best as one ingredient in a wider trading strategy – not a standalone signal to act on the moment the pattern forms.
Step 1: Confirm the Trend
Before anything else, establish the broader market context. Is price in a clear downward trend, or has it already been range-bound for a while? A dragonfly doji pattern carries more weight after a defined decline than in the middle of sideways chop.
Step 2: Wait for the Confirmation Candlestick
Because a single doji reflects market indecision, it’s sensible to wait until a confirmation candlestick appears — especially when the pattern forms after a long bearish candle, ideally a solid bullish candle that closes above the dragonfly’s high — before treating it as a genuine potential trend reversal. This single habit does more to filter out false signals than almost anything else in this guide.
Step 3: Manage Risk and Set Price Targets
Even a textbook dragonfly doji chart pattern can fail. Define your stop-loss below the candle’s low, and set sensible price targets based on the next area of resistance or a fixed risk-to-reward ratio, rather than assuming the reversal will run indefinitely. VT Markets’ guide to price action trading strategies for CFD traders covers this kind of confirmation-based approach in more depth.
2026 Market Data on Dragonfly Doji Reliability
Candlestick-based trading decisions remain firmly mainstream in 2026. VT Markets’ own market analysis has found that pairing candlestick reading with broader technical analysis tools lifts overall trading success rates by roughly 34% compared to relying on either approach alone — a helpful reminder that a dragonfly doji rarely works well in isolation.
Elsewhere, volatility research from 2025 pointed to a roughly 34% rise in long-legged doji formations across cryptocurrency markets compared with traditional forex markets, a reminder that different doji candlestick patterns, including the dragonfly, can appear with varying frequency depending on the asset class and prevailing volatility conditions. Meanwhile, 2026 figures put the number of active retail brokerage accounts worldwide at over 300 million, according to global retail investing research—meaning candlestick literacy, including recognising a dragonfly doji, is now more widely relevant than ever.
Read more: What does a doji candle mean?
A Few Cautions to Keep in Mind
As useful as the dragonfly doji can be, a handful of precautions are worth bearing in mind before building a trading strategy around it:
- A single dragonfly candle is a reversal pattern candidate, not a certainty, so traders should wait for confirmation rather than assume a turn.
- Thin liquidity, public holidays, or major news events can produce false signals, distorting what would otherwise be a clean dragonfly doji chart pattern.
- Leveraged CFD trading carries capital risk, and no candlestick pattern, however textbook, guarantees a particular outcome.
- It’s generally sensible to pair a dragonfly doji with other technical indicators and clear risk management, such as stop-loss orders, rather than trading the shape alone.
Start Online CFD Trading with VT Markets Today
If you are ready to put your understanding of the dragonfly doji to work in live markets, VT Markets provides access to tools and platforms to help you get started. Trade on powerful platforms like MetaTrader 4 (MT4) and MetaTrader 5 (MT5), designed for speed, reliability, and advanced trading features — exactly what you need when a dragonfly doji appears and financial markets move fast.
New to trading? Practise risk-free with a VT Markets demo account before committing to a live account — ideal for simulating reactions to candlestick pattern formations like the dragonfly doji across currency pairs, indices, and commodities without financial risk.
Open your live account with VT Markets today and access secure, transparent, and competitive CFD trading across some of the world’s most popular markets.
Frequently Asked Questions About the Dragonfly Doji
1. What does a dragonfly doji candle mean?
A dragonfly doji candle means sellers pushed price down significantly during the trading session, but buyers regained enough control to close near the open—leaving a long lower shadow and little to no upper shadow.
2. Is a dragonfly doji bullish or bearish?
On its own, it’s a doji pattern rooted in market indecision. However, when a dragonfly doji appears at the bottom of a downtrend, it’s typically read as a potential bullish reversal signal, especially once a confirmation candlestick follows.
3. What’s the difference between a dragonfly doji and a gravestone doji?
The dragonfly doji vs gravestone doji distinction comes down to body placement: a dragonfly’s body sits near the top of its range with a long lower shadow below, while a gravestone’s body sits near the bottom with a long upper wick above.
4. Should I trade a dragonfly doji pattern on its own?
It’s not advisable. A dragonfly doji pattern works best alongside other technical indicators, clear support or resistance context, and a confirmation candlestick, rather than as a standalone basis for trading decisions.








