


Key Points
- Nasdaq pushed to fresh record highs as AI-linked earnings kept risk appetite alive.
- The USD strengthened as resilient US data reduced confidence in near-term Fed cuts.
- Gold started May firm but weakened sharply as yields and the dollar moved higher.
- Oil stayed volatile as US-Iran negotiations kept shifting the supply-risk premium.
- Bitcoin lost momentum after its early-May rally and moved back into a corrective phase.
Market Recap of May
May kept the market’s risk-on tone alive, but leadership narrowed again. US equities remained the strongest area, with the Nasdaq and S&P 500 pushing to record highs as investors continued to back AI, semiconductors, cloud infrastructure, and mega-cap technology earnings. The S&P 500 and Nasdaq hit record closing highs late in the month, helped by AI optimism and hopes for an extended US-Iran ceasefire.
The macro backdrop was less clean. Stronger US data and persistent inflation pressure pushed markets to reconsider how quickly the Fed can cut rates. That supported the USD and weighed on gold, silver, and crypto in the second half of the month. Inflation worries hit Wall Street mid-month, while investors continued to watch headline inflation more closely because energy remained volatile.
Geopolitics stayed central. The long-awaited meeting between Xi Jinping and Donald Trump in Beijing helped improve the tone around US-China relations, though the outcome was more stability than breakthrough. President Trump left Beijing with warm words but few major wins, while China later signalled preliminary tariff cuts and progress on agricultural market access.
Oil remained the clearest geopolitical pressure point. US-Iran talks created sharp two-way price action, with traders reacting to every sign of progress or stalemate. Bitcoin also had a mixed month, rising early with broader risk assets before fading as the stronger USD and higher yields tightened financial conditions.
Dollar Strength Drives Major Currencies
Forex markets in May were driven by renewed USD strength.
The dollar gained as US economic data stayed resilient and traders reassessed the timing of Fed cuts. Stronger employment figures, firm spending, and sticky inflation kept Treasury yields supported during parts of the month. That made the USD more attractive against currencies where central banks appear closer to easing.
USDCAD captured this shift clearly. The 4-hour chart shows a steady climb through May, with price holding above its moving average and repeatedly building higher highs. CAD struggled as broader USD momentum outweighed any support from energy volatility.
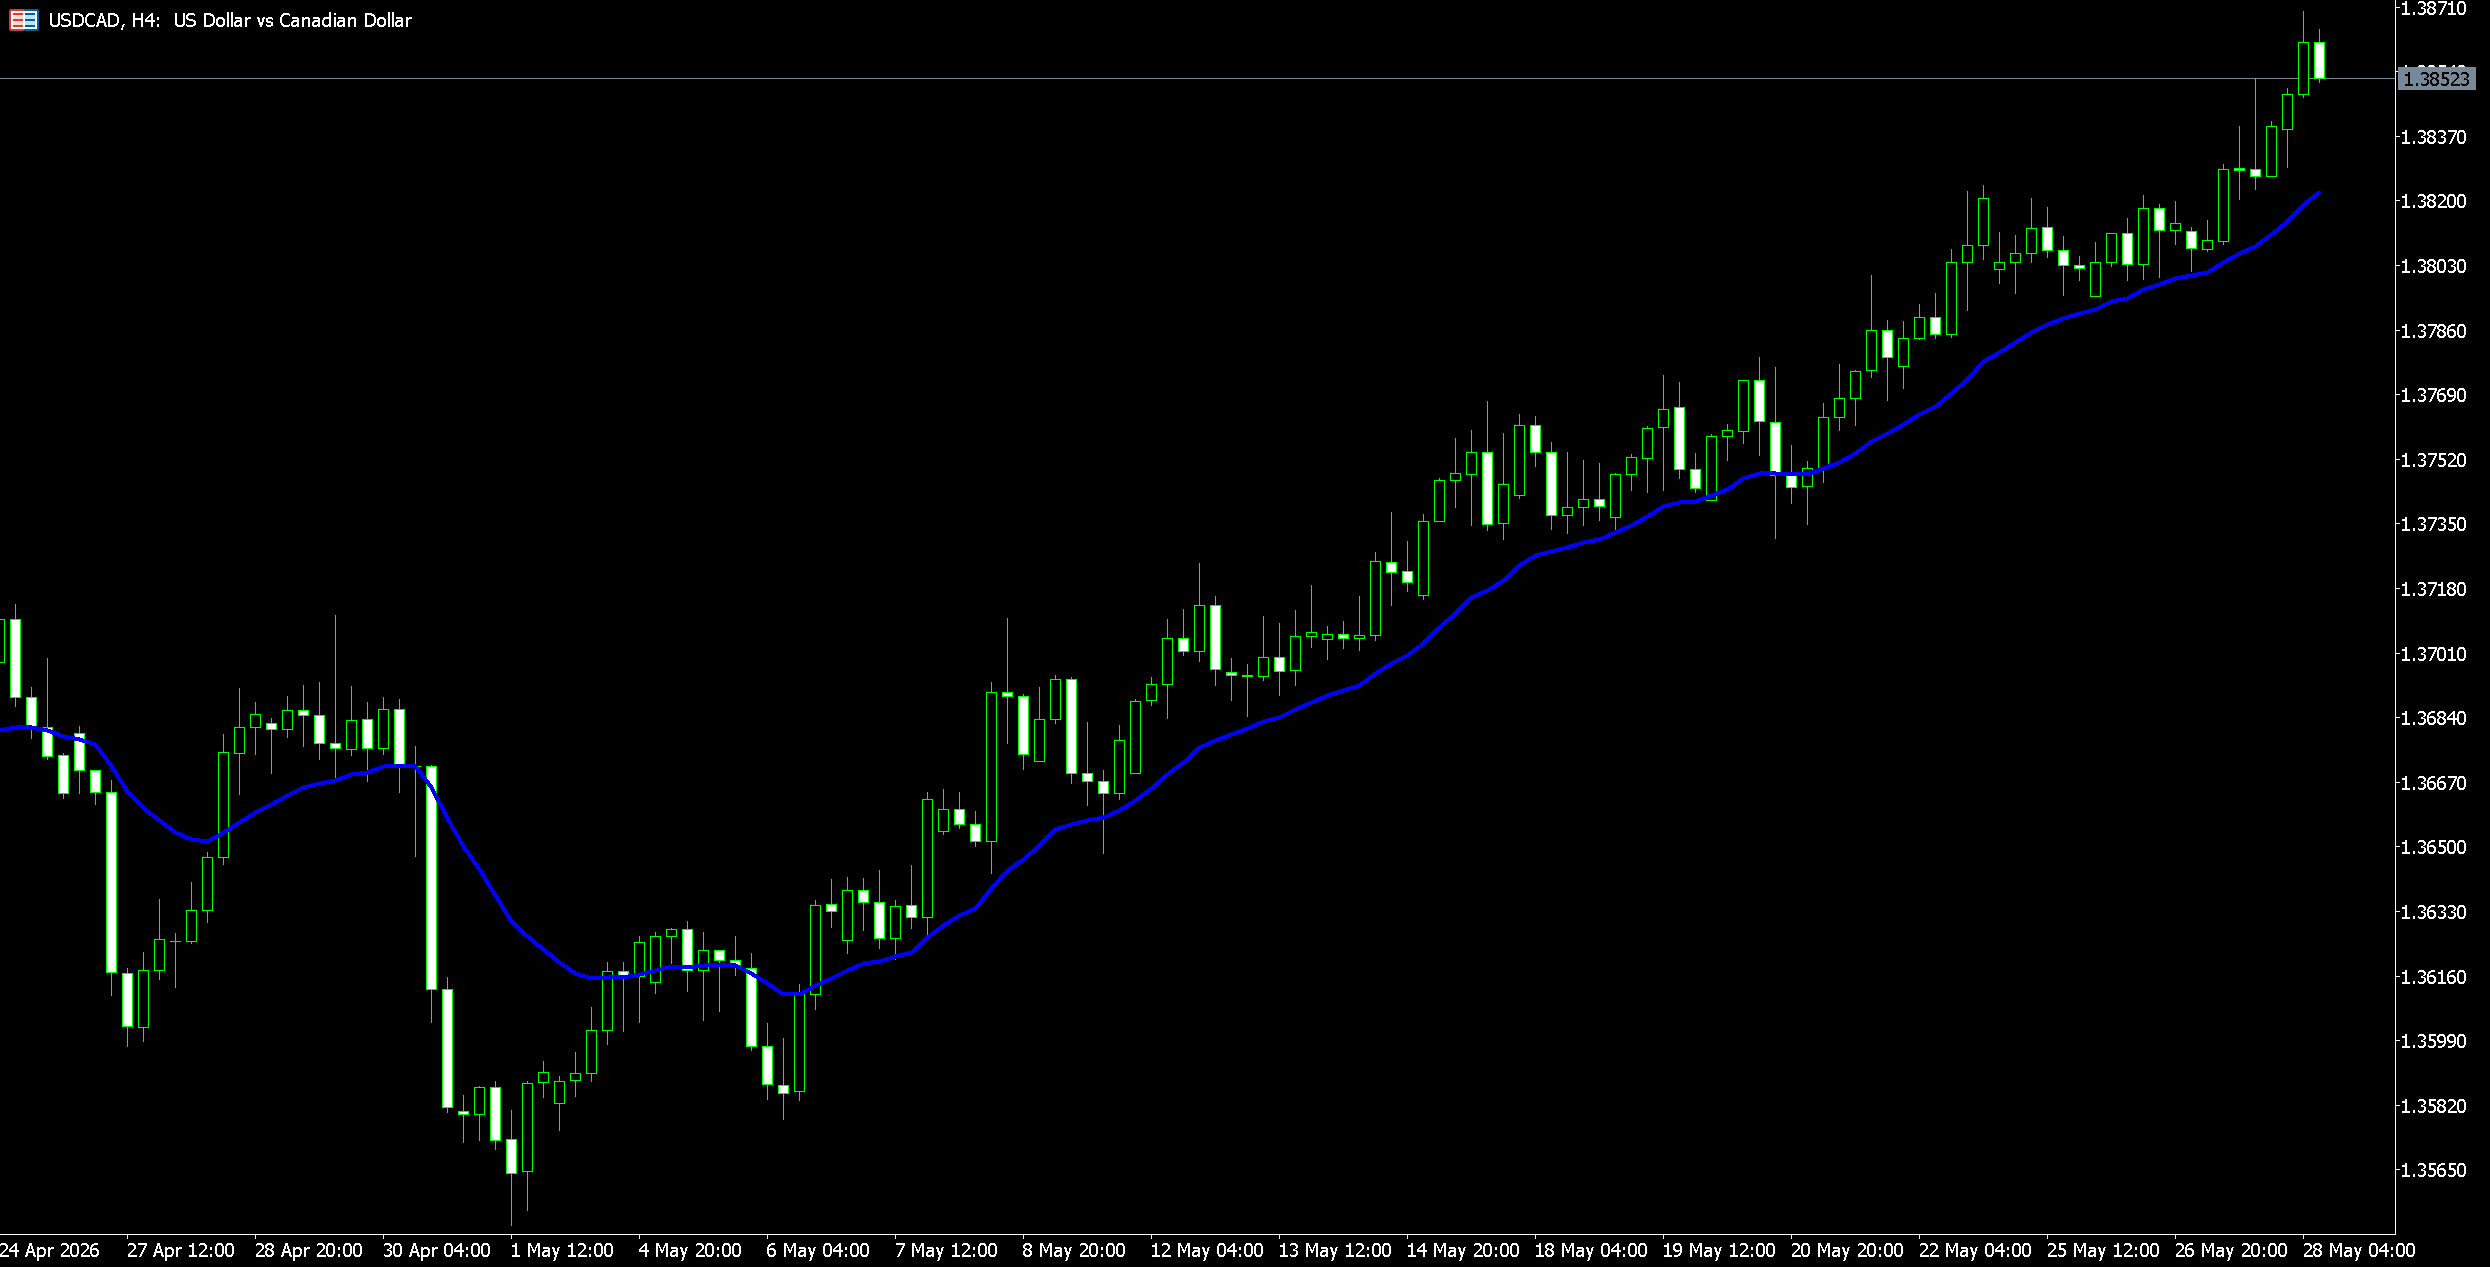
Fig. 1: 4-Hour USDCAD Chart Showing Sustained USD Strength Against CAD Through May
The trend remains constructive while price holds above the moving average. A pullback toward trend support would test whether USD strength is still broad enough to continue into June.
Watch whether US data keeps beating expectations. If it does, the dollar may stay firm even if risk appetite remains positive. A break below that line would suggest USD momentum is cooling.
The euro also came under pressure as markets continued to price the European Central Bank closer to easing than the Fed. JPY remained weak as the Bank of Japan stayed cautious despite currency volatility. Sterling proved more resilient at times, helped by better UK data, but broader USD strength limited upside.
Expectations on Popular Metals
Gold and silver started May with a firmer tone, but the rally faded as the month developed.
Gold initially benefited from softer inflation signals, geopolitical uncertainty, and expectations that the Fed could still cut rates later this year. Silver also found support from its industrial link to manufacturing and AI-related demand. That early strength did not last.
By the second half of May, stronger US data, higher Treasury yields, and renewed USD strength took control. Gold broke lower on the 4-hour chart and moved decisively below its moving average, with price sliding toward the $4,386 area by month end. This shows a clear loss of momentum after the market failed to hold earlier gains.
Silver was more volatile than gold because it also tracks industrial demand expectations. Even so, both metals remain supported by longer-term themes such as central bank diversification, geopolitical uncertainty, and the view that global rates may eventually fall.
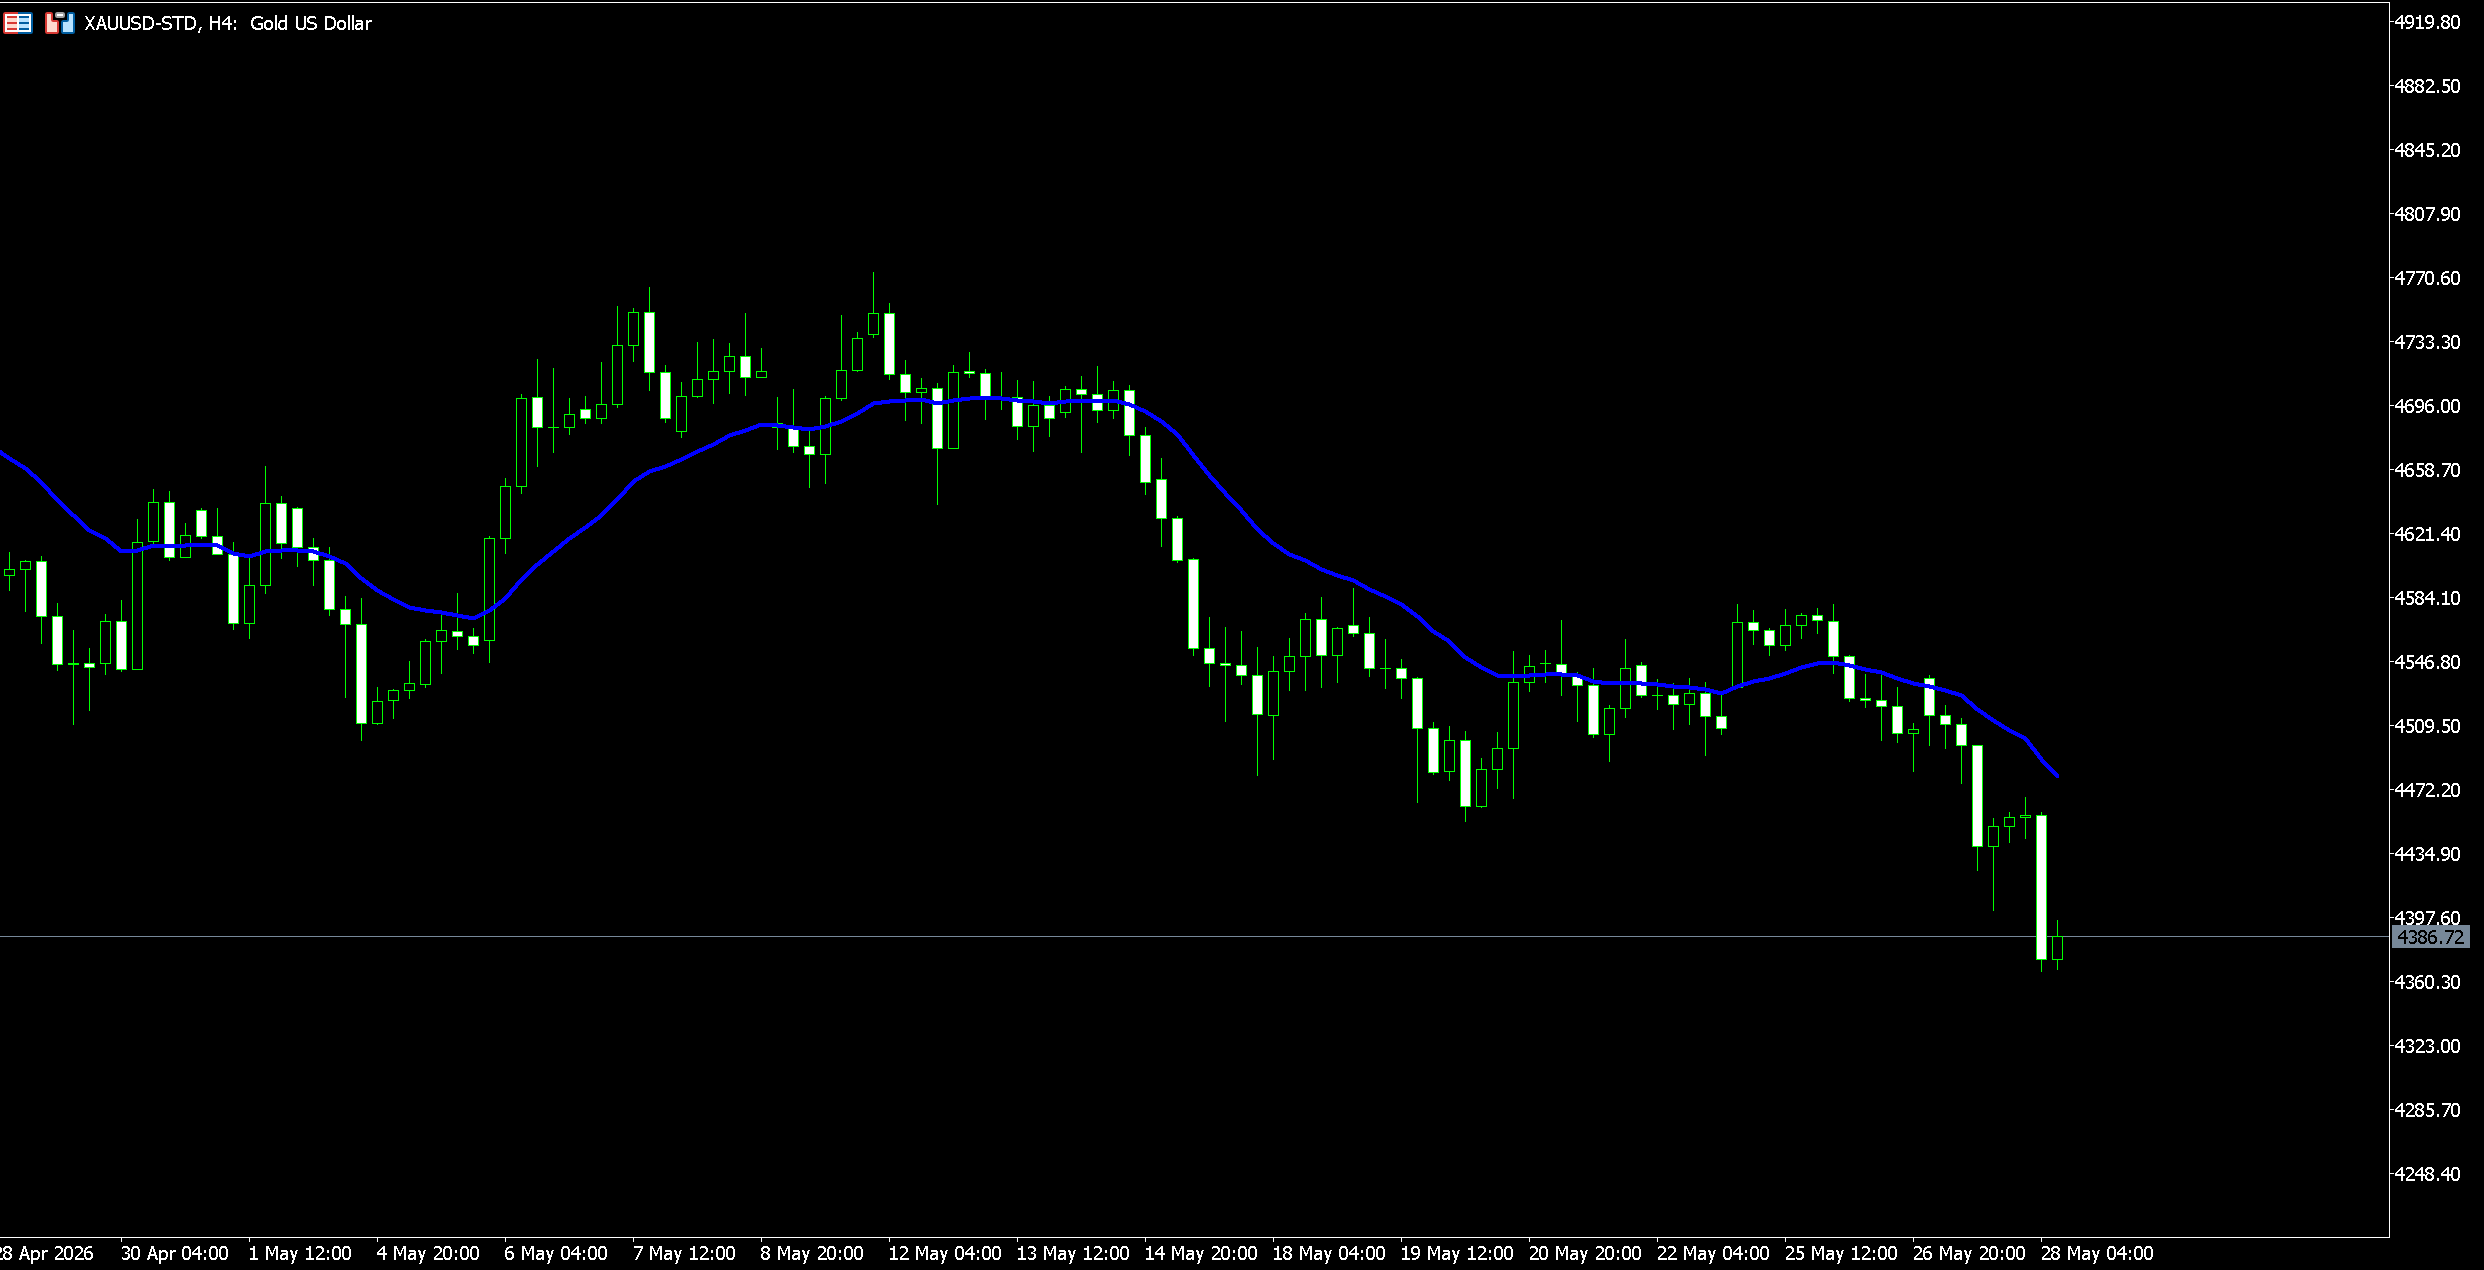
Fig. 2: 4-Hour Gold Chart Showing Early Strength Giving Way To A Weaker Month-End Tone
Gold has shifted from sideways consolidation into downside pressure. A recovery back above the moving average would ease the bearish tone, while failure to reclaim it keeps sellers in control.
Watch whether gold can stabilise after the late-May breakdown. If the USD stays firm, rebounds may struggle to hold.
Oil Still Part of Conflict
Oil remained volatile and headline-driven throughout May.
Crude prices moved inside the wider range that has been in place since the start of the conflict. The daily chart shows price repeatedly rejecting both the upper and lower parts of that range, with no clean directional break. This reflects a market caught between two opposing forces: the risk of supply disruption and the possibility of a diplomatic deal that could increase Iranian exports.
US-Iran talks remained the main catalyst. Oil fell more than 8% in one week late in May as markets responded to reports of a potential US-Iran ceasefire extension and possible easing of shipping restrictions through the Strait of Hormuz. Brent also fell from the prior week’s high near $109.47 to as low as $87.11 before stabilising.
The risk has not disappeared. The US imposed fresh sanctions on Iran’s military-linked oil trade on May 28, targeting vessels and entities tied to Iranian crude and petroleum exports. That shows diplomacy and pressure are moving together, which keeps the market sensitive to sudden reversals.
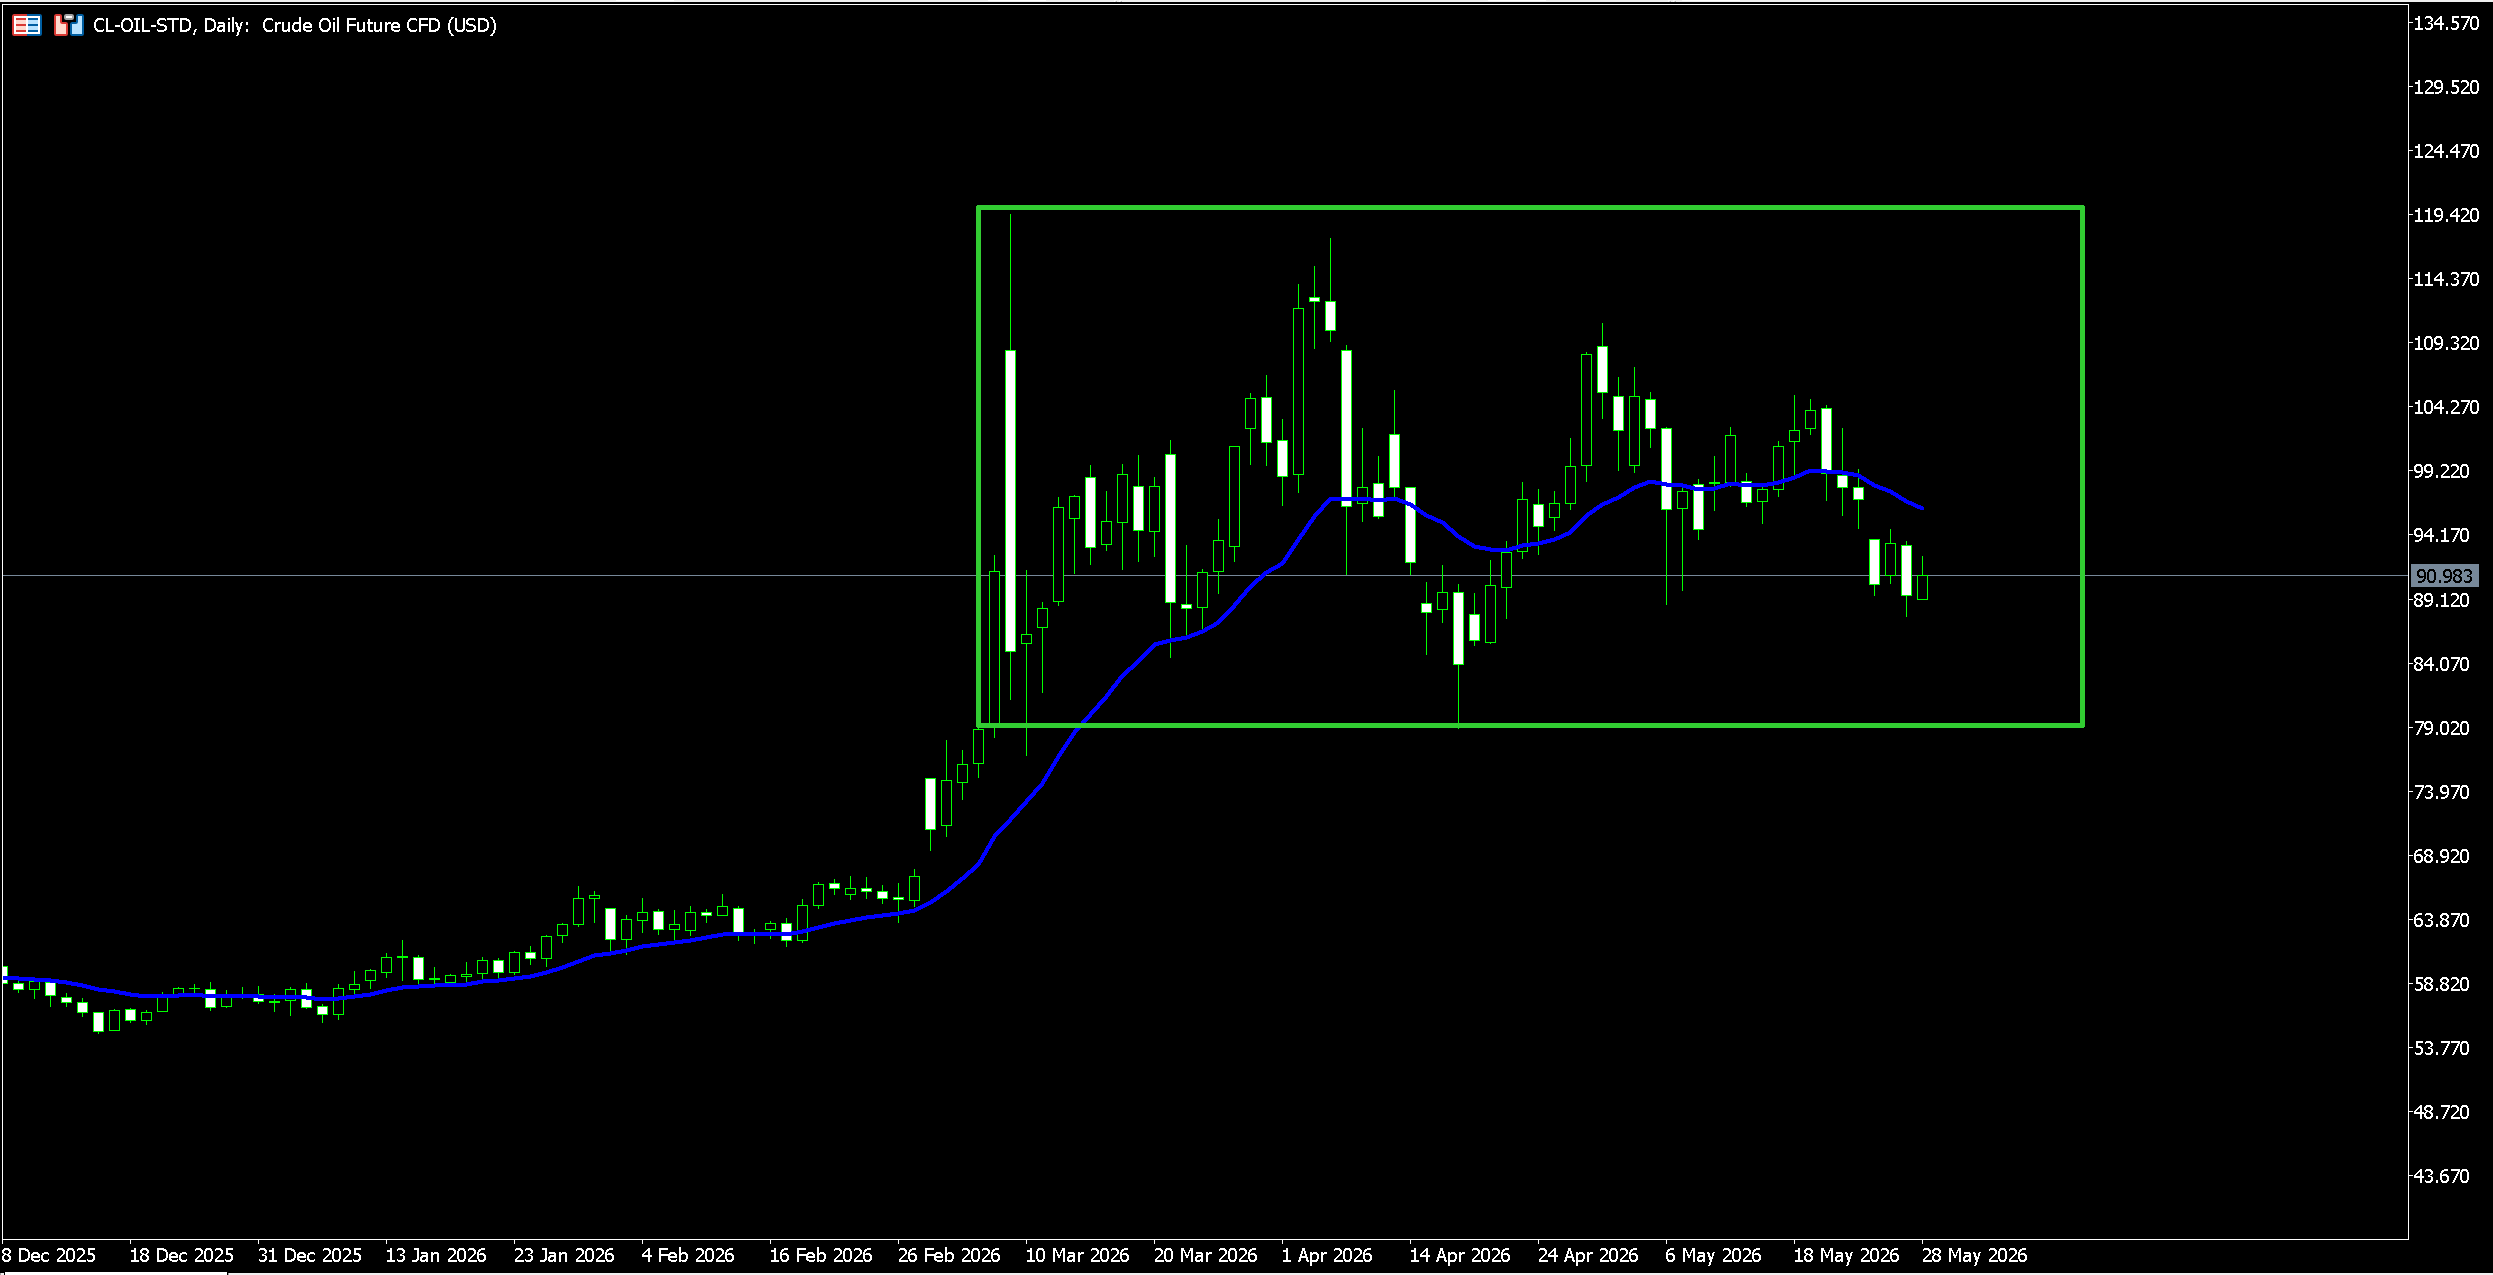
Fig. 3: Daily Oil Chart Showing Price Remaining Inside The Wider Conflict Range
Oil remains rangebound despite heavy headline volatility. A break below the range would suggest diplomatic progress is easing the risk premium. A break higher would point to renewed supply fears.
Watch whether talks produce a confirmed deal. Until then, crude may remain one of the most reactive markets heading into June.
Indices Reflect Earnings Beats
Equities remained the strongest major asset class in May.
The Nasdaq led again, supported by AI optimism, semiconductor demand, and strong corporate earnings from major technology firms. The 4-hour chart shows price breaking above the late-April support area, extending sharply higher, and reaching new record highs before a mild pullback when investor sentiment sways stock prices near the month-end.
AMD surged almost 19% after forecasting quarterly revenue above expectations, driven by strong demand for data centre chips. That helped lift chipmakers and other AI-related stocks. Later in the month, record closes in the S&P 500 and Nasdaq were supported by optimism around AI and signs of diplomatic progress in the Middle East.
The rally outside technology was more mixed. Commodity-linked sectors faced greater volatility because of oil swings, while European and Asian markets generally followed Wall Street but with smaller gains. US equity leadership remained clear, but it also looked increasingly dependent on mega-cap tech.
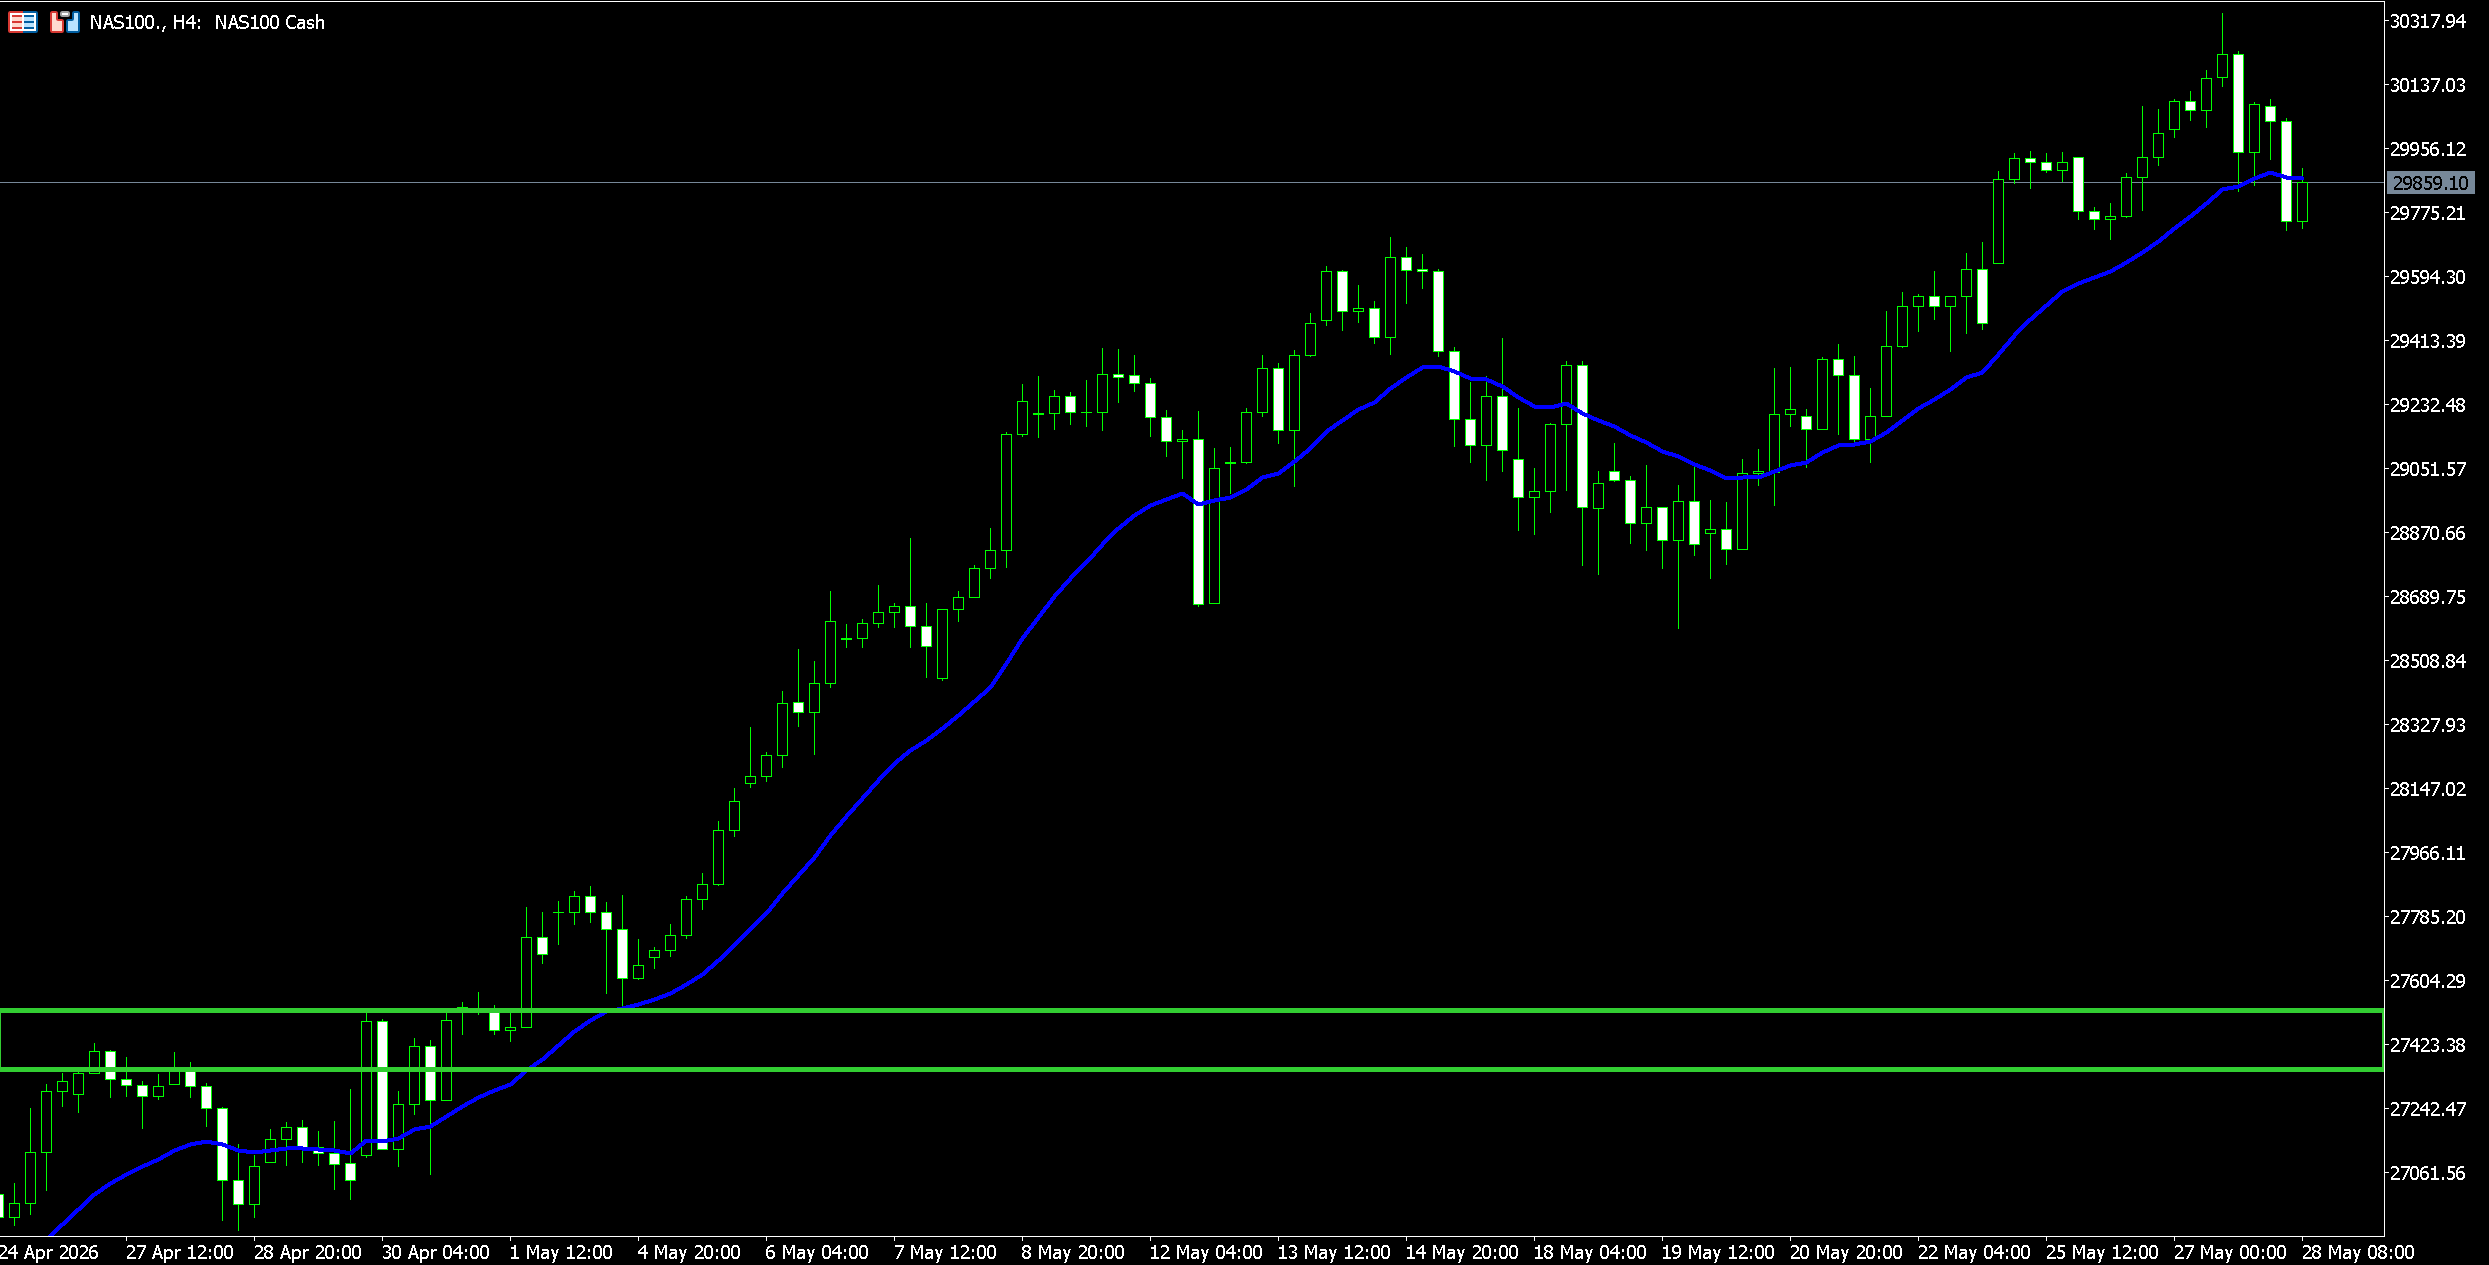
Fig. 4: 4-Hour Nasdaq Chart Showing Price Reaching Fresh Record Highs In May
The broader uptrend remains intact while price holds above the rising moving average and prior breakout zones. A deeper pullback would test whether buyers still have conviction after the strong May run.
Watch whether AI earnings momentum can continue. If results stay strong, Nasdaq may remain the market’s main leadership trade into June. A deeper pullback would test whether AI-led demand is still strong enough to defend the trend.
Crypto Corrects
Bitcoin had a mixed May.
The month started with stronger momentum as risk appetite improved and institutional interest remained supportive. However, Bitcoin lost strength in the second half of the month as the USD recovered, yields rose, and traders took profit after the early rally.
The daily chart shows Bitcoin still above the lows from February and March, but the latest candles point to a clear corrective phase. Price has slipped below its moving average and is testing the lower part of the recent recovery structure. That does not yet confirm a broader bearish trend, but it does show momentum has weakened.
The macro link remains important. Earlier in May, crypto trading momentum faded, with tighter financial conditions (CLARITY Act) and macro uncertainty weighing on risk appetite. That theme returned late in May as stronger US data reduced expectations for near-term Fed easing.
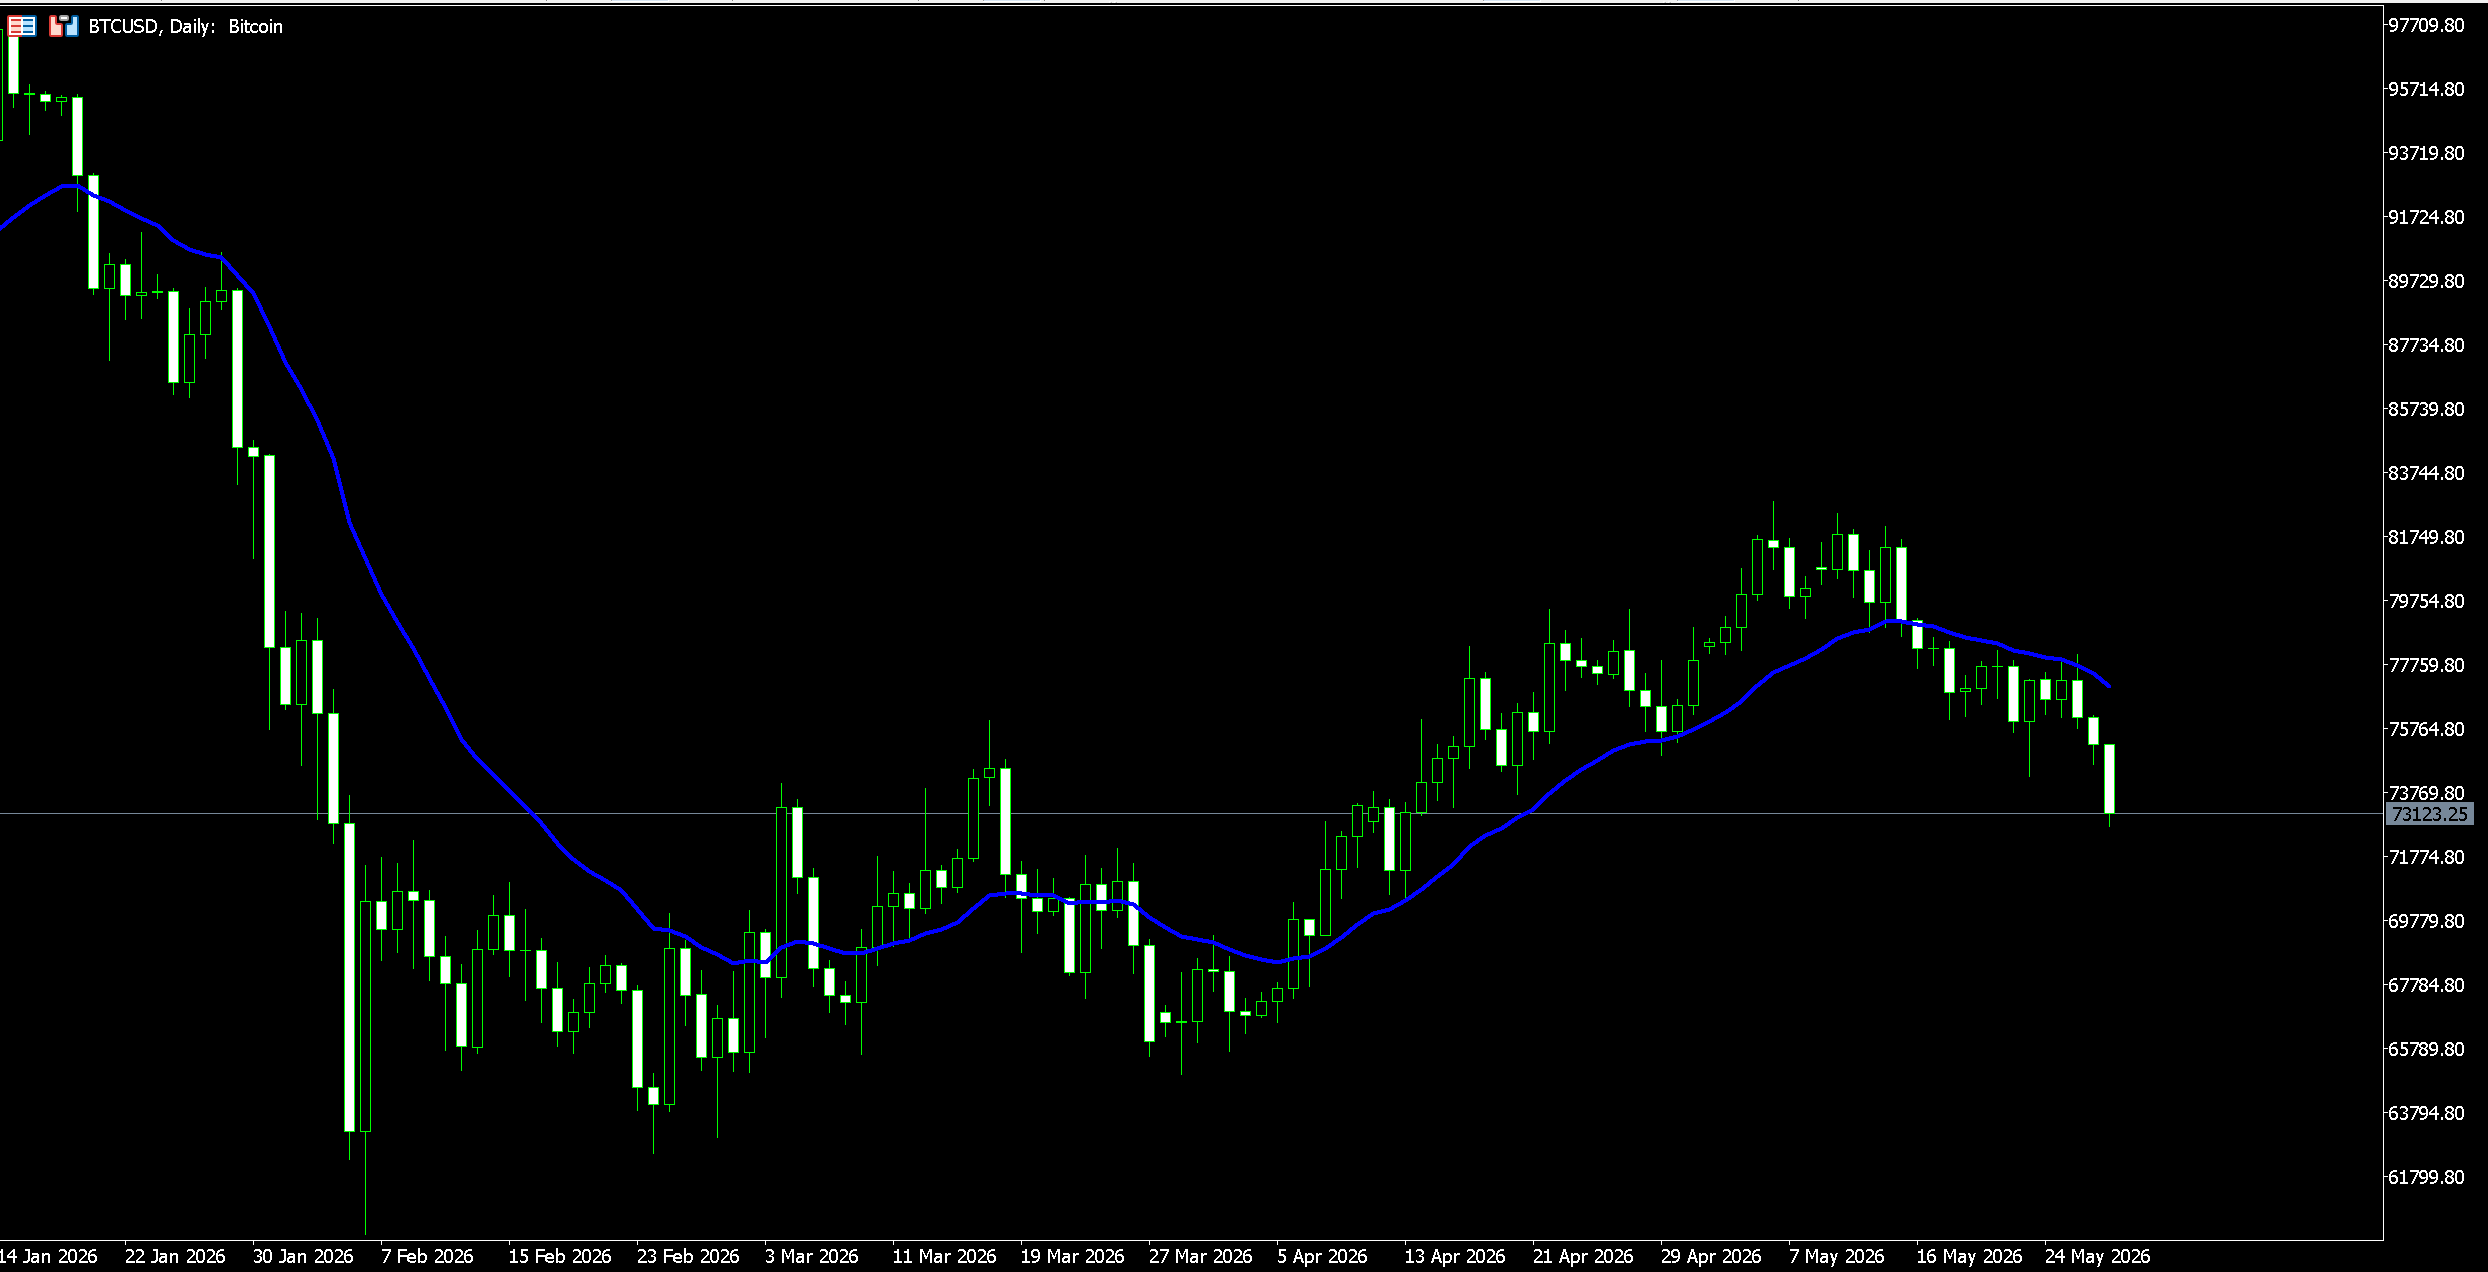
Fig. 5: Daily Bitcoin Chart Showing Late-May Weakness Within A Broader Consolidation Phase
Bitcoin remains in a corrective phase. A recovery above the moving average would improve the tone, while further downside could bring the broader consolidation floor back into focus.
Watch whether Bitcoin can reclaim momentum quickly. If the USD stays firm and yields remain elevated, crypto may continue to lag equities.
Early Signals to Watch in June 2026
June opens with markets still split between strong equity momentum and a more cautious macro backdrop.
- The Fed. Strong US data and sticky inflation have made rate-cut expectations less certain. If incoming inflation, jobs, and consumer spending figures remain firm, markets may keep pricing a higher-for-longer path. That would support the USD but could weigh on gold, crypto, and rate-sensitive equity segments.
- Oil. US-Iran negotiations remain the key driver for crude. A confirmed ceasefire extension and easier shipping through the Strait of Hormuz could push oil lower and reduce inflation pressure. A breakdown in talks or renewed sanctions pressure could quickly rebuild the risk premium.
- Equity leadership. Nasdaq has carried the market higher, but the rally now depends on whether AI-linked earnings can keep justifying elevated valuations. A healthy pullback would not damage the trend, but a sharper reversal in mega-cap technology could drag the broader index complex lower.
- US-China relations. The Xi-Trump meeting improved the tone, but markets will now look for action behind the headlines. Trade, technology access, agriculture, and supply-chain policy remain areas where optimism can fade quickly if follow-through disappoints.
The cautious forecast for June is a more selective market. US equities can stay supported if earnings remain strong, but USD strength, oil volatility, and slower rate-cut expectations may keep gold, crypto, and some non-US markets under pressure.
Still new to trading? Join our upcoming webinar and learn more about candlestick patterns that no one tells you about. Click the banner below!

Frequently Asked Questions
Why Did The USD Strengthen In May?
The USD strengthened because US data remained resilient, inflation stayed sticky, and markets reduced confidence in near-term Fed rate cuts.
Why Did Gold Weaken Late In May?
Gold weakened as US yields rose and the dollar strengthened. That raised the opportunity cost of holding non-yielding assets.
Why Did Oil Stay Volatile?
Oil stayed volatile because US-Iran talks created mixed signals around supply. A deal could increase exports, while failed talks could rebuild disruption risk.
Why Did Nasdaq Outperform?
Nasdaq outperformed because investors continued to favour AI, semiconductors, cloud infrastructure, and mega-cap technology earnings.
Is Bitcoin Still In An Uptrend?
Bitcoin’s broader recovery has not fully broken, but late-May weakness shows momentum has faded. The next test is whether buyers can reclaim the daily moving average.
What Matters Most For June?
Fed policy expectations, oil headlines, US-China follow-through, and AI earnings momentum are likely to shape June’s market direction.


