

April markets settled into a more balanced rhythm after the sharper geopolitical swings seen in March. This monthly review covers forex, gold, oil, indices, and crypto, with a focus on how central bank caution, oil volatility, and resilient risk appetite shaped price action heading into May.
Market Recap Of April
April felt steadier on the surface, but markets still had to navigate the same three pressure points: Middle East risk, central bank caution, and a slower growth backdrop. The difference was that investors became less reactive to every headline and more selective in how they priced risk. US equities kept pushing higher, while forex, metals, and oil spent much of the month in choppy, two-way trade.
That split in performance tells the story of April well. Investors kept backing areas with strong earnings momentum, especially US mega-cap technology, but remained cautious in markets more exposed to oil, rates, and geopolitics. The Fed also reinforced the idea that policy will remain data-dependent. The Fed left rates unchanged this week, while policymakers remain wary that war-related energy pressure could keep inflation sticky and delay easing further.
That backdrop left April looking less like a trend month and more like a holding month. Risk appetite stayed firm in equities and crypto, but elsewhere, markets waited for a cleaner macro signal.
Major Currencies Consolidated
The US dollar failed to develop a clean trend, even with geopolitical uncertainty still in play. Safe-haven demand never became strong enough to drive a lasting breakout, and traders instead focused on relative rate expectations. That kept most major pairs rangebound.
USDJPY was the clearest example. The pair stayed inside its broad H4 range for most of the month, but by the end of April it had pushed back to the upper edge of that structure. The chart suggests buyers still control the medium-term bias, yet the move is now testing an area where intervention risk becomes harder to ignore. The dollar strengthened after the Fed held rates steady, with the yen weakening past 160, while the Bank of Japan also kept rates unchanged. That mix keeps yield support behind USDJPY, but it also raises the risk of official pushback if the move becomes too fast.
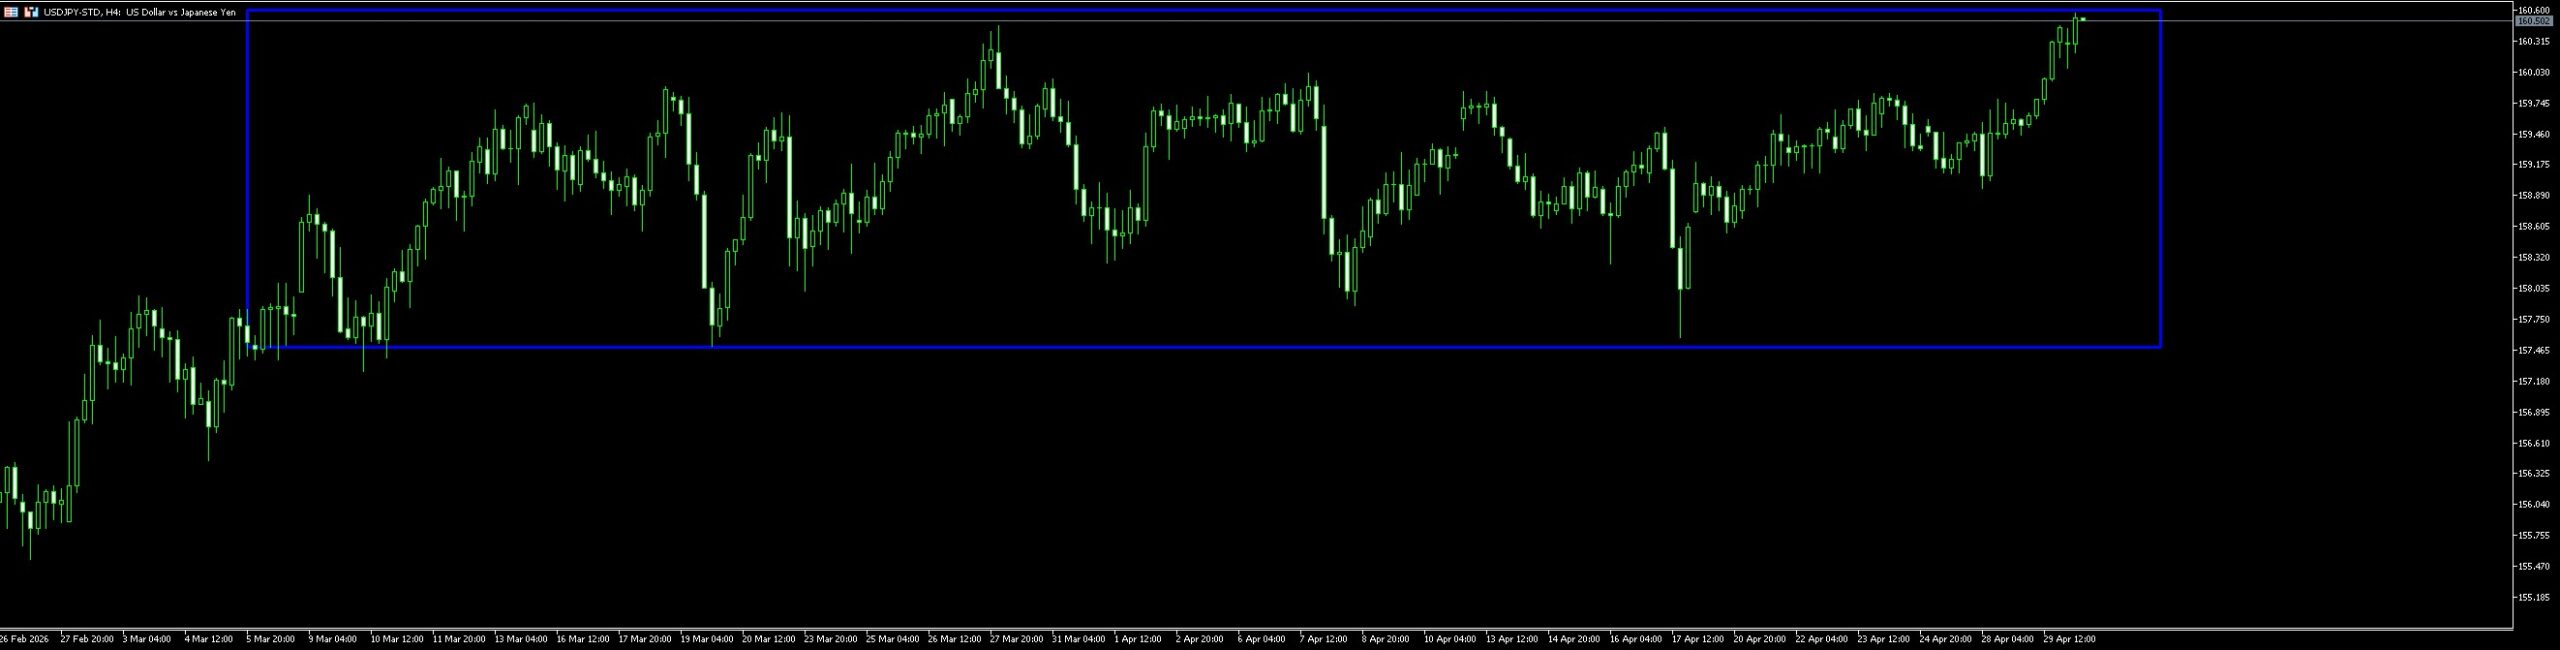
Fig. 1: 4-hour USDJPY chart showing price pressing the top of its broader consolidation range
The upper band remains the key technical level. A clean break higher would suggest yield differentials are winning again. Failure near the highs would keep the pair stuck in a familiar range.
Watch whether USDJPY can hold above the recent breakout attempt. If not, the pair may slip back into its wider box.
Metals take a backseat
Gold and silver lost momentum in April as the market’s defensive focus shifted away from precious metals and back toward rates, the dollar, and growth resilience.
Gold spent most of the month inside a broad consolidation range, but the tone weakened into month end. The H4 chart shows price rolling over from the upper half of the range and sliding back toward support. That suggests buyers were willing to defend dips earlier in the month, but lacked the conviction to push for a sustained breakout.
By the last few sessions of April, gold was testing the lower boundary of its range.
This price action fits the broader macro backdrop. A steadier dollar and relatively stable real yields reduced the urgency to chase non-yielding safe havens. Markets also became less convinced that the next policy move from the Fed would be a quick cut. With inflation still exposed to energy risk, gold lost one of its stronger supports.
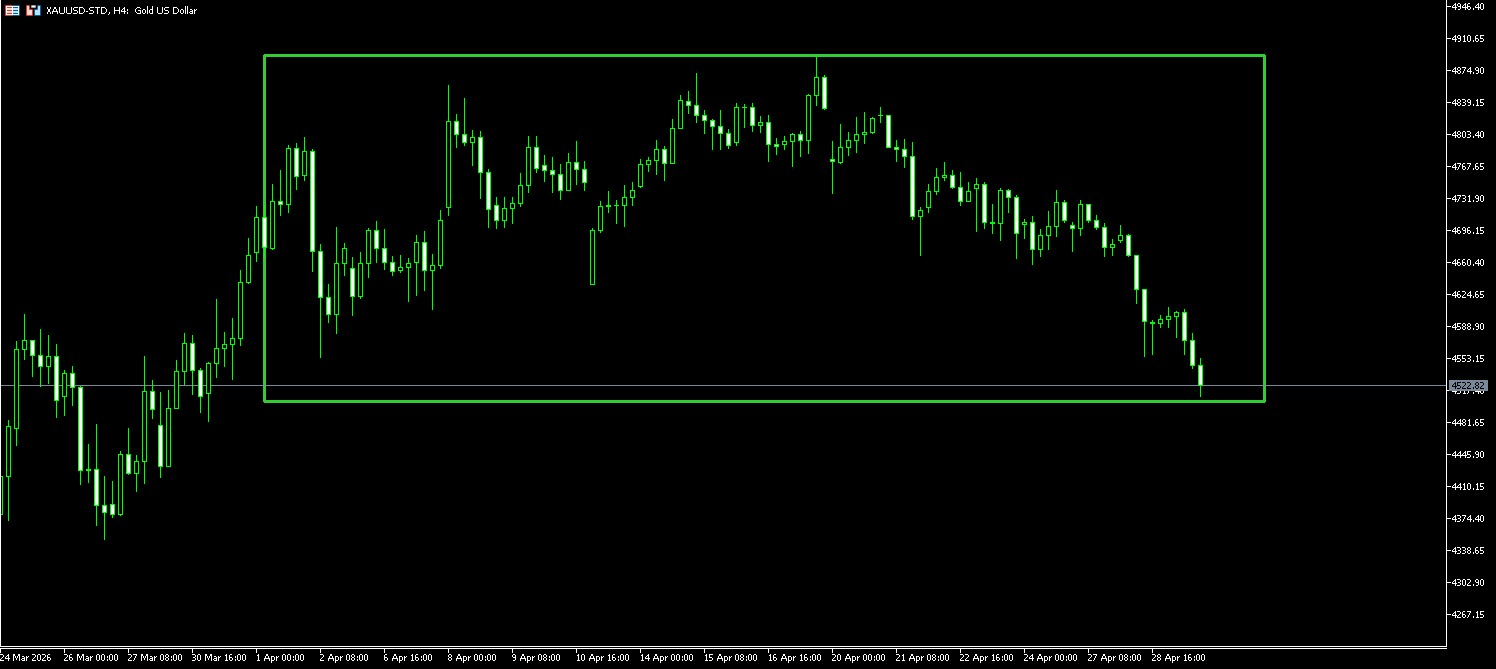
Fig. 2: 4-hour gold chart showing consolidation giving way to fresh downside pressure into support
The lower edge of the range is now the key decision zone. If support breaks, April’s sideways phase may turn into a deeper correction. If buyers step in here, gold may remain trapped in another broad range through early May.
Watch whether gold can reclaim lost ground quickly. If it cannot, traders may continue to favour the dollar over metals as the cleaner defensive trade.
Oil resources is clearest indicator
April delivered wide, often violent swings in crude, but the broader structure became clearer by month’s end. Oil dropped sharply into mid-April, found support near the lower end of its range, then rebounded hard and broke back above the range ceiling. The H4 chart now points to an upside breakout, with price pushing back above the former range highs and holding near $109.
That move lines up with the latest news flow. Shipping traffic through the Strait of Hormuz remains severely reduced, and the US is considering further steps to break the deadlock with Iran, including a broader effort to restore shipping flows. On April 30, oil rose again on reports that Washington was weighing military options as the deadlock deepened.
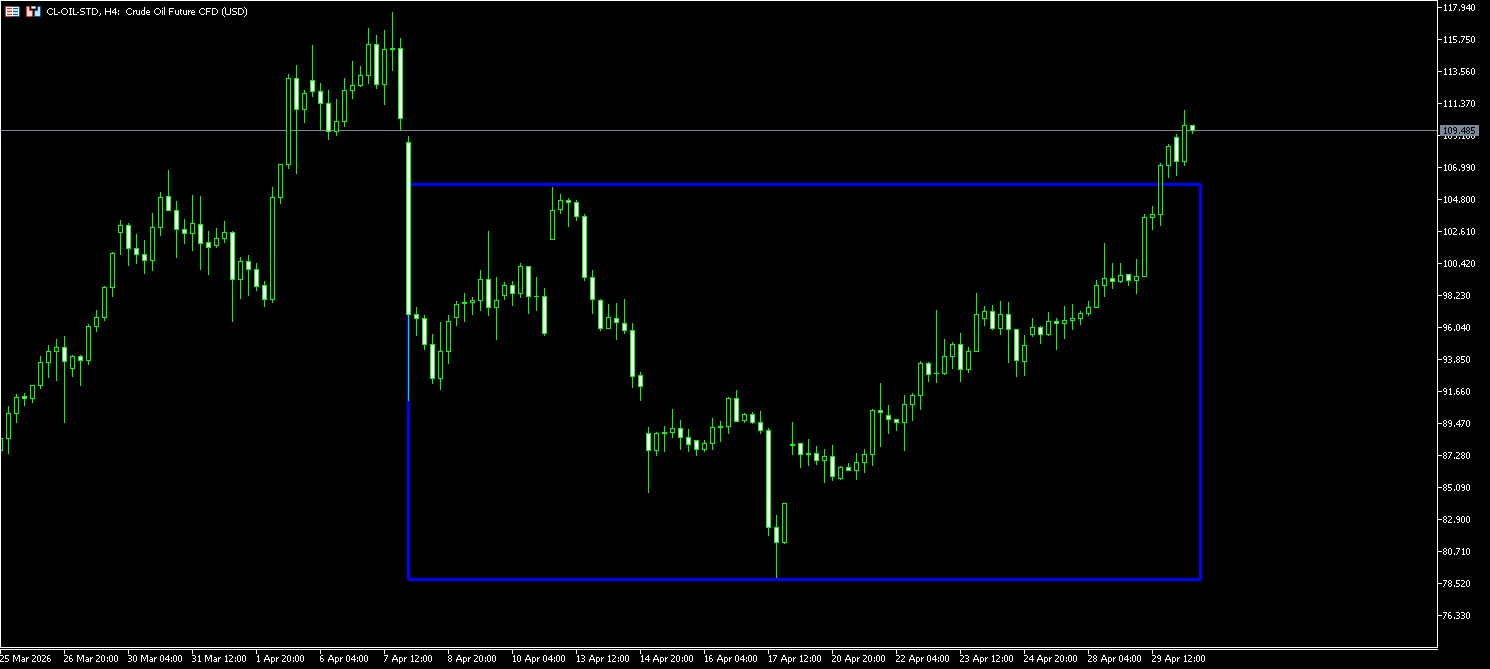
Fig. 3: 4-hour oil chart showing April’s wide range and late-month breakout to the upside
The technical picture has improved for bulls. What was a broad rectangle through most of April now looks like a completed base with a breakout above resistance. If price can hold above the old range high, oil may continue to carry a geopolitical premium into May.
Watch whether crude can stay above the breakout zone. A successful hold would keep inflation concerns alive and keep pressure on central banks.
Indices exercised resilience
Particularly in the US, Nasdaq kept trending higher and extended its rally after reclaiming an earlier support band. The H4 chart shows a strong advance from the start of April, followed by a clean push above the green support zone and then a move into fresh highs. The recent pullback looks controlled so far, more like digestion than reversal.
That strength reflects where investors still see growth. Mega-cap technology, AI infrastructure, and cloud-related earnings remain the main drivers of US equity leadership. Even with oil elevated and the Fed cautious, capital kept flowing into businesses that still offer strong earnings visibility. At the same time, Wall Street turned mixed ahead of big tech earnings, with renewed questions around AI growth and spending discipline. That makes May a key test for whether the rally can keep broadening or whether leadership narrows again.
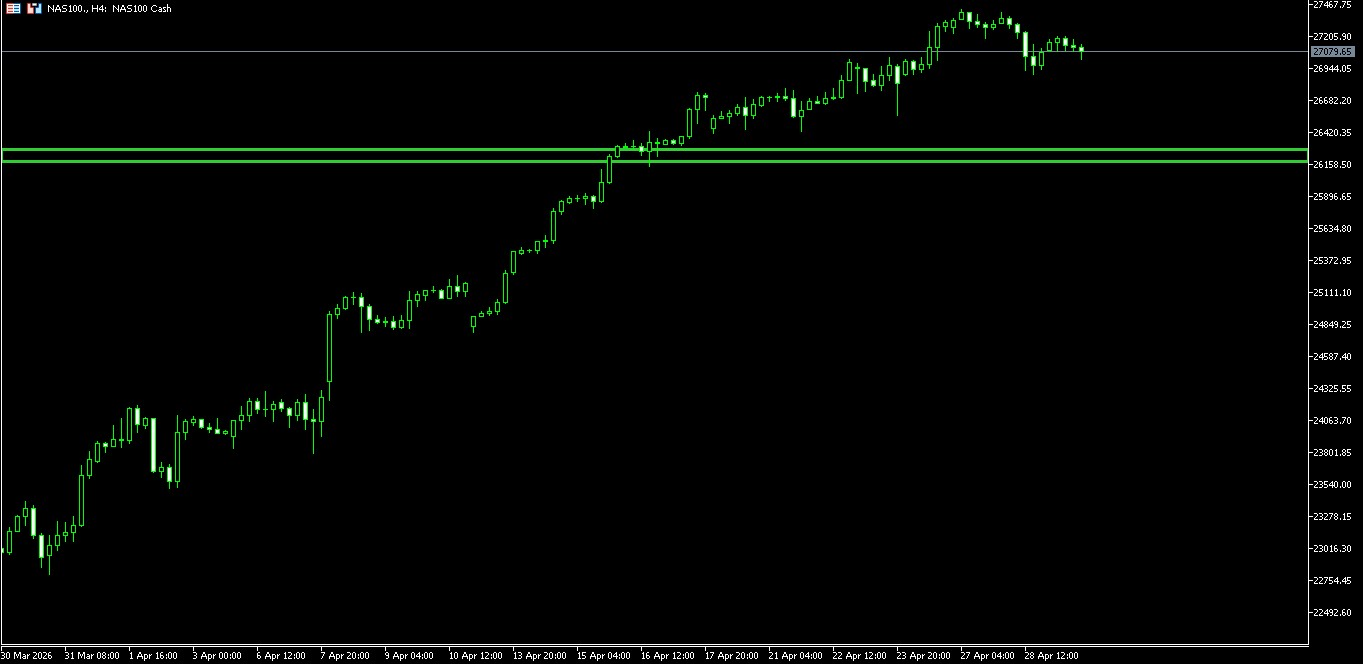
Fig. 4: 4-hour Nasdaq chart showing a strong April uptrend after support held
The old resistance zone has flipped into support. As long as price stays above that area, the broader uptrend remains intact.
Watch whether buyers defend the most recent pullback. If they do, the market may continue to reward growth. If not, the rally may start to tire near the highs.
Crypto recovers steadily
The H4 chart shows a constructive structure. Price built a series of higher lows along a rising trendline, while repeated rallies stalled below a clear resistance zone near the recent highs. That leaves Bitcoin trading inside what looks like an ascending triangle, with pressure building between rising support and a flat resistance ceiling.
This is a healthier setup than the range-bound action seen in March. It suggests buyers have been willing to step in on dips, but still need a catalyst to force a breakout. The broader risk-on mood in US equities helped, and a calmer USD also removed some macro pressure that had weighed on crypto earlier.
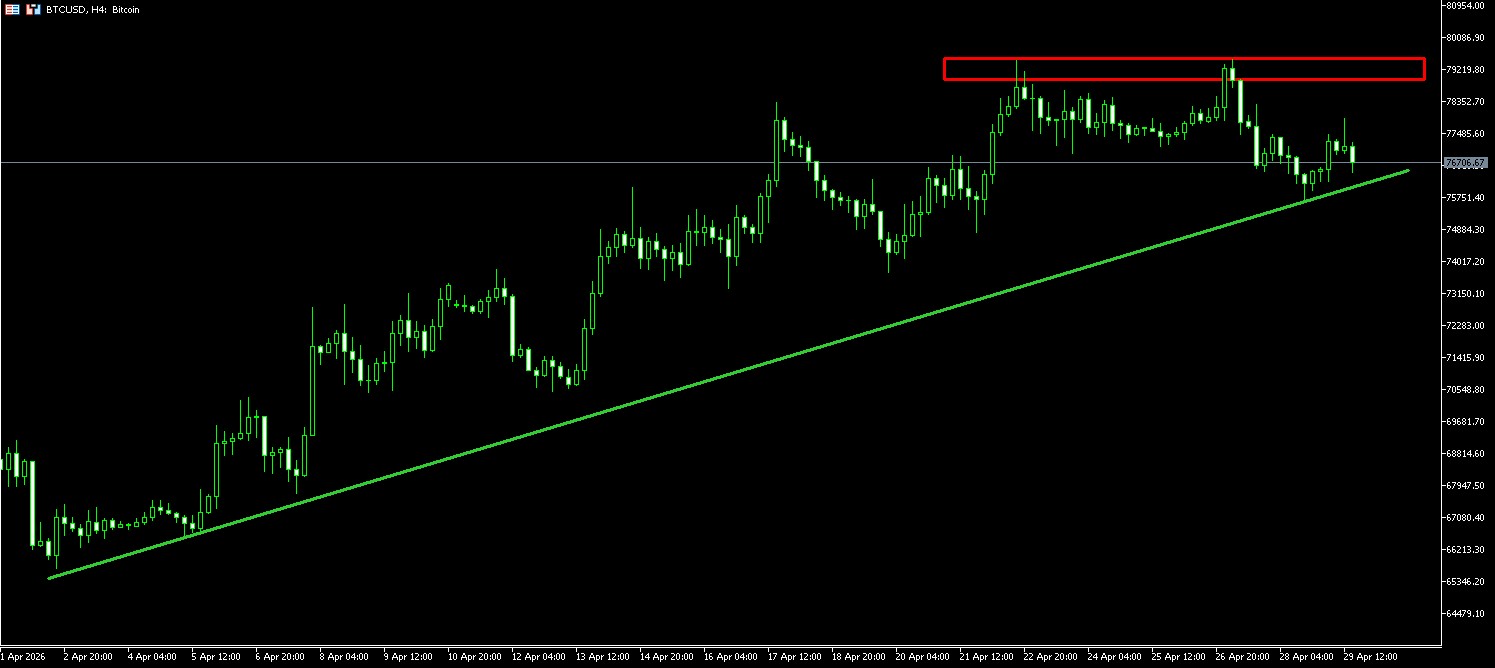
Fig. 5: 4-hour Bitcoin chart showing rising support below resistance near $80,000
The chart now points to a clean inflexion point. A break above the red resistance band would strengthen the case for continuation higher. A break below the rising trendline would suggest the April recovery has lost momentum.
Watch whether Bitcoin can finally clear resistance. If it does, crypto could start May with stronger momentum than most other risk assets.
Early Signals To Watch In May 2026
May starts with the same broad drivers still in play, but the balance between them is shifting.
The first is central bank policy. The Fed has stayed on hold, and markets are becoming less confident that rate cuts will arrive soon. War-related inflation risks have pushed expectations for the first Fed cut later into 2026, which reinforces the higher-for-longer story.
The second is energy. Oil’s late-April breakout matters because it feeds directly into inflation expectations and growth concerns. The longer Hormuz traffic stays disrupted, the harder it becomes for markets to ignore the macro spillover. The Asian Development Bank cut its regional growth forecasts this week and raised inflation forecasts because of the Middle East war and higher energy costs, which shows how quickly this theme is feeding into the broader outlook.
The third is earnings. US equities have stayed firm because investors still trust the earnings power of mega-cap technology. That means Apple, Microsoft, Nvidia and the wider AI complex will matter even more in May. Strong results can help extend equity leadership. Any disappointment could expose how much of the rally still rests on a narrow group of names.
May, therefore, looks like a month where markets may stop moving in sync. Oil, rates, and geopolitics will likely drive macro assets, while earnings and positioning will shape equities and crypto.
Frequently Asked Questions
Why Did April Feel More Rangebound Than March?
April still carried the same geopolitical risks, but investors reacted less emotionally to each headline. That led to more selective positioning and more two-way price action.
Why Is USDJPY Important Going Into May?
USDJPY sits near the top of its long-running range and reflects both yield differentials and intervention risk. It is one of the clearest FX expressions of central bank divergence.
Why Does Oil Matter So Much Right Now?
Oil remains the main channel through which geopolitical risk feeds into inflation expectations, growth concerns, and central bank pricing.
Why Did Gold Underperform While Oil Rose?
Gold lacked a strong falling-yield story behind it, while oil had a direct geopolitical supply story. That kept crude better supported than precious metals.
What Is The Main Equity Theme For May?
The main theme is whether mega-cap technology can keep carrying the market through earnings season while rates stay high and oil remains firm.


