





Momentum divergence happens when price and a momentum indicator (like RSI or MACD) move in opposite directions. This signals that a trend may be losing strength, even if price is still making new highs or lows. This guide covers what momentum divergence is, its four main types (including regular and hidden divergence), how to spot it on charts, how to use RSI and MACD to confirm it, and why it’s best combined with confirmation signals, risk management and a solid trade plan on platforms like MT4 and MT5.
Key Takeaways:
- Momentum divergence occurs when price and a momentum indicator move in opposite directions.
- There are four types: regular bullish, regular bearish, hidden bullish and hidden bearish.
- Regular divergence points towards a possible reversal. Hidden divergence points towards continuation.
- Divergence is a warning that momentum is fading, not an automatic entry signal.
Momentum divergence is one of the first concepts traders reach for when a trend starts to look tired. It is also one of the most misread.
This guide explores what momentum divergence actually is and how it forms, the four types and how they differ, which indicators show it most clearly, how reliable the signal really is, and how to build a rule-based approach around it. Let’s get started.
What Is Momentum Divergence?
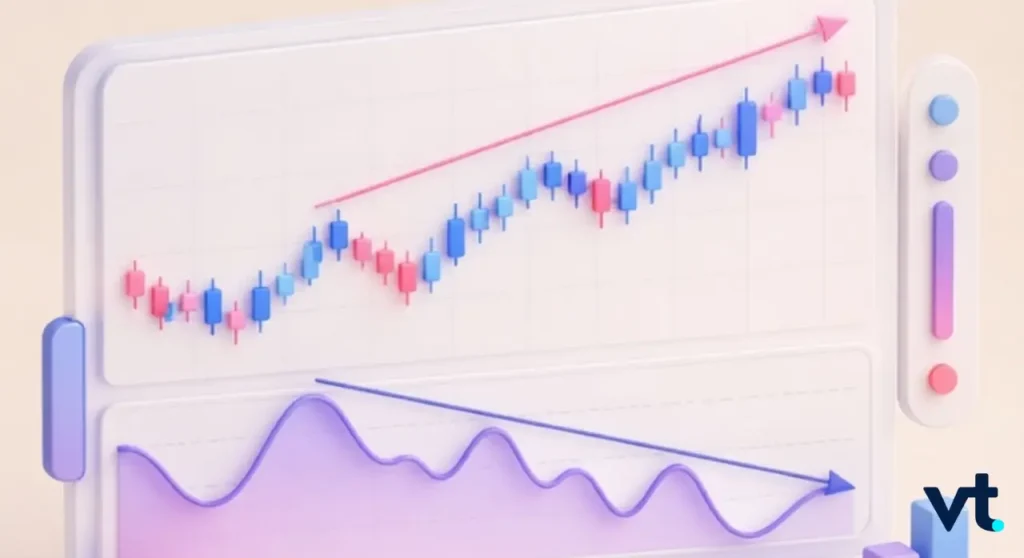
Momentum divergence happens when the price of an asset and a momentum indicator disagree. Price pushes to a new high, but the indicator does not follow. It also could be price drops to a new low, while the indicator quietly turns up.
That disagreement is the signal. It suggests the force behind the move is weakening, even though price itself has not turned yet.
Think of a car still rolling forward while the driver eases off the accelerator. The car is moving. The push behind it is not what it was.
What Is Divergence In Trading?
What is divergence in trading? In plain terms, it is a mismatch between what price is doing and what an oscillator is doing.
Traders use this comparison because indicator swings are often easier to read than price swings alone. The most common tools for the job are:
- Relative Strength Index (RSI): measures the speed and change of price movements on a 0 to 100 scale
- MACD: compares two moving averages and plots the difference
- Stochastic oscillator: compares closing price to a recent range
- Rate of change (ROC): measures percentage change over a set period
One point of confusion is worth clearing up early. The word “divergence” appears inside MACD’s own name, Moving Average Convergence Divergence. There it describes two moving averages moving apart from each other. That is a different thing from price-versus-indicator divergence, which is what this article covers.
How Momentum Divergence Forms On A Chart
Divergence is always measured between swing highs and swing lows. You need two reference points on price, and the two matching points on the indicator.
The process is mechanical:
- Identify two clear swing highs, or two clear swing lows, on price
- Mark the indicator reading at each of those same points
- Compare the direction of the price line against the indicator line
- If they slope in opposite directions, you have divergence
The word “clear” is doing real work in step one. Minor wobbles are noise, not swing points. Most poor divergence calls start here.
The Four Types Of Momentum Divergence
This is where most traders trip up, because two of the four types predict the opposite of the other two.
Regular Divergence Versus Hidden Divergence
Regular divergence forms at trend extremes and points towards a possible trend reversal. Hidden divergence forms during a pullback and points towards trend continuation.
Same tool. Opposite conclusions. Reading one as the other is a costly and very common mistake.
| Type | Price makes | Indicator makes | Suggests |
| Regular bullish | Lower low | Higher low | Possible upside reversal |
| Regular bearish | Higher high | Lower high | Possible downside reversal |
| Hidden bullish | Higher low | Lower low | Uptrend may continue |
| Hidden bearish | Lower high | Higher high | Downtrend may continue |
A useful shortcut: Regular divergence is a counter-trend signal, so it fights the prevailing direction. Hidden divergence sits with the trend.
Bullish And Bearish Momentum Divergence
Bullish divergence appears at lows. Price grinds to a lower low, but the indicator refuses to follow it down. That suggests selling pressure is easing.
Bearish divergence appears at highs. Price stretches to a higher high, but the indicator prints a lower high. That suggests buying pressure is thinning out.
Here is an illustrative example. All figures are hypothetical.
| Illustrative bearish setup | Swing 1 | Swing 2 |
| Price high | 1.2450 | 1.2510 |
| RSI reading | 72 | 64 |
| Reading | Price up 60 pips | Momentum down 8 points |
Price gained ground. Momentum lost it. That gap is the divergence.
Choosing A Momentum Divergence Indicator
No single tool has a monopoly on this. The choice affects how early you see a signal and how much noise comes with it.
RSI Versus MACD For Divergence
A momentum divergence indicator is simply whichever oscillator you use to make the comparison. The two most widely used are RSI and MACD.
| Illustrative comparison | RSI | MACD |
| Scale | Bounded, 0 to 100 | Unbounded |
| Typical setting | 14 period | 12, 26, 9 |
| Responsiveness | Faster to react | Smoother, slower |
| Best read from | Indicator swing points | Histogram peaks and troughs |
| Common trade-off | More signals, more noise | Fewer signals, later entry |
Practical notes when choosing:
- RSI tends to flag divergence earlier, which cuts both ways
- MACD smooths more, so it produces fewer false alarms but arrives later
- Some traders check both and only act when the two agree
- Whichever you pick, keep the settings consistent so your results stay comparable
Reading A Momentum Divergence Chart
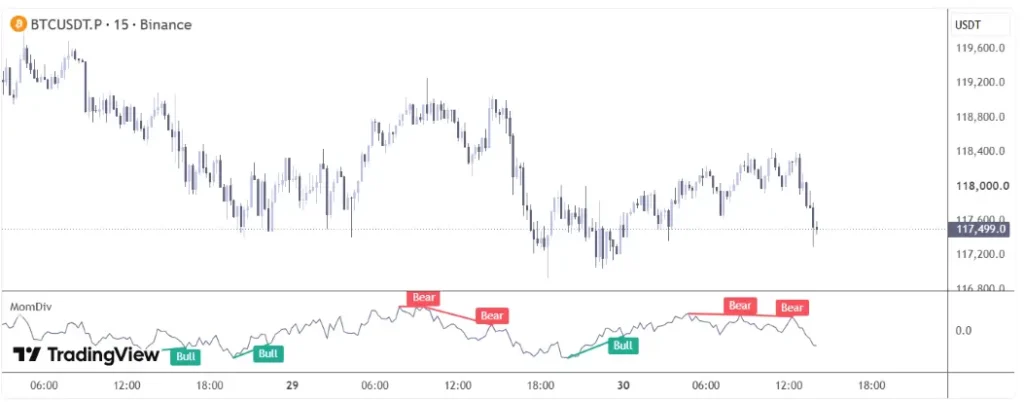
Source: TradingView
A clean momentum divergence chart needs very little on it. Price in the main window, one oscillator below, and the two swing points marked on each.
What to look for before calling it a signal:
- Two clearly defined swing points, not minor fluctuations
- The same two points marked on price and on the indicator
- A meaningful gap between the slopes, not a marginal one
- Confluence with a support or resistance level
- Agreement with the higher-timeframe trend, or a clear reason to fade it
Higher timeframes generally produce cleaner readings. On very short charts, divergence appears constantly, and most of it resolves into nothing.
How Reliable Are Momentum Divergence Signals?
This section matters more than the pattern recognition, so it is worth slowing down for.
Momentum divergence is best treated as a warning, not a trigger. It tells you the trend may be losing strength. It does not tell you the trend has ended, and it certainly does not tell you when.
Why Momentum Divergence Fails In Strong Trends
The structural problem is built into the pattern. Regular divergence forms because price has just made a new high or low. That means it forms inside an established trend, and then bets against it.
In a strong trend, price can keep extending while the indicator diverges repeatedly. The signal fires again and again. The trend carries on regardless.
Common reasons a divergence signal disappoints:
- The higher-timeframe trend is strong and simply overrides it
- The swing points chosen were noise rather than genuine pivots
- The trader entered on the divergence alone, with no confirmation
- The timeframe was too low, where divergence is near-constant
- Regular and hidden divergence were confused, so the direction was wrong
None of this makes the tool useless. It makes confirmation non-negotiable.
Building A Momentum Divergence Strategy
A workable momentum divergence strategy is mostly a set of filters. The divergence gets you looking. Everything else decides whether you act.
1. A Step-By-Step Entry Checklist
Run through this in order, and stop at the first failure.
- Establish the higher-timeframe trend direction first
- Identify divergence on your chosen timeframe
- Classify it correctly as regular or hidden
- Check whether it sits at a meaningful price level
- Wait for price-action confirmation, such as a rejection candle or a break of the swing structure
- Only then define entry, stop and target
Step five is the one most traders skip. Without a trigger, divergence can persist for a long time before anything happens.
2. Position Sizing And Stop Placement
Work backwards from what you can afford to lose, not forwards from what you hope to make.
Illustrative example on a $10,000 account:
- Maximum risk per trade: 1% → $100
- Entry on a EUR/USD setup: 1.0850
- Stop placed beyond the divergence swing low: 1.0820
- Stop distance: 30 pips
- Risk per pip: $100 ÷ 30 = $3.33 per pip
That calculation caps your worst case before you click. It also stops the size of a position being decided by how confident you feel.
A few placement principles:
- Put the stop beyond the swing point that formed the divergence, not just beneath the entry candle
- Give the stop room for normal volatility, using a measure such as Average True Range (ATR)
- Avoid clustering several divergence trades in correlated markets at once
- Set a weekly or monthly loss limit and hold to it
Here is an illustrative risk-to-reward comparison on the same $100 risk.
| Illustrative outcome | 1:1 target | 1:2 target |
| Risk | $100 | $100 |
| Reward if hit | $100 | $200 |
| Break-even win rate needed | 50% | 34% |
The second column is why many traders insist on a minimum 1:2 ratio before taking a divergence setup.
3. Pro Tips For MT4 And MT5 Setup
A tidy platform makes disciplined execution easier.
- Pro tip 1: Add an oscillator, not four. Extra indicators mostly add contradiction.
- Pro tip 2: Check the daily chart before trading divergence on H1 or H4.
- Pro tip 3: Use the horizontal line tool to mark swing points so you are not judging by eye.
- Pro tip 4: Set price alerts at your confirmation level rather than watching the screen.
- Pro tip 5: Log every divergence trade, including the type and timeframe, then review after thirty trades.
VT Markets provides access to both MetaTrader 4 and MetaTrader 5 platforms. You can use a demo account to practise and test a divergence strategy with virtual funds before trading with real capital.
Access to more details about how to trade assets in strong motion with momentum trading trading.
Frequently Asked Questions (FAQs)
Q1: Can you trade momentum divergence on its own?
It is not advisable. Divergence signals that momentum is weakening, but price can continue in the same direction for a long time afterwards. Most traders require price-action confirmation and trend context before entering.
Q2: Which timeframe works best for momentum divergence?
Higher timeframes such as daily and 4-hour charts generally produce cleaner signals. On very short charts, divergence appears frequently and much of it amounts to noise.
Q3: What is the difference between regular and hidden divergence?
Regular divergence forms at trend extremes and suggests a possible reversal. Hidden divergence forms during a pullback and suggests the existing trend may continue. They point in opposite directions, so classification matters.
Q4: Is RSI or MACD better for spotting divergence?
Neither is universally better. RSI reacts faster and flags more setups, including more false ones. MACD is smoother and later. Some traders use both and act only when the two agree.
Start Trading Momentum Divergence Setups With VT Markets
Momentum divergence offers you an early read on whether the force behind a move is holding up, before price makes that obvious.
What it does not offer is certainty. The traders who use momentum divergence well are not the ones who spot it fastest. They are the ones who classify it correctly, wait for confirmation, size the position from the stop, and accept that a fair number of signals will come to nothing.
Treat divergence as the reason to look closer, never as the reason to enter. Know your trend context. Know where your stop sits and why. Know what you are risking before you click.
With VT Markets, you can access MetaTrader 4 and MetaTrader 5, their built-in oscillators, and trading tools such as Stop Loss, Take Profit etc. to help apply predefined risk controls.
Open a demo account, practise identifying setups. Create a live VT Markets account today to access our platform features, including market insights and educational content.
Trading involves risk. All examples and figures in this article are illustrative only and do not represent actual or expected results. This content is educational and is not investment advice.








