





Key Takeaways
- A volume profile strategy reads traded volume at each price level, not over time, to show where a market accepts or rejects value.
- The three anchors are the point of control (POC), the value area, and its edges, the value area high (VAH) and value area low (VAL).
- Core setups are breakouts, mean reversion and naked POC trades, each suited to a different market condition.
- In forex, the profile runs on tick volume, while indices, commodities and share CFDs carry cleaner exchange-based volume.
Most indicators tell you what price did over time. A volume profile strategy flips that view. It shows you where traders actually did business, price by price.
For CFD traders, that shift is a big deal. Knowing where volume built up helps you spot support, resistance and the levels a market is likely to defend. This guide breaks down how a volume profile strategy works, how to read it, and how to trade it across forex, indices, commodities and share CFDs.
What Is a Volume Profile Strategy
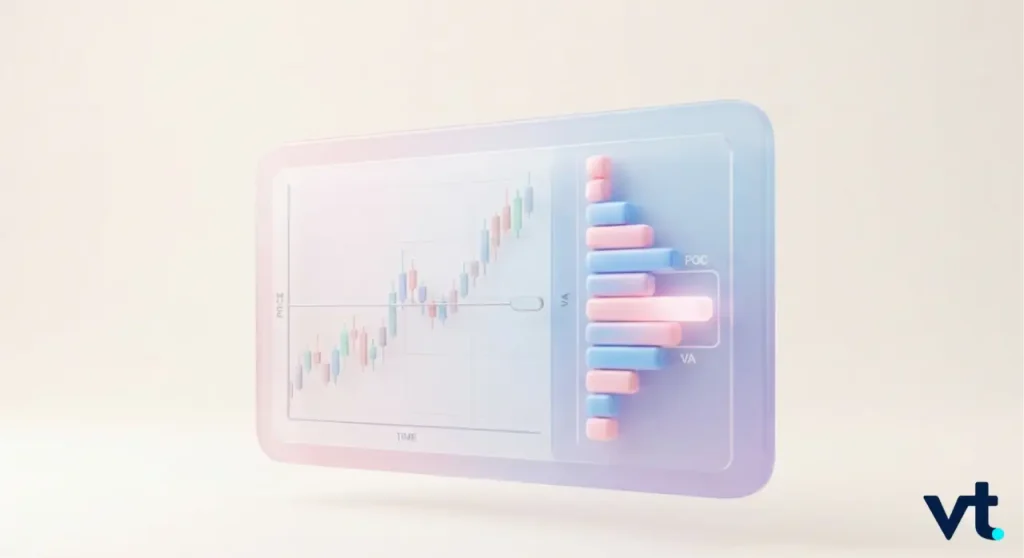
A volume profile strategy uses the distribution of traded volume across price levels to decide where to enter, exit and place risk. Rather than plotting volume over time, it plots volume against price. The busiest prices show agreement. The quiet prices show imbalance.
Traders use this map in three simple ways:
- Heavy-volume prices act as magnets and often become support and resistance.
- Thin-volume prices tend to see fast moves, since little agreement holds price there.
- The single busiest price, the point of control, works as a reference for the whole session.
How Volume Profile Differs From a Standard Volume Indicator
A standard volume indicator sits below your chart. It shows one bar of volume for each candle, so it answers when volume arrived. A volume profile rotates that idea. It shows volume for each price level as a horizontal histogram down the side of the chart, so it answers where volume traded.
The difference comes down to direction:
- Time-based volume: vertical bars, one per candle, read left to right.
- Price-based volume: horizontal bars, one per price level, read top to bottom.
- The longest horizontal bar marks the price with the most activity.
The Core Components: POC, Value Area, VAH and VAL
Three reference points do most of the work in any volume profile strategy:
- Point of control (POC): the price level with the highest traded volume. It marks the fairest price of the period.
- Value area: the price range that holds around 70% of total volume. This band sits close to one standard deviation of the distribution.
- Value area high (VAH): the upper edge of that band.
- Value area low (VAL): the lower edge of that band.
Together, the POC, VAH and VAL frame where the market considers price fair. When price sits inside the value area, the market is in balance. When price leaves it and holds, the balance is shifting.
Here is a simplified example.
Let’s assume a session where volume traded at each price like this:
| Price level | Volume (contracts) | Zone |
| 1.1050 | 200 | Outside value |
| 1.1045 | 450 | Outside value |
| 1.1040 | 900 | VAH |
| 1.1035 | 1,500 | POC |
| 1.1030 | 1,100 | VAL |
| 1.1025 | 600 | Outside value |
| 1.1020 | 250 | Outside value |
| Total | 5,000 |
The total volume is 5,000 contracts. The value area covers 70%, or 3,500 contracts. The three central rows, from 1.1030 to 1.1040, hold exactly that 3,500 (900 + 1,500 + 1,100).
So the POC is 1.1035, the VAH is 1.1040 and the VAL is 1.1030. Charting tools work this out for you in real time.
High Volume Nodes vs Low Volume Nodes
Beyond the value area, the shape of the profile tells its own story:
- A high volume node (HVN) is a fat cluster of trading. Price tends to slow here and revisit it, so HVNs often act as support and resistance.
- A low volume node (LVN) is a thin gap where little traded. Price tends to move through LVNs quickly, which makes them useful breakout and rejection markers.
A practical read: Expect prices to stall at HVNs and travel fast through LVNs. That one idea shapes many entries and targets.
How to Read a Volume Profile
To read a volume profile, start with the POC, then map the value area, then note the nodes. This section turns the histogram into a plan.
Reading the Point of Control
The POC is your anchor:
- Price above the POC: the level often acts as support on a pullback.
- Price below the POC: the level often caps rallies as resistance.
- A POC that steps higher each session shows buyers building value upward.
- A stable POC that price keeps circling signals a balanced, range-bound market.
Pro tip: Mark the current POC on your chart before the session opens. It gives you a clear line to trade around from the first candle.
Mapping the Value Area (the 70% Zone)
The value area captures where most business happened. A well-known rule of thumb guides the read:
- Price opens inside the prior value area and stays inside: odds favour rotation back toward the POC.
- Price opens outside and holds: value may be migrating to a new range.
- Price tags the VAH or VAL and rejects: the edge is holding, which suits fade trades.
- Price closes beyond the VAH or VAL: acceptance, which suits breakout trades.
The 70% figure is not arbitrary. It sits close to one standard deviation, so it captures the bulk of activity while leaving the extremes as signal.
Session vs Visible Range vs Fixed Range Profiles
Three profile types answer different questions:
| Profile type | What it profiles | Best for |
| Session | Each trading session, fresh each day | Intraday work |
| Visible range (VRVP) | Only what is on screen, recalculates as you scroll | Quick structure reads |
| Fixed range | A specific move you select | Pinpointing one leg’s POC |
Beginners often start with the visible range profile, since it needs no setup beyond adding it to the chart.
How to Set Up Volume Profile
You can add a volume profile in a few clicks on most platforms. Availability and the volume source vary, so it helps to know where the data comes from before you trade the levels.
On TradingView
- Open the indicators menu and search for the profile you want, such as Visible Range or Session Volume.
- Add it to the chart, then open its settings.
- Confirm the value area is set to 70%.
- Choose whether to show the developing POC in real time.
The visible range version is the quickest start, since it profiles whatever you have on screen.
On MT4 and MT5
MetaTrader does not ship with a full profile by default. You add it as an indicator or through a broker package. At an established broker platform, you can run volume profile tools on both MetaTrader 4 and MetaTrader 5.
One caveat matters here. MetaTrader draws on tick volume, not centralised exchange volume. Treat the profile as a behavioural read rather than a record of contracts traded. It still maps activity clusters reliably for most instruments.
Best Timeframe and Settings to Start With
There is no single best timeframe. The right one matches your holding period:
- Intraday: anchor a session profile on a 5 to 15 minute chart.
- Swing: use a daily or weekly fixed range profile across a defined move.
- All styles: keep the value area at 70% while you learn.
The 70% default is vital because it is the convention most other traders watch. Shared levels attract shared reactions, which is part of why they hold.
Volume Profile Trading Strategies

The best volume profile strategy for you depends on the market condition in front of you. Balanced markets suit fading those edges. Trending markets suit trading breakouts. Here are the four core setups:
1. Breakout Strategy: Trading Acceptance Beyond Value
A breakout setup looks for price to leave the value area and stay out. The key word is acceptance:
- A brief poke beyond the VAH or VAL that snaps back is rejection, not a breakout.
- A break that builds a small shelf of volume beyond the old value area shows acceptance.
- Low volume nodes just beyond the edge often mark the launch point, since price accelerates through thin levels.
Wait for the close beyond value, not just the wick. That patience filters out many false starts.
2. Mean Reversion: Fading Back to the Point of Control
In a balanced market, price rotates between the value area edges and back toward the POC. A mean reversion setup fades the extremes.
Here is a simplified example on gold:
Say the VAH sits at 2,420, the POC at 2,400 and the VAL at 2,385. Price rallies to the VAH and stalls:
- Short entry near 2,418.
- Stop just above the VAH at 2,424, a risk of 6 points.
- Target the POC at 2,400, a reward of 18 points.
- That is a reward-to-risk ratio of 3 to 1 before spreads and costs.
This setup suits quiet, range-bound sessions. It struggles in strong trends, where the edges keep breaking. Confirm the market is balanced before you fade.
3. Naked POC: Trading Untested Control Levels
A naked POC, also called a virgin POC, is a point of control from a prior session that price has not yet revisited:
- The market once built heavy agreement there, so it often acts as a magnet.
- Traders map naked POCs from earlier sessions as targets and reaction zones.
- The logic is simple: unfinished business tends to get revisited.
Timing is never certain, so treat a naked POC as a target, not a promise.
4.. Combining Volume Profile With Price Action
A volume profile strategy becomes far more reliable when paired with price action:
- A value area edge that lines up with a prior swing high carries more weight.
- A POC that sits on a round number or trendline adds confluence.
- A rejection candle at an HVN gives a cleaner entry than the level alone.
The profile tells you where activity clustered. Price action tells you how the market is behaving there right now. The best trades sit where both agree.
Matching the Volume Profile Strategy to Your Style
No single volume profile strategy fits every trader. The right setup depends on how long you hold, how much screen time you have, and how you handle risk. This is also where the question of volume profile strategy win rate comes in.
Win rate alone does not decide profitability. Reward-to-risk matters just as much.
Consider a simple illustration. Suppose a setup wins 45% of the time, with an average win of 3R and an average loss of 1R:
- Wins: 0.45 multiplied by 3R equals 1.35R.
- Losses: 0.55 multiplied by 1R equals 0.55R.
- Expectancy: 1.35R minus 0.55R equals 0.80R per trade.
That is a positive edge from a sub-50% win rate, purely because the winners are larger than the losers. It shows why chasing a high win rate alone can mislead. These figures are illustrative only and not a projection of results.
Day Trading and Scalping
- Build a fresh session profile each day and trade the rotations within it.
- Scalpers watch the developing POC and fade moves back toward it.
- The value area edges act as intraday decision points.
- Place tight risk just beyond the relevant node, since these moves are fast.
Swing Trading
- Zoom out to daily and weekly profiles.
- Use a fixed range over a multi-week move to find the dominant POC.
- Treat naked POCs from prior weeks as swing targets.
- Higher timeframe levels tend to be watched by more participants, so reactions can be cleaner.
Volume Profile Strategy Considerations for Beginners
If you are new, keep it simple:
- Start with one profile type, such as the visible range profile.
- Focus on how price reacts at the POC and the value area edges.
- Watch charts without trading first, to build pattern recognition.
- Add size only once the reads feel familiar.
A volume profile strategy rewards observation. Time spent reading the chart is rarely wasted.
Volume Profile Across Asset Classes
A volume profile behaves differently depending on where the volume data comes from. This is where a volume profile strategy forex approach differs from one built for futures or share CFDs.
Why Forex Uses Tick Volume
Spot forex has no central exchange, so no single record of total volume exists. Platforms solve this with tick volume:
- Tick volume counts how many times price changed in a period, not how many units traded.
- It correlates well with real activity in liquid pairs.
- A forex profile still maps clusters of interest usefully.
Read forex tick volume as a measure of activity intensity, not a precise contract count.
Indices, Commodities and Share CFDs
Instruments tied to centralised venues carry cleaner volume:
- Index and commodity CFDs often track underlying futures with real traded volume.
- Share CFDs reference exchange-traded stock.
- The same profile logic applies across all of them, with stronger data behind the levels.
The multi-asset range at VT Markets spans forex, indices, commodities and share CFDs, so you can apply one framework across markets while staying aware of the data source.
Futures vs CFDs
Futures are the classic home of volume profile, since they trade on centralised exchanges with transparent, reported volume. CFDs on those same underlying markets inherit much of that behaviour:
- Price and volume characteristics track the underlying closely.
- Profile levels on index, commodity and share CFDs tend to line up with the levels futures traders watch.
- That shared attention is part of why the levels react.
Volume Profile Strategy vs Other Tools
A volume profile strategy answers a different question from most popular tools. It maps where activity accumulated. Others show a mean or live pressure. They complement each other more than they compete.
| Tool | What it shows | Best used for |
| Volume profile | Volume at every price over a range | Mapping key levels and structure |
| VWAP | One volume-weighted average line | A fast session fair-value filter |
| Order flow | Live buying and selling per price | Timing entries in the moment |
1. Volume Profile vs VWAP
VWAP, the volume weighted average price, plots a single line showing the average price weighted by volume, usually reset each session. A volume profile shows the full distribution across every price:
- VWAP: one line, a fast fair-value reference for the session.
- Volume profile: a full map of where volume built up.
- Many traders run both, using VWAP as a trend filter and the profile for structure.
2. Volume Profile vs Order Flow
Order flow tools, such as the footprint chart, show live buying and selling at each price as it happens. A volume profile is the summary that builds up from all that activity:
- Order flow: the microscope for the current moment.
- Volume profile: the map of where the market has been.
- Traders often use order flow to time entries at levels the profile identifies.
Common Mistakes to Avoid
- Trading a profile level in isolation, with no confirmation from price action.
- Treating forex tick volume as exact contract data.
- Fading a breakout that has already gained acceptance beyond value.
- Changing the value area away from 70% too early, which removes the shared convention.
- Ignoring spreads and costs when sizing the reward-to-risk on a trade.
Keep the method simple until the reads become second nature. Complexity rarely improves a volume profile strategy.
Frequently Asked Questions (FAQs)
Q1: What is a volume profile strategy?
A volume profile strategy uses the distribution of traded volume across price levels, not time, to find where a market accepts or rejects value. Traders build entries, exits and risk around the busiest and thinnest prices.
Q2: What does the point of control tell you?
The point of control (POC) is the price with the highest traded volume, marking the fairest price of the period. It often acts as support when price trades above it and resistance when price trades below it.
Q3: What is the difference between VAH and VAL?
VAH is the value area high, the upper edge of the 70% volume band. VAL is the value area low, the lower edge. Together they frame where the market considers price fair, and reactions at these edges signal acceptance or rejection.
Q4: How do you read a volume profile for trading?
Start with the POC to find the fairest price, then map the value area to see the accepted range. Trade toward high volume nodes as magnets, and treat low volume nodes as fast-move zones. Price holding inside value suggests balance.
Q5: What is the best timeframe for volume profile?
There is no universal best timeframe, only one that matches your holding period. Intraday traders often use session profiles on 5 to 15 minute charts. Swing traders use daily or weekly fixed range profiles. Keeping the value area at 70% helps align your levels with what other traders watch.
Start Online CFD Trading with VT Markets Today
If you are ready to explore online trading, VT Markets provides access to tools and platforms to help you get started. Trade on powerful platforms like MetaTrader 4 (MT4) and MetaTrader 5 (MT5), designed for speed, reliability, and advanced trading features.
New to trading? You can practise risk-free with a VT Markets demo account before moving to a live CFD account. For ongoing support, our Help Centre offers educational resources and platform guidance to help you build confidence as you learn.
Open your account with VT Markets today and access secure, transparent, and competitive CFD trading across some of the world’s most popular markets.








