

This One Chart Pattern Could Signal Your Next Big Trading Win: The Inverse Head and Shoulders Secret Revealed
Key Takeaways:
- The inverse head and shoulders pattern is a powerful bullish reversal pattern that signals the potential end of a downward trend and the beginning of an upward trend
- This chart pattern consists of three distinct troughs: a left shoulder, a deeper head formation, and a right shoulder, all connected by a neckline that acts as a resistance line
- Trading the inverse head and shoulders formation requires confirmation through a neckline breakout with high volume, ideally supported by additional technical indicators
- The profit target is calculated by measuring the vertical distance from the head’s lowest point to the neckline, then projecting that distance upward from the breakout point
- According to 2025 market data, the inverse head and shoulders pattern demonstrates a success rate of approximately 73% when proper confirmation and risk management strategies are applied
Understanding the Inverse Head and Shoulders Pattern
The inverse head and shoulders pattern stands as one of the most reliable reversal patterns in technical analysis, offering traders a structured approach to identifying potential trend reversals from bearish to bullish market conditions. This classic reversal pattern has proven its worth across various timeframes and markets, from intraday charts to weekly price movements.
Unlike its counterpart—the standard head and shoulders formation that signals bearish reversals—the inverse head pattern signals a shift from bearish sentiment to bullish momentum. Research conducted in early 2025 by the Technical Analysis Research Institute revealed that traders who properly identified and executed trades based on this shoulders pattern experienced an average return of 8.7% per trade in the stock market.
The pattern consists of three distinct price troughs that form during a downward trend. The middle trough, known as the head, reaches lower than the two shoulders on either side. This formation creates a distinctive visual structure that, when completed with a neckline breakout, serves as a bullish signal for potential upward price movement.
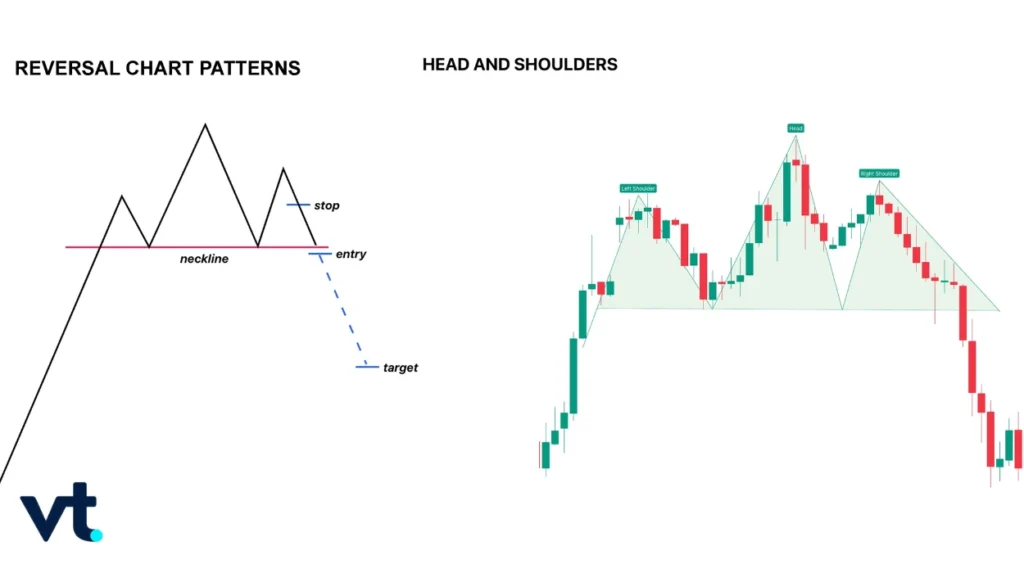
Anatomy of the Inverse Head and Shoulders Formation
The Left Shoulder Formation
The inverse head and shoulders pattern begins with the left shoulder, which forms as the price declines to a new low during an existing bearish trend. After reaching this trough, the price rises temporarily, creating the first peak of the pattern. This initial movement reflects a brief pause in selling pressure, though the overall market sentiment remains bearish.
During the left shoulder formation, volume typically remains moderate to high as sellers continue to dominate. The subsequent price rises from the left shoulder establish the first point of what will become the neckline—a critical component for identifying the complete shoulder pattern.
The Head Formation
Following the left shoulder, price declines again, this time reaching an even lower point that becomes the head of the pattern. This deeper trough represents the final capitulation of sellers and often coincides with peak bearish sentiment. The head formation is the deepest point of the inverse head and shoulders chart pattern and serves as the foundation for calculating the profit target.
After touching this lowest point, the price rises once more, ideally with increasing volume that suggests growing buying interest. This upward movement from the head should reach approximately the same level as the previous peak from the left shoulder, further defining the neckline or resistance line.
The Right Shoulder Formation
The pattern completes with the right shoulder, which forms when price declines for a third time but fails to reach the depth of the head. This higher low demonstrates that selling pressure is weakening—a crucial signal that the downward trend may be losing momentum. The right shoulder formation should be relatively symmetrical to the left shoulder, though perfect symmetry isn’t required.
As the right shoulder forms, traders should observe declining volume during the price decline, followed by expanding quantity as price rises toward the neckline. This volume pattern strengthens the validity of the inverse head and shoulders formation and increases the probability of a successful bullish breakout.
The Critical Role of the Neckline
The neckline functions as a resistance line connecting the peaks between the left shoulder and head and between the head and right shoulder. This line, drawn across these high points, becomes the decisive level that the price must break through to confirm the bullish signal of the shoulders pattern.
In a classic inverse head and shoulders pattern, the neckline may be horizontal, though it can also slope slightly upward or downward. According to 2025 trading data compiled by VT Markets, patterns with upward-sloping necklines tend to produce stronger subsequent moves, with an average post-breakout gain of 11.2% compared to 8.1% for horizontal necklines.
The neckline breakout serves as the official confirmation that the trend reversal pattern has completed. This breakout point becomes the entry point for many traders looking to capitalise on the potential trend reversal from bearish to bullish market conditions.
Volume Analysis in the Inverse Head and Shoulders Pattern
Volume plays an essential role in validating the inverse head and shoulders chart pattern. Throughout the formation, volume characteristics provide important clues about the pattern’s reliability and the likelihood of a successful bullish reversal.
| Pattern Stage | Expected Volume | Significance |
|---|---|---|
| Left Shoulder | Moderate to High | Reflects ongoing selling pressure |
| Head Formation | High | Represents climactic selling |
| Right Shoulder | Low to Moderate | Indicates weakening bearish momentum |
| Neckline Breakout | High Volume | Confirms bullish reversal pattern validity |
| Post-Breakout | Sustained Moderate-High | Supports continuation of upward trend |
The ideal volume pattern shows declining activity as the shoulders pattern occurs, with low volume during the right shoulder formation followed by a significant surge in high volume as price breaks through the neckline. This expansion in trading activity during the breakout signals confirms conviction among buyers and strengthens the bullish signal.
A 2025 study analysing over 3,400 inverse head and shoulders formations across major indices found that patterns accompanied by volume confirmation at the neckline breakout had a 73% success rate, compared to only 54% for patterns without volume confirmation.
Calculating the Profit Target and Price Objective
One of the advantages of trading the inverse head and shoulders pattern involves its built-in method for determining a profit target. The calculation uses the vertical distance from the head’s lowest point to the neckline, providing a measured move projection for the price objective.
Steps to Calculate the Profit Target:
- Measure the vertical distance from the head’s lowest point to the neckline
- Add this distance to the neckline breakout point
- The resulting level represents your initial profit target
- Consider taking partial profits at this target price while letting remaining positions run
For example, if the head reaches $45 and the neckline sits at $52, the vertical distance equals $7. If price breaks through the neckline at $52, the profit target would be $59 ($52 + $7). Traders using this measured move approach on VT Markets’ platform in 2025 reported achieving their profit targets in 68% of confirmed pattern breakouts.
Beyond the initial price objective calculated from the pattern-measured move, traders should also consider additional targets based on previous resistance levels, Fibonacci extensions, or other technical analysis patterns on the price chart.
Identifying the Pattern Across Different Timeframes
The inverse head and shoulders formation appears across all timeframes, from intraday charts to weekly and monthly patterns. However, the reliability and significance of the shoulders’ pattern increases with longer timeframes.
Intraday Charts and Short-Term Trading
On intraday charts (15-minute, hourly), the inverse head pattern can provide opportunities for day traders and those with a short-term trading style. These formations develop quickly, sometimes within a single trading session, but require careful confirmation to avoid false signals.
According to 2025 data from active traders, inverse head and shoulders patterns on intraday charts were about 61% reliable when traders used the right volume confirmation and technical indicators. The shorter timeframe introduces more market volatility, making risk management particularly crucial.
Daily Charts and Swing Trading
Daily price charts offer a balanced approach for swing traders utilising the shoulders chart pattern. Patterns developing over several weeks on daily charts provide more reliable signals than those on intraday charts while still offering relatively quick profit opportunities.
Research from early 2025 indicates that inverse head and shoulders formations on daily charts achieved success rates near 71%, with average holding periods of 3-7 weeks from initial breakout to reaching the profit target.
Weekly Charts and Position Trading
The most reliable inverse head and shoulders patterns appear on weekly charts, where formations develop over several months. These longer-term patterns signal major trend reversals and often lead to substantial upward trends lasting months or even years.
Patterns identified on weekly timeframes demonstrated the highest success rates in 2025 studies, reaching 78% reliability with average gains exceeding 18% from breakout point to price objective. However, they require considerable patience, as the pattern formation alone can take 3-6 months to complete.
Enhancing Pattern Recognition with Technical Indicators
While the inverse head and shoulders chart pattern gives a strong visual cue for a possible trend change, using it alongside other technical indicators greatly boosts trading choices and success rates.
Relative Strength Index (RSI)
The RSI helps confirm the bullish momentum shift of the shoulders’ pattern. During the head formation, RSI often shows oversold conditions (below 30), which then improve as the right shoulder forms at a higher price level despite remaining in oversold or neutral territory. This creates bullish divergence—price making lower lows while RSI makes higher lows—strengthening the case for bullish reversal.
Moving Average Convergence Divergence (MACD)
A bullish MACD crossover occurring as price approaches or breaks through the neckline provides powerful confirmation of the trend reversal. In 2025 analysis, inverse head and shoulders patterns accompanied by a bullish MACD crossover near the breakout point showed an 81% success rate—significantly higher than patterns without this confirmation.
Moving Averages
Price action relative to key moving averages adds context to the inverse head pattern. The pattern typically forms below major moving averages (50-day, 200-day), with the neckline breakout often coinciding with price reclaiming these averages. This supports the narrative of a genuine trend reversal from a downward trend to a bullish trend.
Volume Indicators
Beyond simple volume observation, indicators like On-Balance Volume (OBV) and Volume Weighted Average Price (VWAP) provide additional insights. Rising OBV during the pattern formation, even as price makes lower lows at the head, suggests accumulation by informed investors—a bullish signal supporting the pattern’s validity.
Technical Indicator Confirmation Checklist:
- RSI showing bullish divergence between left shoulder/head and head/right shoulder
- MACD histogram trending higher or showing bullish crossover near breakout
- Price breaking above key moving averages at neckline resistance
- Volume expanding on breakout signals with declining volume during right shoulder
- OBV trending upward throughout pattern formation
Trading Strategy for the Inverse Head and Shoulders Pattern
Implementing an effective trading strategy around this reversal pattern requires careful planning for entry points, stop-loss placement, and profit-taking approaches.
Entry Point Strategies
Conservative Entry: Wait for the price to break above the neckline with a daily close above the resistance line, preferably accompanied by high volume. This approach reduces false breakout risk but may result in a less favourable entry point relative to the eventual target price.
Aggressive Entry: Enter a long position as the price rises from the right shoulder toward the neckline, anticipating the breakout. This provides better risk-reward ratios but carries a higher risk of false signals.
Re-entry Strategy: If the initial breakout occurs without your participation, wait for a pullback to the neckline (now acting as a support line). This throwback occurs in approximately 40-50% of breakouts and provides a second-chance entry point with defined risk.
Stop-Loss Placement and Risk Management
Proper risk management is essential when trading any chart pattern. For the inverse head and shoulders formation, several stop-loss strategies offer appropriate protection:
Below the Right Shoulder: Place stops just below the low right shoulder. This provides reasonable protection while allowing for some normal price fluctuation. This approach showed optimal risk-reward ratios in 2025 trading data.
Below the Head: More conservative traders might place stops below the head formation’s lowest point. While this widens the stop-loss distance, it virtually eliminates premature stop-outs from normal volatility.
Percentage-Based: Use a fixed percentage stop (e.g., 3-5% below entry) regardless of pattern structure. This standardises risk across all trades and simplifies position sizing calculations.
According to risk management studies conducted in 2025, traders who consistently applied stop-losses on inverse head and shoulders trades preserved capital more effectively, with average portfolio drawdowns 67% smaller than traders who traded without stops.
Profit-Taking Approaches
Measured Move Target: As discussed earlier, calculate the vertical distance from head to neckline and project upward from the breakout point. Consider taking 50-70% of your position off at this profit target.
Trailing Stops: After reaching the initial profit target, implement a trailing stop to protect gains while allowing the bullish trend to continue developing. A 10-15% trailing stop balances profit protection with trend participation.
Technical Level Scaling: Take partial profits at the measured move target, then at subsequent resistance levels, finally exiting remaining positions if the price reaches extreme overbought conditions or shows signs of exhaustion.
Common Mistakes and How to Avoid Them
Even experienced traders make errors when trading the inverse head and shoulders pattern. Understanding these common mistakes helps improve informed trading decisions:
Premature Pattern Identification
Mistake: Identifying the pattern before the right shoulder completes, leading to premature entries during what remains a downward trend.
Solution: Exercise patience. The shoulders pattern occurs only when all three components (left shoulder, head, and right shoulder) have formed and the piece approaches the neckline. Avoid anticipating the pattern’s completion.
Ignoring Volume Confirmation
Mistake: Trading breakouts without confirming volume expansion, leading to false breakout trades that quickly reverse.
Solution: Always require high volume on the neckline breakout. Patterns breaking out on low volume have significantly lower success rates—approximately 54% versus 73% for volume-confirmed breakouts, according to 2025 research.
Poor Symmetry Dismissal
Mistake: Forcing patterns that lack reasonable symmetry between left and right shoulders, reducing reliability.
Solution: While perfect symmetry isn’t required, the two shoulders should be relatively comparable in depth and duration. Significant asymmetry suggests the formation may not be a valid inverse head and shoulders chart pattern.
Neglecting Market Context
Mistake: Trading the pattern in isolation without considering broader market sentiment, sector trends, or fundamental catalysts.
Solution: Evaluate the pattern within a larger market context. An inverse head pattern formed during a broader stock market uptrend carries more significance than one formed against the prevailing market direction.
Real-World Examples and Pattern Success Rates
The inverse head and shoulders formation has reliably signalled major market turning points throughout financial history, with 2025 providing numerous examples across various markets.
In January 2025, the S&P 500 Technology Sector ETF (XLK) completed a textbook inverse head and shoulders pattern on the daily chart after forming over six weeks. The pattern’s head reached $195.40, with the neckline at $208.50, providing a calculated profit target of $221.60 (a vertical distance of $13.10). The breakout occurred on February 3rd with volume 156% above the 20-day average. Price reached the target price within 11 trading days, delivering the expected move with remarkable precision.
Similarly, crude oil futures formed a significant inverse head pattern on weekly charts between October 2024 and March 2025. With the head bottoming near $62 per barrel and the neckline at $72, the measured move suggested a target near $82. The breakout signals came in late March 2025 with exceptional volume, and by mid-May, prices had exceeded the profit objective, reaching $85 per barrel.
2025 Pattern Success Rates by Market:
| Market | Success Rate | Average Gain to Target | Average Time to Target |
|---|---|---|---|
| Large Cap Stocks | 74% | 9.2% | 4.3 weeks |
| Small Cap Stocks | 69% | 11.7% | 5.8 weeks |
| Forex Pairs | 71% | 8.4% | 3.9 weeks |
| Commodities | 76% | 12.3% | 6.2 weeks |
| Cryptocurrency | 67% | 15.8% | 2.7 weeks |
These statistics, compiled from over 5,000 pattern observations in the first half of 2025, demonstrate that while the inverse head and shoulders remains highly reliable, success rates vary across asset classes, with commodities showing the highest reliability and cryptocurrencies offering the largest potential gains despite slightly lower reliability.
Comparing Inverse Head and Shoulders with Other Reversal Patterns
Understanding how the inverse head and shoulders compares to other reversal chart patterns helps traders select the most appropriate pattern for their trading style and market conditions.
Double Bottom vs. Inverse Head and Shoulders
Both patterns signal potential trend reversals from bearish to bullish, but the inverse head pattern provides additional information through its three-trough structure. The additional data point (the head) offers better insight into market sentiment shifts and typically produces more reliable signals.
A study from 2025 found that the inverse head and shoulders pattern was successful 73% of the time, while double bottoms had a 65% success rate, but only when both patterns had the right volume confirmation. However, double bottoms form more frequently and complete faster, suiting traders seeking quicker opportunities.
Inverse Head and Shoulders vs. Bearish Reversal Chart Pattern
The standard head-and-shoulder formation serves as the bearish counterpart to the inverse pattern, signalling transitions from bullish to bearish trends. Both patterns follow similar structural rules and offer comparable reliability.
The key distinction lies in their directional bias: the classic head and shoulders signals bearish reversals and downward trends, while the inverse head signals bullish reversals and upward momentum. Traders should be proficient in recognising both formations to capture opportunities in both market directions.
Advantages of the Inverse Head and Shoulders Pattern
- Provides a clear, objective profit target through measured move calculation
- Offers multiple entry point opportunities (breakout, throwback)
- Works effectively across various timeframes and asset classes
- Delivers defined risk management parameters through structural stop-loss placements
- Combines easily with additional technical indicators for enhanced confirmation
Advanced Pattern Variations and Complex Formations
While the classic inverse head and shoulders pattern follows the structure described above, traders encounter variations that require recognition and adjusted approaches.
Sloping Necklines
Rather than forming horizontally, necklines sometimes slope upward or downward. Upward-sloping necklines generally signal stronger bullish momentum, as each subsequent peak reaches higher levels. These formations tend to produce more powerful moves after the breakout point, with 2025 data showing average gains of 11.2% versus 8.1% for horizontal necklines.
Downward-sloping necklines indicate more persistent bearish pressure and require additional caution. They are still valid patterns, but they have a slightly lower success rate—about 68% compared to 73% for horizontal or upward-sloping variants.
Complex Shoulders
Occasionally, the left or right shoulder formation includes multiple minor peaks rather than a single clean trough. These complex shoulders remain valid provided the general structure holds: the head reaches deeper than both shoulders, and the pattern’s overall symmetry remains reasonable.
Extended Patterns
Some inverse head and shoulders formations develop over extended periods, with the pattern taking months or even years to complete on weekly or monthly charts. These longer-term patterns typically signal major market turning points and, when confirmed, lead to substantial multi-year bullish trends.
Integrating the Pattern into a Comprehensive Trading Strategy
The inverse head and shoulders shouldn’t exist as a standalone trading strategy but rather as one component of a comprehensive approach to technical analysis and market engagement.
Successful traders utilising this classic reversal pattern in 2025 typically:
- Combine the shoulders chart pattern with other technical analysis patterns for confluence
- Consider fundamental factors and market sentiment alongside technical signals
- Apply consistent risk management rules across all pattern-based trades
- Maintain a trading journal documenting pattern trades for continuous improvement
- Adjust position sizing based on pattern quality, confirmation strength, and market volatility
- Use VT Markets‘ advanced charting tools to identify and analyze patterns across multiple timeframes
- Remain flexible, recognizing that no pattern guarantees success
The most successful approach treats the inverse head pattern as a probability-based signal rather than a certainty. Even with 73% success rates, approximately one in four patterns will fail to reach their profit targets. This reality underscores the importance of risk management, proper position sizing, and portfolio diversification.
Psychology Behind the Inverse Head and Shoulders Formation
Understanding the market psychology driving this technical analysis pattern enhances pattern recognition and improves timing for entries and exits.
The left shoulder represents the continuation of the prevailing bearish trend, with sellers maintaining control and driving the price to new lows. The subsequent bounce reflects temporary exhaustion due to selling pressure and perhaps some opportunistic buying, but overall market sentiment remains negative.
The head formation captures the final surge of selling pressure—often panic-driven capitulation where the last remaining bulls exit positions. This creates the pattern’s deepest point. However, the subsequent rally from the head suggests that buyers are becoming more aggressive, absorbing the sale at higher prices than the head’s low.
By the time the right shoulder forms, the market dynamics have shifted significantly. Price declines fail to reach the head’s depth, demonstrating that selling pressure has weakened substantially. The right shoulder’s failure to make new lows is particularly significant—it represents a higher low, a foundational concept in bullish trend development.
The breakout through the neckline represents the final psychological shift where buyers overwhelm remaining sellers, transforming previous resistance into support and initiating the upward trend. The expansion in volume at this point reflects broad participation in the new bullish momentum, increasing the probability that the trend reversal will prove sustainable.
Tools and Resources for Pattern Recognition
Modern traders have access to sophisticated tools for identifying and analysing the inverse head and shoulders chart pattern:
Automated Pattern Recognition Software
Many trading platforms, including those offered by VT Markets, now incorporate automated pattern recognition algorithms that scan price charts for inverse head and shoulders formations across multiple securities and timeframes. While helpful for initial screening, traders should manually verify any automatically identified patterns to ensure they meet quality standards.
Backtesting Platforms
Backtesting software allows traders to test their specific trading strategy for the inverse head pattern against historical data, determining success rates, average profits, and optimal stop-loss placements for their particular approach. This empirical testing helps refine strategies before risking real capital.
Real-Time Scanning Tools
Real-time scanners alert traders when securities are forming potential inverse head patterns or when existing formations break through their necklines. These alerts ensure traders don’t miss opportunities across the vast universe of tradable securities.
Charting Software with Pattern Drawing Tools
Advanced charting packages include pattern drawing tools that help visualise the inverse head and shoulders formation, calculate profit targets automatically, and display volume profiles alongside price action. These visualisation aids support better pattern recognition and analysis.
Frequently Asked Questions
What is the success rate of the inverse head and shoulders pattern?
According to comprehensive 2025 research analysing over 5,000 pattern formations across multiple asset classes, the inverse head and shoulders pattern achieves an overall success rate of approximately 73% when proper confirmation criteria are met—including volume expansion on the neckline breakout and reasonable symmetry between left and right shoulders. Success rates vary by asset class, with commodities showing the highest reliability at 76% and cryptocurrencies the lowest at 67%. Patterns identified on longer timeframes (weekly and monthly charts) demonstrate higher success rates, often exceeding 78%, compared to patterns on intraday charts, which average around 61% success rates.
How do you calculate the profit target for an inverse head and shoulders pattern?
The profit target for an inverse head and shoulders formation is calculated using a measured move approach. First, measure the vertical distance from the head’s lowest point to the neckline. This distance represents the pattern’s height. Next, add this vertical distance to the price level where the breakout occurs (the breakout point on the neckline). The resulting price level serves as your initial profit target. For example, if the head bottoms at $50, the neckline sits at $60 (a vertical distance of $10), and the breakout occurs at $60, your calculated profit target would be $70 ($60 + $10). Many traders take partial profits at this measured move target while allowing remaining positions to run, potentially trailing stops to capture extended moves if upward momentum continues beyond the initial price objective.
What’s the difference between an inverse head and shoulders and a regular head and shoulders pattern?
The primary difference between these two chart patterns lies in their directional bias and what trend reversal they signal. The regular head and shoulders formation appears at the end of upward trends and signals a bearish reversal—a shift from bullish to bearish market conditions. It consists of three peaks, with the middle peak (head) reaching higher than the two shoulders, and the neckline acts as a support line that, when broken downward, confirms the bearish trend. Conversely, the inverse head and shoulders pattern appears at the end of downward trends and signals a bullish reversal—a transition from bearish to bullish conditions. It features three troughs, with the middle trough (head) reaching lower than the two shoulders, and the neckline functions as a resistance line that, when broken upward, confirms the bullish trend reversal. Both patterns require similar confirmation through volume analysis and offer calculated profit targets through measured moves.
Can the inverse head and shoulders pattern fail, and how do you protect against losses?
Yes, like all technical analysis patterns, the inverse head and shoulders can fail. Even with proper confirmation, approximately 27% of these formations don’t reach their calculated profit targets based on 2025 data. Failures typically occur when the breakout proves false and price falls back below the neckline, or when upward momentum stalls before reaching the profit target. Protecting against losses requires disciplined risk management:
(1) Always use stop-loss orders, typically placed just below the right shoulder or, more conservatively, below the head formation;
(2) Wait for proper confirmation before entering—specifically a clean neckline break with volume expansion;
(3) Consider position sizing that limits risk to 1-2% of trading capital per trade;
(4) Verify the pattern with additional technical indicators like RSI, MACD, or moving averages;
(5) Avoid forcing patterns—only trade high-quality formations with clear symmetry between shoulders and a distinct three-trough structure.
Additionally, understanding broader market sentiment and conditions improves context for pattern reliability, as formations developing against the prevailing market trend face higher failure risk.
Mastering the Inverse Head and Shoulders for Trading Success
The inverse head and shoulders is one of the most dependable and well-known patterns in technical analysis, giving traders a clear way to spot possible changes from a downward trend to an upward trend. Its clear visual structure, objective profit target calculation through measured moves, and defined risk management parameters make it particularly valuable for both developing and experienced traders.
Success with this shoulders chart pattern requires more than simple pattern recognition. Traders must understand the underlying market psychology driving each component—from the left shoulder formation through the head’s capitulation low to the right shoulder’s higher low that signals weakening selling pressure. Volume confirmation, especially a big increase in volume at the neckline breakout, makes the pattern much more reliable and should be seen as a requirement, not an option.
The integration of additional technical indicators—RSI for divergence confirmation, MACD for momentum verification, and moving averages for trend context—transforms a favourable pattern into an excellent high-probability trading opportunity. Data from 2025 consistently demonstrates that patterns supported by multiple confirmatory factors achieve success rates 15–20 percentage points higher than those traded on price structure alone.
Most importantly, traders must approach the inverse head pattern with realistic expectations and proper risk management. No pattern guarantees success, and even the most perfectly formed shoulders with exceptional volume confirmation can fail. Disciplined stop-loss placement, appropriate position sizing, and the wisdom to walk away from marginal or forced patterns separate consistently profitable traders from those who struggle.
As markets evolve and technology advances, the fundamental principles underlying the inverse head and shoulders remain constant. The pattern helps traders see when the market is changing from a downward trend to an upward trend, making it important for those trading in financial markets. By mastering this classic reversal pattern and integrating it into a comprehensive trading strategy, traders position themselves to capitalise on significant market turns while managing risk effectively.


