



INDEXDJX: .DJI is the ticker Google Finance uses for the Dow Jones Industrial Average (DJIA) — a price-weighted index of 30 large US blue-chip companies, launched in 1896 and maintained by S&P Dow Jones Indices. “INDEXDJX” identifies the Dow data feed and “.DJI” is the index code. You can’t buy the index directly: long-term investors use a Dow-tracking ETF such as DIA, while traders take shorter-term positions using index CFDs (often labelled US30).
What does INDEXDJX: .DJI mean?
INDEXDJX: .DJI is Google Finance’s ticker for the Dow Jones Industrial Average. “INDEXDJX” is Google’s source tag for the S&P Dow Jones Indices data feed and “.DJI” is the index code. The same index appears under different symbols depending on the platform — they all refer to the identical 30-company Dow.
| Platform / context | Symbol you’ll see |
| Google Finance | INDEXDJX: .DJI |
| Yahoo Finance | ^DJI |
| Brokerage platforms | $DJI, $INDU |
| CFD / spread trading | US30, Wall Street 30, DJ30 |
What is the Dow Jones Industrial Average?
The Dow Jones Industrial Average (DJIA) is a stock market index that tracks 30 large, publicly traded US blue-chip companies. First published on 26 May 1896 by Charles Dow and Edward Jones at an initial value of 40.94 points, it is one of the oldest and most-watched barometers of the US market. Unlike the market-cap-weighted S&P 500 and Nasdaq, the Dow is price-weighted, so a higher-priced share moves the index more than a larger company with a lower price.
The index spans technology, financial services, healthcare, industrial and consumer sectors and deliberately excludes transport and utility companies — which have their own dedicated Dow Jones Transportation Average and Dow Jones Utility Average. It is calculated and maintained by S&P Dow Jones Indices.

Key Statistics for 2026:
- Market data changes continuously. Figures below are provided as a reference and may vary depending on the latest market conditions.
- Current level: Around 52,700–52,900 points as of 21 August 2026
- Milestone: Closed above 50,000 for the first time on 6 February 2026 and reached a record high of 54,744.33 on 5 August 2026
- 52-week range: Approximately 44,579 to 54,744 points
- Year-to-date performance: Up roughly 16–17%
- Combined market capitalisation: The 30 constituents represent more than $23 trillion in total market value, led by mega-cap companies such as Apple, Microsoft, Amazon and NVIDIA
How is the Dow Jones calculated?
The Dow is price-weighted: its value equals the sum of its 30 members’ share prices divided by the Dow Divisor. A company’s influence depends on its share price, not its market value — the key contrast with the market-cap-weighted S&P 500. S&P Dow Jones Indices adjusts the divisor for stock splits, spin-offs and constituent changes so those events don’t artificially distort the index.
- DJIA = (sum of the 30 member share prices) ÷ Dow Divisor
As of 29 June 2026, the Dow Divisor is 0.16824816528350. Because the divisor is below 1, a $1 move in any single constituent creates a larger movement in the index, shifting the Dow by about 5.94 points (1 ÷ 0.16825). Because the divisor changes with corporate actions, such as the June 2026 Alphabet replacing Verizon as a Dow constituent and the Honeywell spin-off, traders should always check S&P Dow Jones Indices or their broker for the latest figure rather than relying on a fixed value.
Who decides which companies are in the Dow?
Constituent selection is made by the S&P Dow Jones Indices Averages Committee, which reviews membership on no fixed schedule and changes it only when a company merges, is no longer representative of its sector, or better reflects the modern US economy. There are no rigid quantitative inclusion rules; the committee weighs reputation, sustained growth and sector balance.
Correction applied: earlier drafts stated the Wall Street Journal’s editors select components. Selection is made by the S&P Dow Jones Indices Averages Committee.
Why market cap still matters
Although share price — not market cap — determines index weight, market value shapes the bigger picture. In 2026 constituent market caps range from under $100 billion (e.g. Nike, Sherwin-Williams) to well over $4 trillion (Apple; NVIDIA above $5 trillion) [verify live]. Several of these mega-caps rank outside the top 10 by weight purely because their share prices are modest, so the Dow’s direction can be dominated by a few high-priced components rather than the largest companies overall.
Which companies are in the Dow Jones?
The Dow holds 30 blue-chip companies across technology, finance, healthcare, industrial and consumer sectors. Because it is price-weighted, the members with the highest share prices carry the most weight regardless of market cap. As of August 2026, the largest component is Goldman Sachs (trading above $1,000 per share), followed by Caterpillar and Microsoft [verify live].
Top 10 holdings by index weight (August 2026) [verify live]
| Rank | Company | Symbol | Sector | Approx. weight |
| 1 | Goldman Sachs | GS | Financial Services | ~11.3% |
| 2 | Caterpillar | CAT | Industrial | ~9.2% |
| 3 | Microsoft | MSFT | Technology | ~5.4% |
| 4 | Amgen | AMGN | Healthcare | ~4.9% |
| 5 | UnitedHealth Group | UNH | Healthcare | ~4.3% |
| 6 | Visa | V | Financial Services | ~4.1% |
| 7 | Travelers | TRV | Financial Services | ~4.1% |
| 8 | JPMorgan Chase | JPM | Financial Services | ~4.0% |
| 9 | Sherwin-Williams | SHW | Materials | ~3.9% |
| 10 | Alphabet | GOOGL | Communication Services | ~3.8% |
The remaining constituents include 3M (MMM), Amazon (AMZN), American Express (AXP), Apple (AAPL), Boeing (BA), Chevron (CVX), Cisco (CSCO), Coca-Cola (KO), Disney (DIS), Home Depot (HD), Honeywell (HON), IBM (IBM), Johnson & Johnson (JNJ), McDonald’s (MCD), Merck (MRK), Nike (NKE), NVIDIA (NVDA), Procter & Gamble (PG), Salesforce (CRM) and Walmart (WMT).
Recent changes to the index
- 29 June 2026: Alphabet (GOOGL) added, replacing Verizon Communications (VZ). The same day, Honeywell completed the spin-off of its aerospace division; the parent continues in the Dow under ticker HON.
- 8 November 2024: NVIDIA (NVDA) and Sherwin-Williams (SHW) joined, replacing Intel and Dow Inc.
- 26 February 2024: Amazon (AMZN) joined, replacing Walgreens Boots Alliance.
These moves reflect the committee’s effort to keep the Dow representative of leadership in technology, healthcare and finance rather than its industrial 20th-century roots.

What sectors does the Dow Jones weight most?
Ranked by actual index influence rather than company count, financial services and industrials lead – not technology – because a few high-priced stocks (Goldman Sachs, Caterpillar) dominate the price-weighted calculation. The common assumption that the Dow is “tech-heavy” is misleading: technology contributes the most company names but not the most weight.
2026 sector allocation by index weight
| Sector | Approx. weight | Key companies |
| Financial Services | ~27% | Goldman Sachs, Visa, Travelers, JPMorgan, American Express |
| Technology / Communication Services | ~21% | Microsoft, Apple, Alphabet, NVIDIA, Salesforce, IBM, Cisco |
| Industrial | ~16% | Caterpillar, Honeywell, Boeing, 3M |
| Healthcare | ~14% | Amgen, UnitedHealth, Johnson & Johnson, Merck |
| Consumer Discretionary | ~11% | Home Depot, McDonald’s, Amazon, Disney, Nike |
| Materials | ~4% | Sherwin-Williams |
| Consumer Staples | ~4% | Procter & Gamble, Coca-Cola, Walmart |
| Energy | ~2% | Chevron |
Dow Jones vs S&P 500 vs Nasdaq — what’s the difference?
The Dow tracks 30 companies and is price-weighted; the S&P 500 tracks 500 companies and is market-cap-weighted; the Nasdaq Composite is market-cap-weighted and heavily tech-focused. The S&P 500 is one of the broadest gauges of US large-cap equities, the Dow is a narrower blue-chip barometer, and the Nasdaq is the most growth- and technology-tilted.
| Feature | Dow Jones (DJIA) | S&P 500 | Nasdaq Composite |
| Companies | 30 | 500 | 3,000+ |
| Weighting | Price-weighted | Market-cap-weighted | Market-cap-weighted |
| Launched | 1896 | 1957 | 1971 |
| Best for | Blue-chip snapshot | Broad-market exposure | Tech / growth exposure |
For a related comparison of long-run returns, see how the S&P 500 has performed against gold.
Historical performance and major milestones
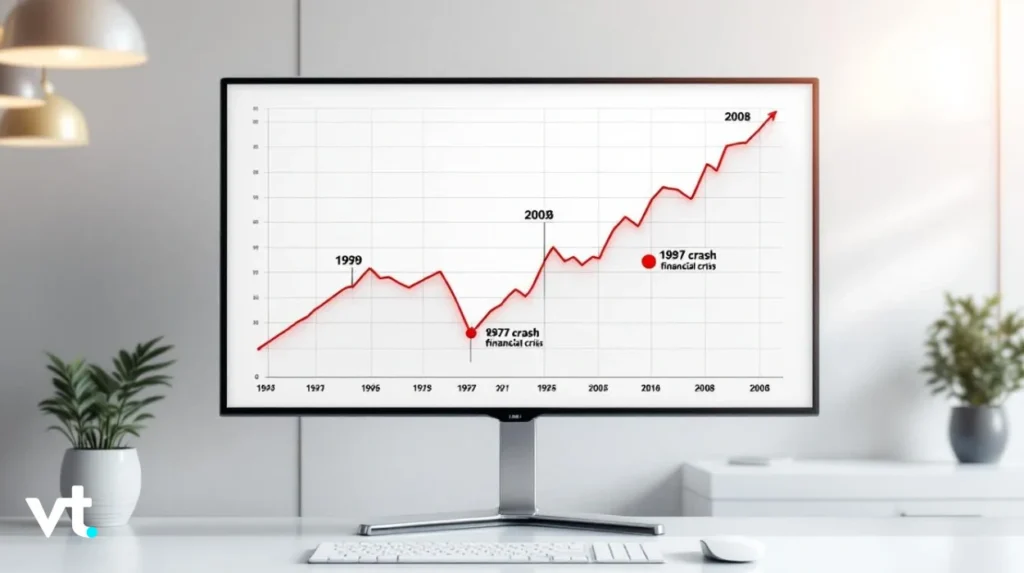
Since its 1896 launch at 40.94 points, the Dow has crossed milestones marking eras of US expansion — first passing 1,000 in 1972, 10,000 in 1999, 40,000 in May 2024 and 50,000 for the first time on 6 February 2026 (closing at 50,115.67). The run from 40,000 to 50,000 took roughly 21 months, among the fastest 10,000-point milestones in its history.
2026 closing milestones (verified against S&P Dow Jones Indices data):
Record close → 54,349.12 on 5 August 2026
- 50,000 → 50,115.67 on 6 February 2026
- 51,000 → 51,032.46 on 29 May 2026
- 52,000 → 52,182.74 on 29 June 2026 (same day as the Alphabet/Verizon swap)
- 53,000 → 53,055.91 on 6 July 2026
- 54,000 → 54,085.88 on 4 August 2026
The index has also weathered major shocks: it lost more than half its value during the 2008 financial crisis, fell sharply at the start of the 2020 pandemic before recovering to new highs, and briefly dipped below 37,000 in April 2025 amid tariff-related uncertainty before climbing to the 2026 highs. Over long horizons its compound annual growth has been roughly 5–7%, though individual years vary widely with the economic cycle.
How to invest in vs. how to trade the Dow Jones
You can’t buy the Dow index directly. Long-term investors gain exposure through a Dow-tracking ETF such as SPDR DIA; shorter-term traders take long or short positions using index CFDs (labelled US30) or futures, without owning the 30 underlying shares.
How to invest in the Dow (longer-term)
The best-known vehicle is the SPDR Dow Jones Industrial Average ETF Trust (DIA), launched in January 1998. It holds all 30 Dow component stocks, pays quarterly dividends and carries an expense ratio of about 0.16%.
| Product | Symbol | Expense ratio | Strategy |
| SPDR Dow Jones Industrial Average ETF | DIA | ~0.16% | 1x long |
| ProShares Ultra Dow30 | DDM | ~0.95% | 2x long (short-term) |
| ProShares UltraShort Dow 30 | DXD | ~0.95% | 2x short (short-term) |
Leveraged and inverse ETFs (DDM, DXD) reset daily and are intended for short-term strategies only; held long term they can diverge sharply from the index. Verify current AUM and expense ratios before publishing.
How to trade the Dow (shorter-term)
To take shorter-term long or short positions on the Dow’s price, traders commonly use index CFDs (often labelled US30 or Wall Street 30). CFDs let you speculate on the index rising or falling without owning the underlying shares. With VT Markets you can trade the US30 index as a CFD across regular, pre-market and after-hours sessions. New to indices? See our guide to how to trade indices. Leverage is offered in tiers that vary by account type and region — check your account specifications for the levels that apply to you.
Risk warning: CFDs are complex, leveraged instruments and carry a high risk of losing money rapidly.
When is the Dow Jones open? Trading hours
The US stock market — and therefore the Dow’s constituent stocks — trades from 9:30 AM to 4:00 PM Eastern Time on weekdays. Extended sessions and index futures give traders access outside those hours.
- Regular hours: 9:30 AM – 4:00 PM ET
- Pre-market: 4:00 AM – 9:30 AM ET
- After-hours: 4:00 PM – 8:00 PM ET
- Weekend: index futures trading available
How to use Dow data in your analysis
Traders and investors use the Dow as both a sentiment gauge and a tradable instrument. Common approaches include watching the 50-day and 200-day moving averages for trend direction, treating round numbers (50,000; 55,000) as psychological support and resistance, and comparing the Dow with the S&P 500 and Nasdaq to read rotation between blue-chip and growth stocks.

Because the index is price-weighted, always check how its highest-priced components are moving — a swing in Goldman Sachs or Caterpillar drives the Dow far more than its economic footprint suggests. The DJIA also correlates positively with GDP growth, employment and corporate earnings, so it doubles as a macro barometer.
What moves the Dow
- Federal Reserve policy: rate decisions and liquidity shifts move the whole index.
- Earnings season: results from top-weighted names (Goldman Sachs, Caterpillar, Microsoft) can move the index disproportionately given its concentration.
- Geopolitics and trade policy: multinationals in the index are sensitive to tariffs and trade shifts, as the April 2025 volatility showed.
- Currency: a stronger dollar pressures overseas earnings; a weaker dollar boosts them when translated back to USD.
- Corporate actions: spin-offs and constituent swaps trigger Dow Divisor adjustments that keep the index continuous.
Frequently asked questions
What makes the Dow Jones different from the S&P 500?
The Dow is price-weighted (higher share prices carry more influence) and holds 30 companies, while the S&P 500 is market-cap-weighted (larger companies by market value carry more influence) and holds 500. The Dow is more concentrated and focused on established blue chips.
How often does the composition of the DJIA change?
Rarely — typically only when a company merges, is no longer representative of its industry, or needs replacing to keep the index current. Changes are decided by the S&P Dow Jones Indices Averages Committee on no fixed schedule. Recent examples include Amazon replacing Walgreens (Feb 2024), NVIDIA and Sherwin-Williams replacing Intel and Dow Inc. (Nov 2024), and Alphabet replacing Verizon (Jun 2026).
Can individual investors invest in the Dow Jones directly?
No — you can’t buy “the Dow” itself. You gain exposure through ETFs such as SPDR DIA, index mutual funds, or by buying all 30 component stocks. ETFs are the easiest, lowest-cost route, while CFDs through brokers such as VT Markets offer leveraged exposure for shorter-term strategies.
Why don’t high-value companies like Berkshire Hathaway appear in the Dow?
Because the index is price-weighted, an extremely high-priced share — Berkshire Hathaway Class A trades well above $500,000 — would completely dominate the calculation. The Dow favours companies whose share prices allow balanced representation, so no single stock overwhelms the index.
When did the Dow Jones first cross 50,000 points?
The DJIA closed above 50,000 for the first time on 6 February 2026, roughly 21 months after first crossing 40,000 in May 2024 — one of the fastest 10,000-point milestones in its 130-year history.
Start Online CFD Trading with VT Markets Today
If you are ready to put your understanding of the Dow Jones Industrial Average to work in live markets, VT Markets provides access to tools and platforms to help you get started. Trade on powerful platforms like MetaTrader 4 (MT4) and MetaTrader 5 (MT5), designed for speed, reliability, and advanced trading features — exactly what you need when the Dow makes fast, high-volatility moves.
New to trading? Practise risk-free with a VT Markets demo account before committing to a live account — ideal for simulating your reactions to Dow Jones volatility, index CFDs like US30, and other markets without financial risk. Open your live account with VT Markets today and access secure, transparent, and competitive CFD trading across some of the world’s most popular markets.








