



Key Points
- The US Dollar Index (USDX) advanced 0.13% on Monday, reaching a new 19-month high as weaker equity markets increased demand for dollar liquidity.
- Hawkish comments from Federal Reserve officials reinforced expectations of an additional rate hike.
- Markets are pricing in a 100% probability of a 25-basis-point rate hike at the December meeting.
- A 3% decline in WTI crude oil prices helped limit dollar gains.
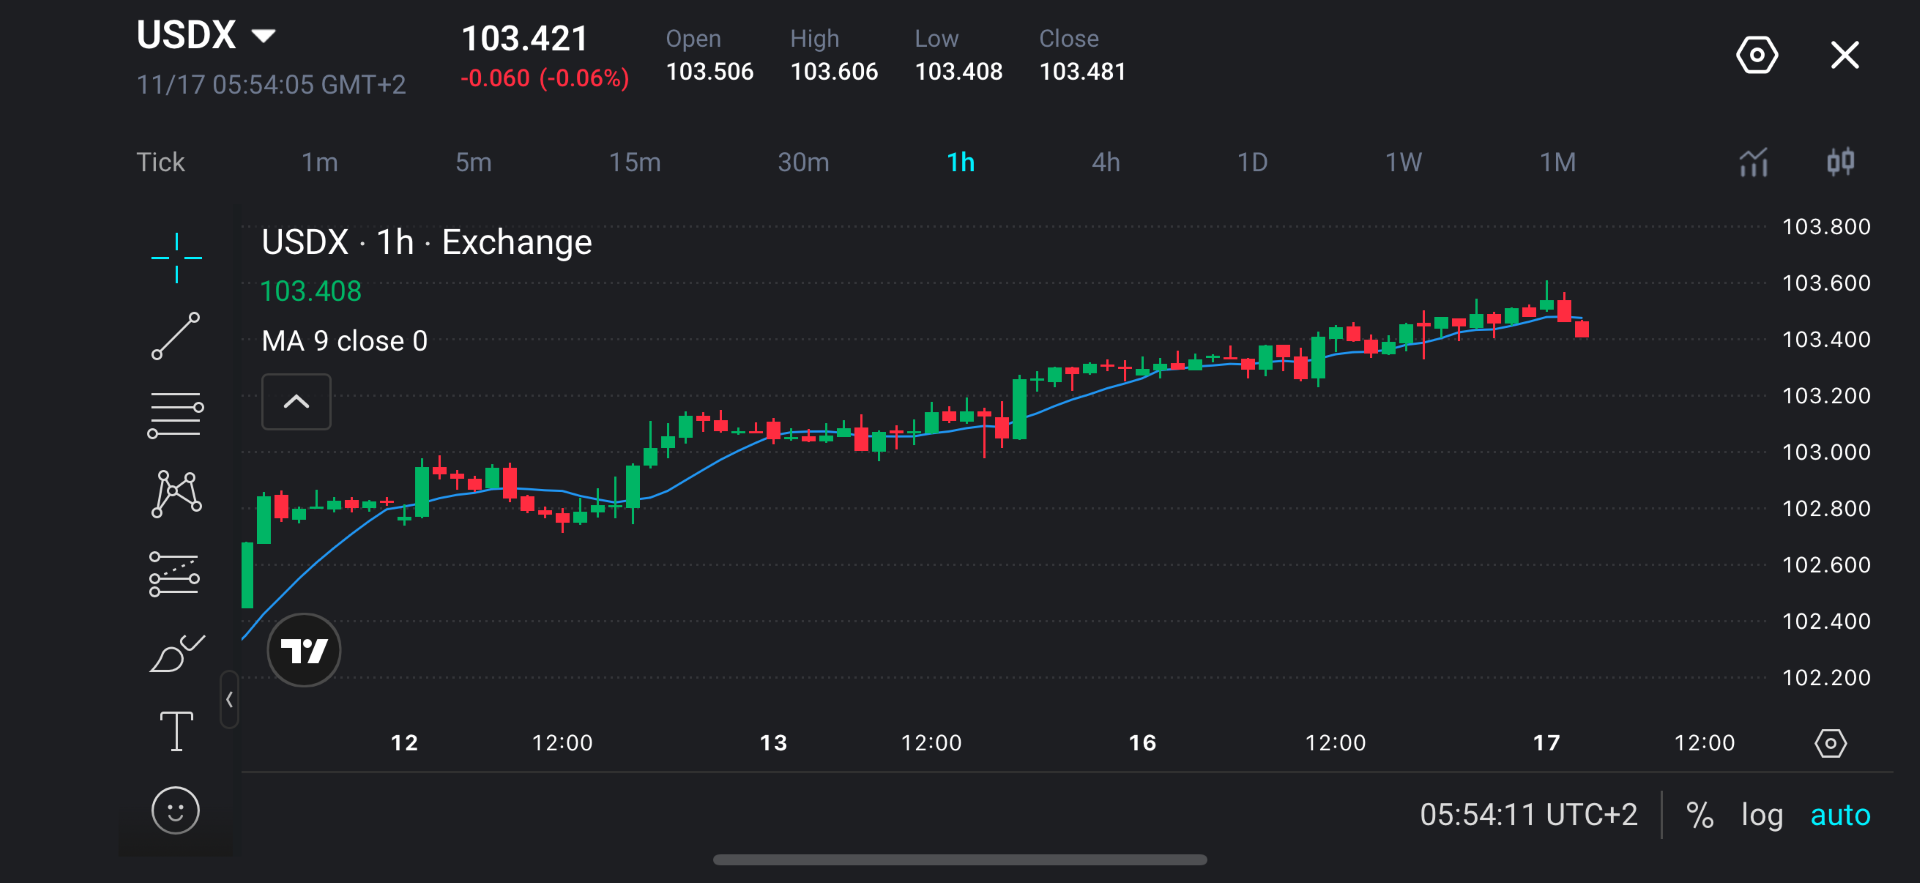
- USDX is trading around 103.42 after approaching 103.60, with traders monitoring whether the index can maintain its upward trend.
Market Move
The US Dollar Index extended its recent winning streak, rising 0.13% to a fresh 19-month high as selling pressure across equity markets increased demand for the US currency.
The index maintained its broader upward trajectory despite mixed US economic signals, reflecting continued dollar strength amid cautious market sentiment.
Why Traders Are Watching
As equities declined, investors sought dollar liquidity, while hawkish Federal Reserve commentary strengthened expectations that US interest rates could rise further. Cleveland Fed President Beth Hammack supported a gradual approach to additional rate increases, favouring measured adjustments to bring inflation back towards the central bank’s 2% target.
Markets are now pricing in a 100% probability of a 25-basis-point rate hike at the Federal Open Market Committee’s 8–9 December meeting. With markets pricing in this expectation, traders are now looking for clues on whether policymakers will signal further tightening beyond December.
Recent economic developments have complicated the outlook. The November Empire State Manufacturing Index fell by 17.7 points to 7.8, below expectations of 18.0, suggesting weaker manufacturing conditions. On the other hand, WTI crude oil prices fell 3%, potentially easing inflationary pressure and reducing the need for more monetary tightening.
Traders are monitoring whether upcoming US economic data supports additional rate hikes or encourages a reassessment of the Fed’s policy path.
Key Trading Levels
| Level | Significance |
| 103.60–103.61 | Immediate resistance near the recent hourly high and potential breakout area. |
| 103.8 | Next psychological resistance if upward momentum strengthens. |
| 103.50–103.55 | Near-term resistance associated with the latest recovery highs. |
| 103.40–103.42 | Immediate support and short-term decision area near the nine-period moving average. |
| 103.30–103.32 | Secondary support around the previous consolidation area. |
| 103.2 | Broader support and potential downside reference if selling pressure increases. |
USDX remains in a short-term uptrend, with 103.50–103.55 acting as near-term resistance following the latest recovery. A sustained break above this area could bring 103.60–103.61 into focus, where the index recently encountered selling pressure. If buyers overcome this resistance, 103.80 could become the next upside target.
On the downside, 103.40–103.42 represents immediate support, sitting near the rising nine-period moving average. Holding above this area would suggest that the current pullback remains a temporary correction within the broader upward trend. However, a break below this zone could expose 103.30–103.32, with 103.20 serving as a deeper support level if selling pressure intensifies.
Though the structure remains bullish, the recent rejection near 103.60 suggests that upward momentum may be slowing, making the index’s ability to defend immediate support important for determining its next move.
Bullish and Bearish Setups
| Scenario | Confirmation | Potential Outlook |
| Bullish | USDX holds above 103.40 and breaks through the 103.50–103.60 resistance area. | The index could extend towards 103.80 if buying momentum strengthens. |
| Bearish | USDX breaks below 103.40 and establishes a sequence of lower highs. | Prices could retreat towards 103.30, with 103.20 becoming the next downside reference. |
A bullish scenario would develop if USDX maintains support around 103.40 and attracts renewed buying interest. A recovery through the recent resistance area would indicate that buyers are regaining control following the latest pullback.
A bearish scenario could develop if USDX fails to maintain its immediate support and moves below the nine-period moving average. Although the broader structure remains bullish, the recent rejection near the highs suggests that short-term profit-taking may be emerging. A break below nearby support, followed by weaker recovery attempts, would indicate that selling pressure is becoming more persistent.
Disclaimer
The price levels and market scenarios above reflect the author’s assessment at the time of writing. They do not represent financial advice or an official recommendation from VT Markets. Traders should conduct their own analysis and manage risk carefully.
USDX Prediction: What’s Next?
Further hawkish commentary from Fed officials, stronger-than-expected economic data and rising Treasury yields could support additional dollar gains. Continued weakness across equity markets may also increase demand for dollar liquidity.
Conversely, weaker manufacturing and consumer spending figures could encourage investors to reconsider the pace of future rate increases. Falling energy prices may further ease inflation concerns, potentially limiting the dollar’s upside.
Attention will now turn to upcoming US retail sales, the FOMC meeting minutes and PCE inflation data for further clues on the Federal Reserve’s policy outlook. Stronger economic activity and persistent inflation could extend the dollar’s rally, while softer figures may encourage profit-taking. The December employment report and FOMC decision will provide further direction on whether monetary tightening could continue into 2027.
Trade USDX with VT Markets
The US Dollar Index provides traders with exposure to movements in the US dollar against a basket of major currencies, reflecting changes in monetary policy expectations, economic conditions and global risk sentiment.
With Federal Reserve policy and Treasury yields influencing currency markets, traders can use technical analysis alongside economic developments to assess potential trading opportunities.
Use VT Markets’ charting tools to monitor support, resistance, moving averages and breakout behaviour as the next USDX setup develops.
Start a live account with VT Markets today.

Frequently Asked Questions (FAQs)
Why is the US Dollar Index rising?
The US Dollar Index has strengthened as expectations of further Federal Reserve rate increases and weaker equity markets have supported demand for the US currency.
Will the Federal Reserve raise interest rates in December?
Markets are pricing in a 100% probability of a 25-basis-point increase at the 8–9 December FOMC meeting. However, the final decision remains dependent on economic conditions and policymakers’ assessments.
Can weaker US economic data push USDX lower?
Yes. Weaker economic indicators could reduce expectations for additional Federal Reserve tightening, potentially weighing on Treasury yields and the dollar.
Does falling crude oil affect the US dollar?
Yes. Lower crude oil prices can ease inflation expectations and reduce pressure for aggressive monetary tightening, although the dollar’s response also depends on broader market sentiment.



