American markets start trading today. Before Asia opened, U.S. equity futures surged. An economic data-packed week will start the year. ADP and the Department of Labor will report nonfarm employment change and first jobless claims during the late American trading session on the fifth. The December U.S. nonfarm payrolls and unemployment rate will be noted on December 6. German and EU CPI for December will be released on December 6, respectively.
In 2022, all three major U.S. market indices performed worst since 2008. Dow Jones Industrial Average dropped 8.8% to 33147.25. S&P 500 fell 19.4% to 3839.5. Nasdaq plummeted 33.1% to 10466.88. Inflation and central bank tightening have caused one of the most volatile equity markets in recent years. Late-cycle economic activity—tight labour markets, increasing inventories, declining profit margins, and most importantly, tighter monetary policy—indicates an even gloomier investment climate for 2023.
Geopolitical conflicts will drive market action in 2023. Since March 2022, the Russia-Ukraine conflict has persisted. The Kremlin has faced unprecedented Western punishment for shelling Kyiv and other Ukrainian cities. The eight-month battle has disrupted supply chains, raising commodity prices, and weakened international relations. A resolution between the two countries will affect Eastern Europe’s economy and the Euro.
Main Pairs Movement
On the very first trading day of 2023, the Dollar index did not make the market surprised with huge floating based on last Friday’s close price. Instead, it failed to start in a positive way to 2023 as the DXY remained under pressure during the early Asian session on Monday near a seven-month low, which was near 103.40 by now.
EURUSD lost some vantages on the first trading day of 2023 due to thin liquidity conditions in the financial markets. It fell around 0.32% and closed at around 1.06640 price level. The release of S&P Global PMIs in the Eurozone on Monday failed to support the shared currency.
GBPUSD extends its daily slide trend, failing to keep price above 1.2050 of the closing price during Monday’s trading course. Amid thin trading conditions on the observed New Year holiday, the pairs’ losses remain limited for the time being.
Gold price settled around 1823.00 on last Friday after failing to surpass the same resistance despite a sell-off in the DXY. The precious metal delivered a gradual upside move from the psychological support of $1,800.00 after sheer pain in the USD Index.
Technical Analysis
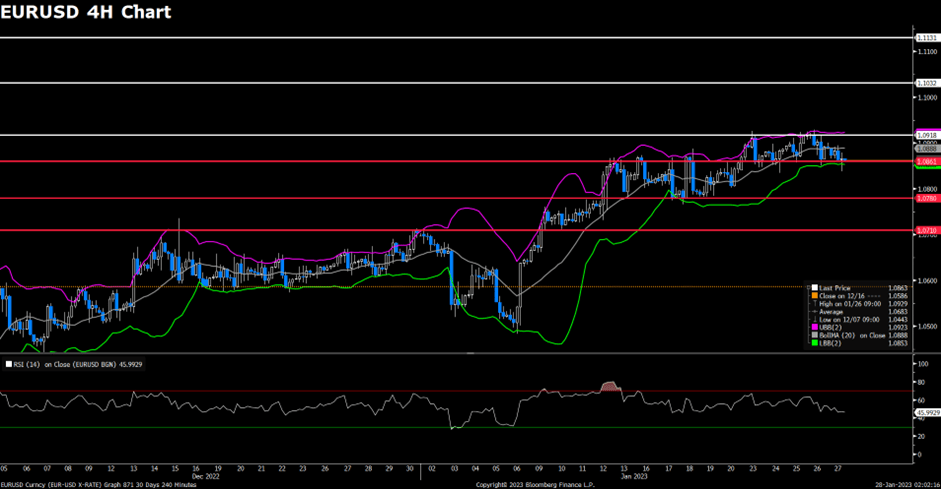
EURUSD (4-Hour Chart)
The EUR/USD pair edged lower on Monday, remaining under bearish pressure and continued to trade in a tight channel below 1.0700 as trading conditions remain thin with major markets remaining closed during the New Year holiday. The pair is now trading at 1.0667, posting a 0.31% loss daily. EUR/USD stays in the negative territory amid holidays in the global markets, despite the downbeat prints of the US data has dragged the US Dollar Index (DXY) to refresh a seven-month low the previous day. On the economic data front, Wednesday’s latest FOMC meeting minutes and Friday’s December month employment numbers for the US will both be crucial for the EUR/USD traders to watch. In the Eurozone, the hawkish comments from ECB President Christine Lagarde failed to support the EUR/USD pair as Germany’s Finance Minister Christian Lindner expects that inflation in Europe’s biggest economy to drop to 7% this year and continue falling in 2024.
For the technical aspect, RSI indicator 51 figures as of writing, suggesting that the pair could experience some downside momentum as the RSI is falling towards 50. As for the Bollinger Bands, the price witnessed fresh selling and dropped to the moving average, therefore the downside traction should persist. In conclusion, we think the market will be bearish as the pair is heading to test the 1.0660 support line. On the upside, the case for recovery will be firmer if the pair extends gains above 1.0710.
Resistance: 1.0710
Support: 1.0660, 1.0584, 1.0467
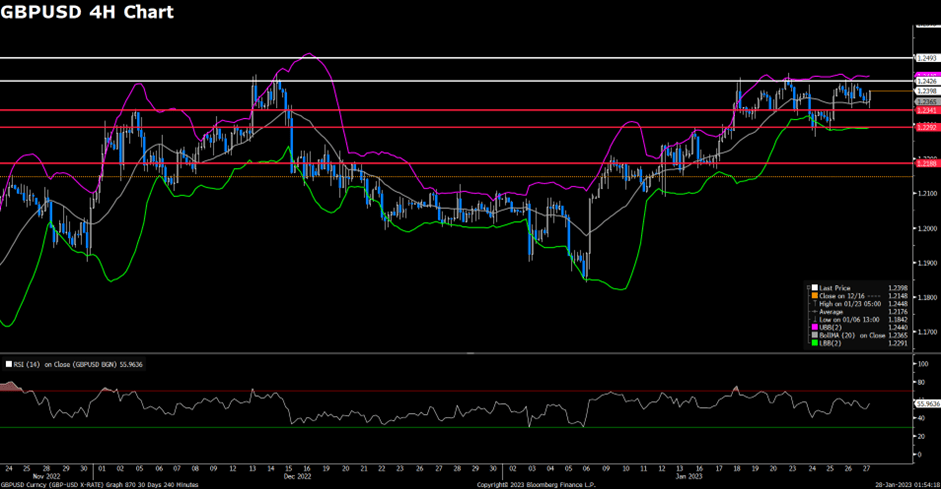
GBPUSD (4-Hour Chart)
The GBP/USD pair declined on Monday, coming under modest bearish pressure and stretched lower to the 1.2050 area amid a cautious market mood on the first trading day of 2023. At the time of writing, the cable stays in negative territory with a 0.36% loss for the day. Investors grow increasingly concerned over the impact of the surging number of coronavirus cases in China on global economic activity as the country stays on the reopening path. For the British pound, British Prime Minister (PM) Rishi Sunak shelved the plans for a major overhaul of the childcare system aimed at saving parents money and helping them return to work. Moreover, British ministers think UK labour unions will run out of money and have to back down but the unions reject the claim. Therefore, the British labour strike and UK PM Sunak’s pushback to childcare reform join geopolitical concerns to exert bearish pressure on the GBP/USD pair.
For the technical aspect, RSI indicator 44 figures as of writing, suggesting the bearish traction will remain in the near-term technical outlook as the RSI stays below the mid-line. As for the Bollinger Bands, the price preserved its downside traction and dropped below the moving average, therefore a continuation of the bearish trend can be expected. In conclusion, we think the market will be bearish as long as the 1.2095 resistance line holds. A four-hour close above that level could open the door for additional gains and favour the bulls.
Resistance: 1.2095, 1.2212, 1.2334
Support: 1.2012, 1.1942
USDCAD (4-Hour Chart)
Despite most markets remaining closed on the observance of the new year’s holiday on Monday, the pair USD/CAD witnessed some upside momentum and climbed to a daily top around the 1.3580 mark in the early US trading session. USD/CAD is trading at 1.3572 at the time of writing, rising 0.23% daily. the lack of US and Canadian economic data keeps traders leaning on market mood and technicals. Investors now shift their focus to the S&P Global Manufacturing PMIs for both countries, with Canada’s PMI expected to drop to 49.2, below the previous month’s reading of 49.6. On top of that, the fears of easing demand, which is mainly due to the Covid fears emanating from China, might limit the upside for the crude oil prices and undermine the commodity-linked loonie. Looking forward, holidays in multiple markets could restrict the USD/CAD intraday moves.
For the technical aspect, RSI indicator 54 figures as of writing, suggesting the pair’s indecisiveness in the near term as the RSI indicator hovers around the mid-line. For the Bollinger Bands, the price regained some upside strength and climbed above the moving average, therefore a continuation of the upside trend could be expected. In conclusion, we think the market will be slightly bullish as long as the 1.3529 support line holds. The rising RSI also reflects bull signals as the oscillator has exited from the bearish territory.