




Key Points
- The Dow gained roughly 3% on 4 November after Democrats won both chambers of Congress.
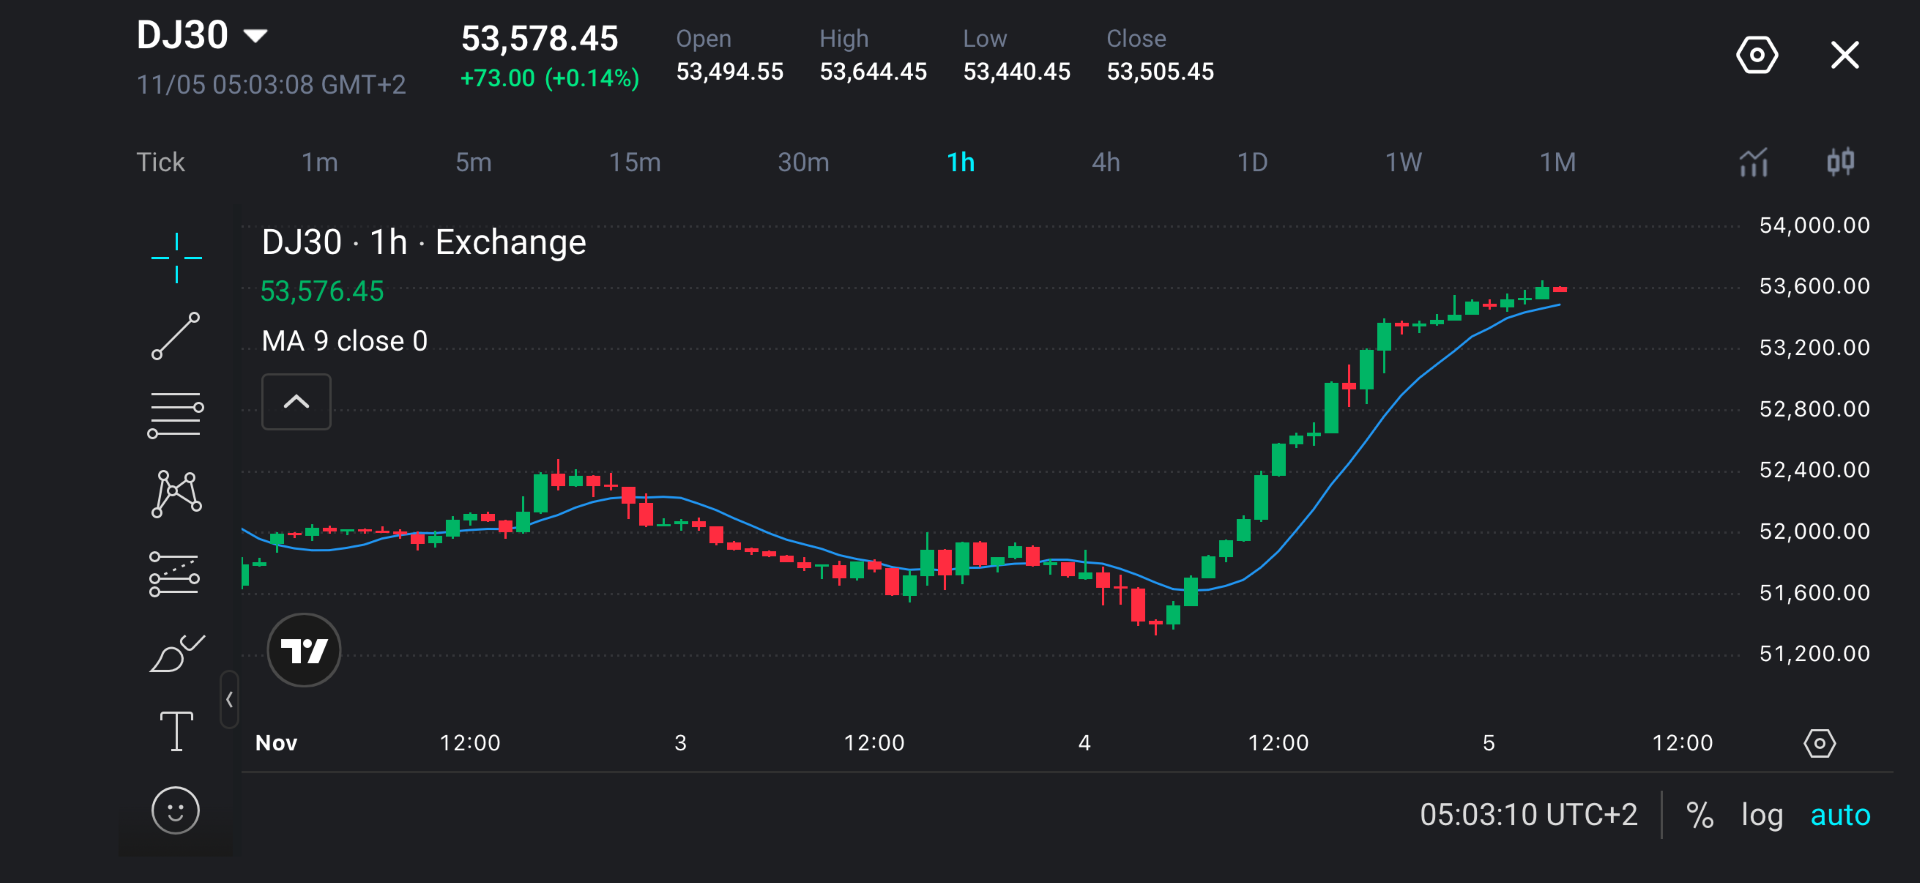
- The latest session shows DJ30 trading near 53,578 on 5 November, following a sharp recovery.
- Immediate resistance sits at 53,600–53,645, with initial support around 53,440–53,500.
- Oil prices, Treasury yields and US economic data could influence whether the rally continues.
Market Move
US stocks rallied on Wednesday, 4 November, after Democrats secured control of the House and Senate, setting up divided government under President Donald Trump. The Dow Jones Industrial Average advanced roughly 3%, or more than 1,500 points, while the S&P 500 gained about 1.6% and the Nasdaq Composite rose around 1.4%.
The latest trading session on 5 November shows DJ30 trading near 53,578, following a sharp recovery from the previous session’s lows. Attention now turns to whether buying can continue after the initial election reaction.
Why Traders Are Watching
Traders are assessing whether a Democratic Congress could limit major policy changes from the White House. Expectations of fewer abrupt policy shifts helped lift stocks on Wednesday, but attention is now turning to how divided government could affect businesses and the broader economy.
Falling oil prices also supported the rally as Treasury yields eased. Falling energy costs could reduce pressure on household spending and corporate margins. However, a decline driven by weaker demand could raise concerns about economic growth.
The election’s implications also vary across industries. Concerns about restrictions on data-centre construction weighed on parts of the artificial intelligence sector, even as other technology shares advanced. Traders will watch whether these policy concerns deepen or buying spreads more across the market.
Alongside political developments, slower growth in US services activity is drawing attention to the economic outlook. ISM and S&P Global data showed that activity continued to expand in October, although businesses faced rising costs. Further cooling could ease inflation pressure, while a sharper slowdown could weaken earnings expectations.
Key Trading Levels
| Level | Role | Significance |
| 54,000 | Upside reference | Psychological level above the current range. |
| 53,800 | Upside reference | Intermediate round-number objective if the recent high breaks. |
| 53,600–53,645 | Immediate resistance | Current consolidation ceiling and displayed high near 53,644. |
| 53,440–53,500 | Initial support | Displayed low near 53,440 and nearby consolidation area. |
| 53,200–53,300 | Secondary support | Earlier pause during the advance. |
| 52,800–53,000 | Deeper support | Area around the earlier acceleration through 53,000. |
| 52,400 | Previous breakout area | Earlier swing-high region cleared during the rally. |
The chart shows price above a rising nine-period moving average, supporting a bullish near-term bias. However, smaller candles around 53,600 suggest momentum has slowed as price approaches resistance.
Holding 53,440–53,500 would preserve the latest consolidation. A sustained break below this area would increase the risk of a retracement towards 53,200–53,300.
Bullish and Bearish Setups
| Scenario | Trigger | Potential Levels |
| Bullish | Sustained break above 53,600–53,645, followed by support holding on a retest. | 53,800, then 54,000 |
| Bearish | Rejection around 53,600–53,645, followed by a sustained break below 53,440 and failure to reclaim it. | 53,200–53,300, then 53,000–52,800 |
The bullish setup would develop if DJ30 breaks above 53,600–53,645 and holds this area as support on a retest. This would suggest buyers have maintained control after clearing resistance, bringing 53,800 into focus, followed by 54,000 if momentum continues.
The bearish setup would develop if DJ30 rejects 53,600–53,645, then breaks below 53,440 and fails to recover that level. This would suggest the rally is losing strength, increasing the risk of a pullback towards 53,200–53,300, followed by 53,000–52,800 if selling pressure persists.
Disclaimer
The price levels and market scenarios above reflect the author’s assessment at the time of writing. They do not represent financial advice or an official recommendation from VT Markets. Traders should conduct their own analysis and manage risk carefully.
DJ30 Prediction: What’s Next?
DJ30 could move higher if softer inflation and a strong economy lowers Treasury yields and supports expectations for a less restrictive Federal Reserve policy. Broader buying across Dow would strengthen the advance.
The next major catalysts for DJ30 are US employment and inflation data. Traders will also monitor post-election policy developments and oil prices to assess whether the relief rally can continue.
- US Non-Farm Payrolls, 6 November: Moderate hiring and softer wage growth could support stocks. Strong wage growth could lift yields, while sharply weaker employment could raise concerns about economic growth.
- US CPI, 10 November: Softer inflation could support DJ30 by easing interest-rate expectations. A hotter reading could push yields higher and pressure equities.
- US PPI, 13 November: Lower producer inflation could ease concerns about business costs, while persistent price pressure could reinforce expectations for restrictive monetary policy.
Trade DJ30 with VT Markets
VT Markets offers DJ30 through index CFDs, allowing traders to take positions on rising or falling prices without owning the underlying shares.
Gain access to global indices alongside forex, commodities, shares and other CFD markets through platforms including MetaTrader 5, Web Trading and the VT Markets App.
With access to market charts, technical indicators and trading tools, traders can monitor DJ30 price movements and assess potential opportunities as market conditions change.
Explore DJ30 and other index CFDs with VT Markets.

Frequently Asked Questions (FAQs)
Why did the Dow rise after the US midterm elections?
Stocks rallied as investors assessed the prospect of divided government and fewer sharp policy shifts following the Democratic congressional sweep.
Where are the key DJ30 support levels?
Initial support sits at 53,440–53,500, followed by 53,200–53,300 and 52,800–53,000.
How could lower oil prices affect DJ30?
Lower energy costs can support consumer spending and margins for some companies. However, energy producers may face pressure, and an oil decline caused by weaker demand could signal economic risks.
What could weaken the current rally?
A loss of support below 53,440, rising Treasury yields, renewed oil-price increases or weaker earnings expectations could put pressure on DJ30.
Does an election rally guarantee further gains?
No. Subsequent performance depends on earnings, economic data, interest rates and policy implementation, alongside price action at key levels.



