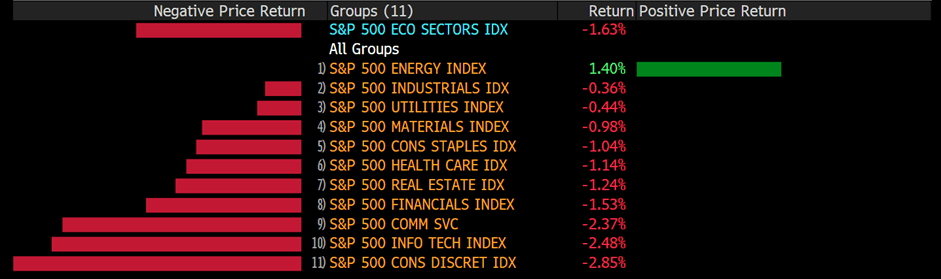
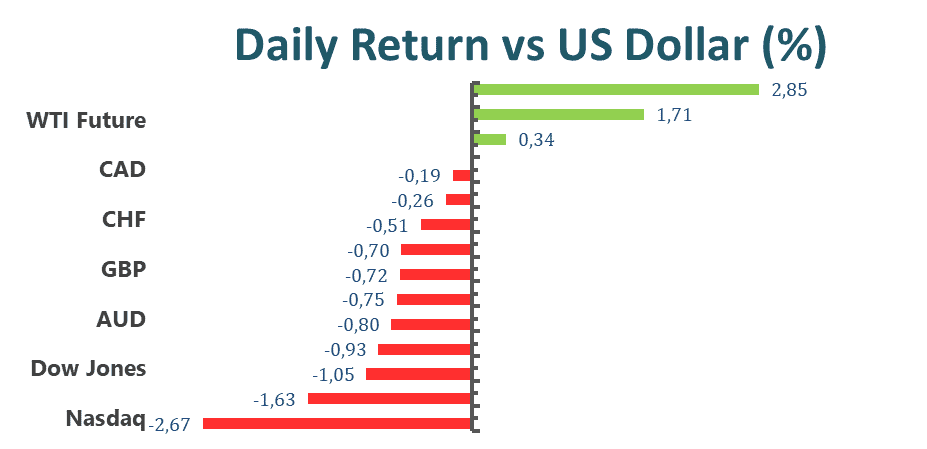
US equities resumed on Friday amid the fears of an economic slowdown and soaring pace of inflation, despite the US economy adding 390,000 jobs in May, better than expected, by 328,000. The Nasdaq Composite slumped 2.67% while the Dow Jones Industrial Averages dropped 1.05%. The S&P 500 declined 1.67% to end the week, tipping the benchmark index into negative territory for the eighth week. The risk sentiment occurred after May hiring economic data. A better-than-expected hiring data suggested that the US labour market remains robust enough for the US Fed to continuously raise interest rates quickly in response to the roaring inflation.
Shares of Tesla fell following the news from Elon Musk that commented on cutting its employment by around 10%. Tesla’s stock price plunged around 20% since the news of acquiring Twitter Inc. At the same time, anxiety about the global market from China also weighed on the company, which has weathered worldwide supply shortages. Tesla has EV factories in the US, Berlin, and China; culling 10% of jobs could equate to losing nearly 10,000 people as Tesla has roughly 100,000 staff worldwide. The move from Tesla could be a caution and a challenge for the economy.
Main Pairs Movement
WTI held near Thursday’s high on Friday despite OPEC+ making a surprising decision, planning to boost output for July and August by 50%, likely a response to US pressure. However, crude oil prices held steadily high as the extra barrels probably still cannot offset Russian supply gaps. Beyond the immediate term, any further spending on OPEC+ spare capacity might suggest an upside for crude oil.
Gold declined nearly 1% on Friday after better- than- expected US labour report. A robust US employment in May suggested that the economy remains to power forward; with that being said, the US Fed has enough reasons to tackle the soaring inflation by raising interest rates.
USD/JPY extended rebound, heading toward 131.00. The Japanese Yen weakened as the Bank of Japan’s Kuroda reiterated his strong support for easing policy with Japan’s PMI came in firmer. At the end of the day, USD/JPY closed at 130.816, reversing the pullback from the three-weeks top.
Technical Analysis
EURUSD (4-Hour Chart)
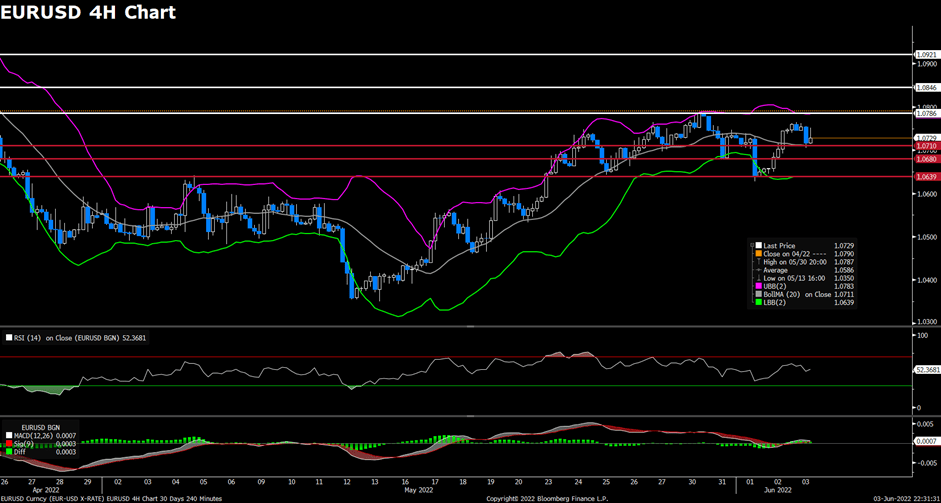
The EUR/USD pair consolidated on Friday, ending its previous rally and retreated from the 1.076 level after the release of the upbeat US Non-farm Payrolls report. The pair were flirting with the 1.074~1.076 area during the first half of the day, then lost its upside traction and dropped to a daily low below the 1.071 level in the late European session. The pair is now trading at 1.0744, posting a 0.01% loss daily. EUR/USD stays in the negative territory amid a stronger US dollar across the board, as the US Non-farm Payrolls rise by 390K in May and beat the market’s expectations of a 325K rise. The better-than-expected job data has provided some support to the greenback and dragged EUR/USD pair lower. For the Euro, the expectations for potential rate hikes by the ECB might limit the losses for the pair, as ECB policymaker Francois Villeroy de Galhau said on Thursday that normalization of the ECB policy is required.
For the technical aspect, the RSI indicator is 53 figures as of writing, suggesting that the upside is more favoured as the RSI stays above the mid-line. As for the Bollinger Bands, the price regained some upside strength after touching the moving average, therefore the upside traction should persist. In conclusion, we think the market will be slightly bullish as long as the 1.071 support line holds. On the downside, a break below the aforementioned support will confirm the bearish shift in the near term.
Resistance: 1.0786, 1.0846, 1.0921
Support: 1.0710, 1.0680, 1.0639
GBPUSD (4-Hour Chart)
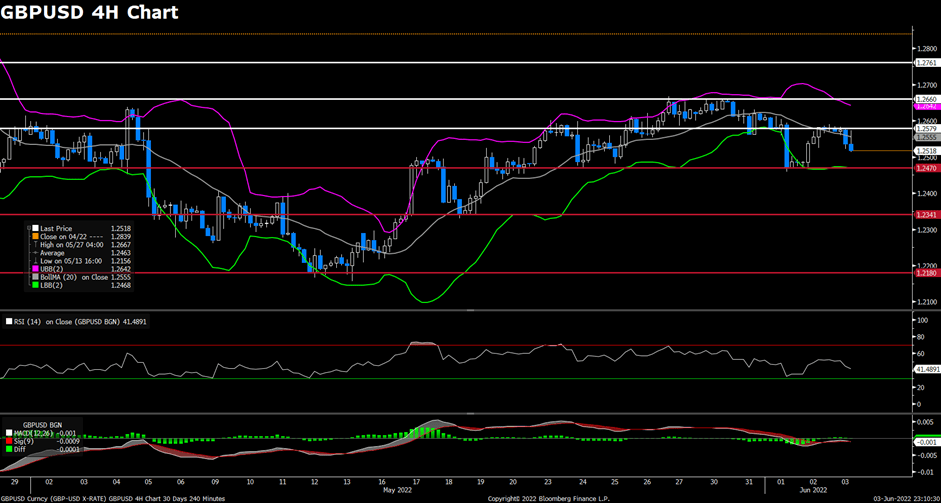
The pair GBP/USD edged lower on Friday, remaining under pressure and extended its daily losses amid holiday-thinned trade and the release of key US jobs data. The pair was trading flat during the Asian session and started to see fresh selling in the mid-European session, then rebounded back slightly to recover some of its intra-day losses. At the time of writing, the cable stays in negative territory with a 0.46% loss for the day. Renewed US dollar strength continued to weigh on GBP/USD pair during the second day of market closures in the UK, as a 390K increase in Nonfarm Payrolls report marked another robust labour market outcome in the US in May. For the British pound, the expectations for the Fed to be far more hawkish than the BoE and the worsening UK economic outlook might continue to exert bearish pressure on the cable. The BOE is expected to continue elevating its interest rates aggressively to contain inflation.
For the technical aspect, the RSI indicator is 41 figures as of writing, suggesting that the pair is surrounded by bearish momentum as the RSI keeps heading south. For the Bollinger Bands, the price preserved its downside traction and cross below the moving average, indicating that a continuation of the downside trend could be expected. In conclusion, we think the market will be bearish as long as the 1.2579 resistance line holds. The falling RSI also reflects bear signals.
Resistance: 1.2579, 1.2660, 1.2761
Support: 1.2470, 1.2341, 1.2180
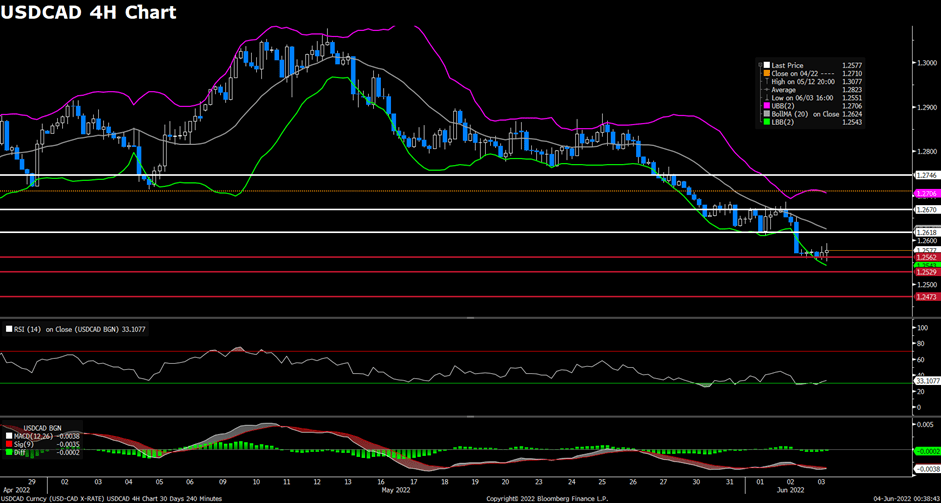
USDCAD (4-Hour Chart)
As the US Nonfarm Payrolls data showed that the US economy added 390K new jobs in May on Friday, the pair USD/CAD attracted some buying and extended its recovery toward the 1.2600 mark. The pair were flirting with the 1.256~1.258 area for most of the day and dropped to a daily low below the 1.2550 level, then rebounded back to erase all of its daily losses. USD/CAD is trading at 1.2576 at the time of writing, rising 0.05% daily. Investors expect that the US Federal Reserve will tighten its policy aggressively after the release of the better-than-expected US NFP report. The upbeat data showed that the US economy was not in a recession in the spring. On top of that, the surging crude oil prices also failed to exert bearish pressure on the USD/CAD pair despite WTI having rebounded back to the $119 per barrel area. OPEC+’s announcement of increasing output quotas by a larger 648K barrel per day seems not to deter the bulls.
For the technical aspect, the RSI indicator is 33 figures as of writing, suggesting that the pair remained under bearish momentum as the RSI stays near the oversold zone. For the Bollinger Bands, the price is struggling to climb higher after rebounding slightly from the lower band, therefore the downside traction should persist. In conclusion, we think the market will be bearish as the pair might head to re-test the 1.2562 support. A break below that support might favour the bears and open the road for additional losses.