U.S. equities markets rebounded on Thursday. The Dow Jones Industrial Average rose 1.33% to close at 33248.28. The S&P 500 gained 1.84% to close at 4176.82. The Nasdaq composite rallied 2.69% to close at 12316.9. Before markets opened, Microsoft warned that revenue and earnings would come in below analyst estimates, thus sending bearing shockwaves throughout markets; however, equities were able to shake off the bearish outlook and end higher by market close. The ADP non-farm payrolls came in at 128,000 for May, missing estimates of 299,000. Market participants will now focus on the unemployment rate and non-farm payrolls both scheduled to release on Friday.
The benchmark U.S. 10 year treasury yield currently sits at 2.919%.
The technology sector has enjoyed multi-weeks of gains as valuations for tech giants have corrected significantly since the start of the year. Despite Microsofts ominous warning yesterday, shares of Nvidia popped 6.9%, Tesla added 4.7%, and Meta rose 5.4% as well. FAANG stocks remain vulnerable to large volatility in the short term, but share prices of these tech giants are pricing in the interest rate hikes for the year and seem to have found demand in the relatively low prices for the past couple of weeks.
Main Pairs Movement
The Dollar index slumped 0.78% throughout Thursday’s trading. The ADP non-farm payroll showed the second straight month of slow down in hiring in the private sector. Growth fears pressured the Dollar against other major foreign currencies.
EURUSD rose 0.94% over the previous trading day. The pair bounded off strongly from the newfound support level at around the 1.064 price region. Broad-based dollar weakness allowed the Euro to gain back losses from the Asia and European trading sessions.
GBPUSD rose 0.73% throughout yesterday’s trading. The cable advanced as the dollar sold off. Britain’s growth concerns, however, continue to pose a threat to Cable’s upside potential.
USDCAD fell 0.69% throughout yesterday’s trading. OPEC’s meeting concluded with the cartel agreeing to raise output and exclude Russia from its trading agreements; however, the meeting sent oil prices soaring. The commodity-linked Canadian Loonie enjoyed a boost as the WTI shot back up to $116 per barrel.
Technical Analysis
EURUSD (4-Hour Chart)
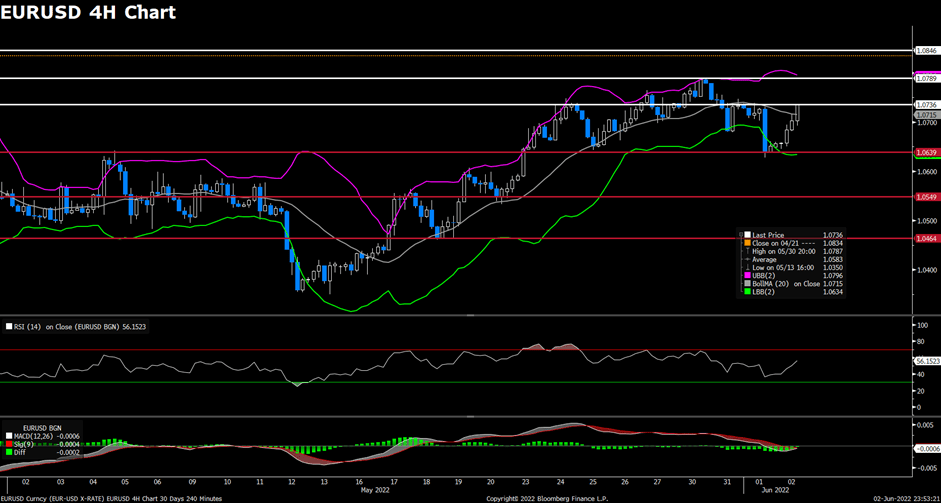
The EUR/USD pair advanced on Thursday, recovering from weekly lows that touched yesterday and managed to hold in positive territory after the release of US job data. The pair were flirting with the 1.064~1.066 area during the first half of the day, then started to witness fresh buying to refresh its daily high heading into the US session. The pair is now trading at 1.0736, posting a 0.84% gain daily. EUR/USD stays in the positive territory amid renewed US dollar weakness, as the worse than anticipated US ADP Nonfarm Employment data exerted bearish pressure on the US dollar. The data showed that private-sector employment rises by 128K in May, which was below expectations for a 300K rise. For the Euro, the hawkish ECB has been a key factor supporting EUR/USD in recent weeks, as investors expect a 50 bps rate hike from the ECB at its July meeting due to hot Eurozone inflation.
For the technical aspect, the RSI indicator is 55 figures as of writing, suggesting that the upside is more favoured as the RSI stays above the mid-line. As for the Bollinger Bands, the price preserved its upside strength and crossed above the moving average, therefore a continuation of the upside trend could be expected. In conclusion, we think the market will be bullish as the pair is heading to test the 1.0736 resistance. A sustained strength above that level will favour the bulls and confirm the bullish shift in the near term.
Resistance: 1.0736, 1.0789, 1.0846
Support: 1.0639, 1.0549, 1.0464
GBPUSD (4-Hour Chart)
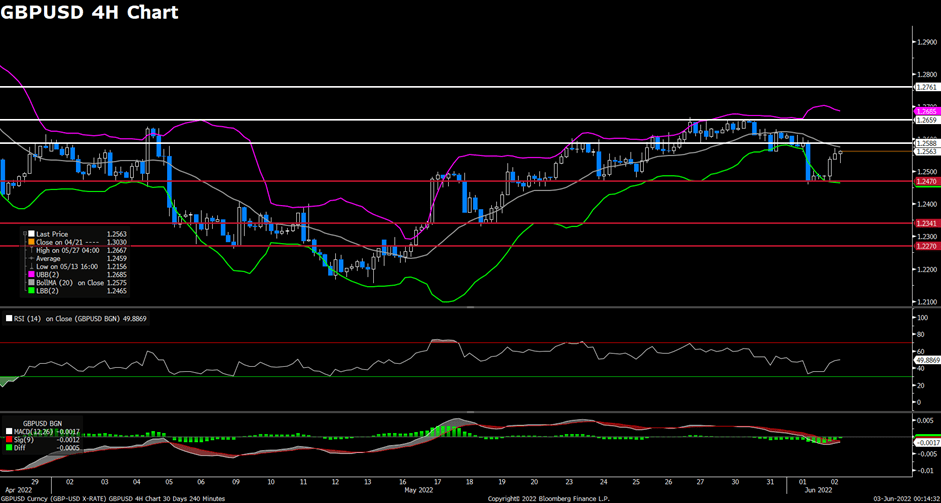
The pair GBP/USD edged higher on Thursday, ending its previous slide and extending its rebound toward the 1.256 area as US yields retreat amid mixed US jobs data today. The pair was trading flat during the Asian session and touched a daily high near the 1.257 level in the European session, then retreated slightly to erase some of its daily gains. At the time of writing, the cable stays in positive territory with a 0.62% gain for the day. Despite the downbeat ADP Employment Change report weighing on the US dollar and pushing the GBP/USD pair higher, the cautious market mood is limiting the cable’s upside for the time being. For the British pound, the worsening UK economic outlook and divergence in Fed/BoE monetary policy will continue to act as a headwind for the cable, as Bank of England Deputy Governor Jon Cunliffe said that the UK economy is expected to slow quite a lot over the next year.
For the technical aspect, the RSI indicator is 48 figures as of writing, suggesting that the pair have a difficult time gathering bullish momentum as the RSI has lost its upward strength within harmful levels. For the Bollinger Bands, the price failed to cross above the moving average, indicating that a trend reversal could be expected for the pair. In conclusion, we think the market will be slightly bearish as long as the 1.2588 resistance line holds. On the downside, GBP/USD could extend its slide toward 1.2341 if the pair breaks below the 1.2470 support and starts using that level as resistance.
Resistance: 1.2588, 1.2659, 1.2761
Support: 1.2470, 1.2341, 1.2270
USDCAD (4-Hour Chart)
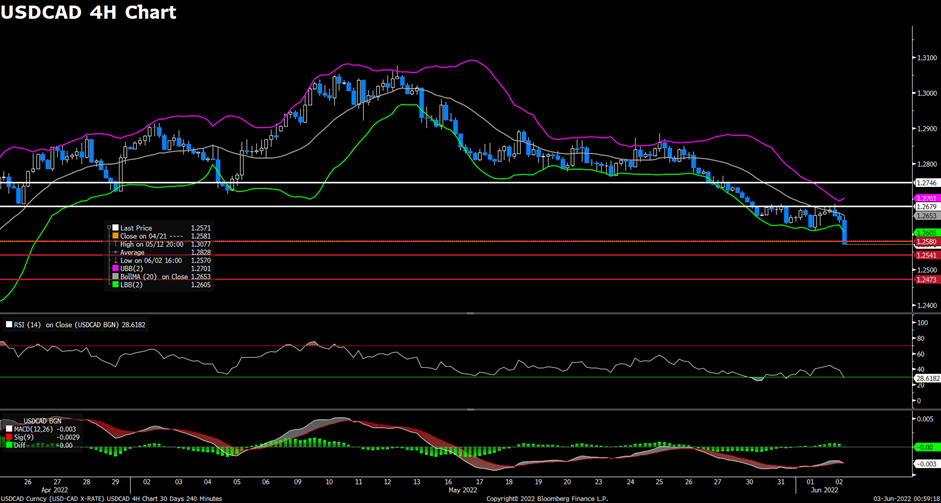
As the US ADP Employment Change for May came in weaker than expected and dragged the US dollar down on Thursday, the pair USD/CAD remained under bearish pressure and meanwhile tumbled to six-week lows under the 1.2600 area. The pair edged higher to a daily high in the late Asian session, but then started to see heavy selling and extended its intra-day losses toward the 1.2580 level. USD/CAD is trading at 1.2571 at the time of writing, losing 0.68% daily. The hawkish comments by Bank of Canada Deputy Governor Paul Beaudry also supported the loonie, as he said that the BoC may need to raise its policy interest rate to 3% or higher. On top of that, the surging crude oil prices also underpinned the commodity-linked loonie and dragged the USD/CAD pair lower as WTI has rebounded back to the $117 per barrel area. The latest news reported that the OPEC+ has agreed to lift output by 648K barrels per day in both July and August.
For the technical aspect, the RSI indicator is 28 figures as of writing, suggesting that the pair faces heavy bearish pressure as the RSI reaches the oversold zone. For the Bollinger Bands, the price moved out of the lower band so a strong downside trend continuation could be expected. In conclusion, we think the market will be bearish as the pair is testing the 1.2580 support. A break below that support might favour the bears and open the road for additional losses.