U.S. stocks fell on the first day of June after JPMorgan Chase President Jamie Dimon warned sharply of the impact of Hurricane Sandy on the U.S. economy. The S&P 500 was down 0.7%, the Dow Jones was down 0.5% and the Nasdaq was down 0.7% on Wednesday.
After rebounding in the trading session, the major stock indexes slipped after solid U.S. manufacturing data and comments from Dimon at an investment conference. According to the Institute for Supply Management, manufacturing in the U.S. grew faster than expected in May, which suggests that the economy may not be as weak as many people believe.
In early March, as the US and its allies unleashed a wave of sanctions on Russia, President Joe Biden stood in the White House and said they wanted to deal a “powerful blow to Putin’s war machine.”
But as the war in Ukraine approaches its 100th day, that machine is still very much operational. Russia is being propelled by a flood of cash that could average $800 million a day this year — and that’s just what the commodity superpower is raking in from oil and gas.
For years, Russia has acted as a vast commodity supermarket selling what an insatiable world has needed: Not just energy, but wheat, nickel, aluminium and palladium too. The invasion of Ukraine has pushed the US and the European Union to rethink this relationship. It’s taking time, though the EU took a further step this week by hammering out a compromise agreement on Russian oil imports.
Main Pairs Movement
The focus remains on inflation and growth, and whether policymakers will continue to tighten monetary policy. On Wednesday, the Bank of Canada raised interest rates by 50 basis points to 1.5%. The policymakers said that they are prepared to take stronger action if needed to achieve the 2% inflation target.
The US ISM Manufacturing Purchasing Managers’ Index rose to 56.1 in May, exceeding expectations. The unexpected spike in activity boosted the dollar and reduced demand for U.S. Treasury. However, yields also rose amid lingering inflation concerns and interest rate hike speculation, with the 10-year U.S. Treasury yield reaching an intraday high of 2.95%.
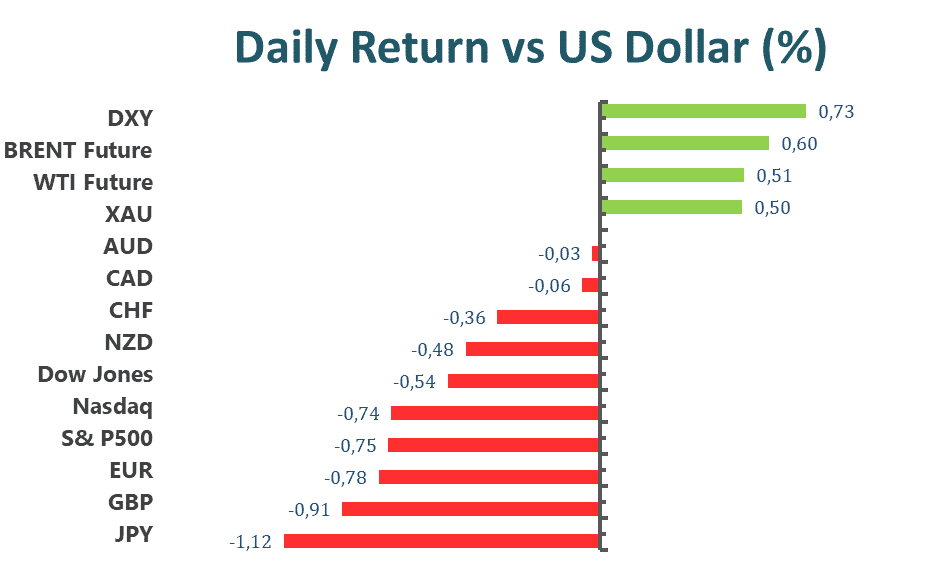
Commodity-linked currencies performed best against the dollar, with AUD/USD holding gains and closing near 0.7190, while USD/CAD hovered at 1.2600 before rebounding to the current 1.2630 price range.
The yen was the worst performer, with USD/JPY surging to around 130.18 in early trading Thursday. EUR/USD was sharply weaker, closing at 1.0650 price area, while GBP/USD closed slightly below 1.2500.
Technical Analysis
EURUSD (4-Hour Chart)
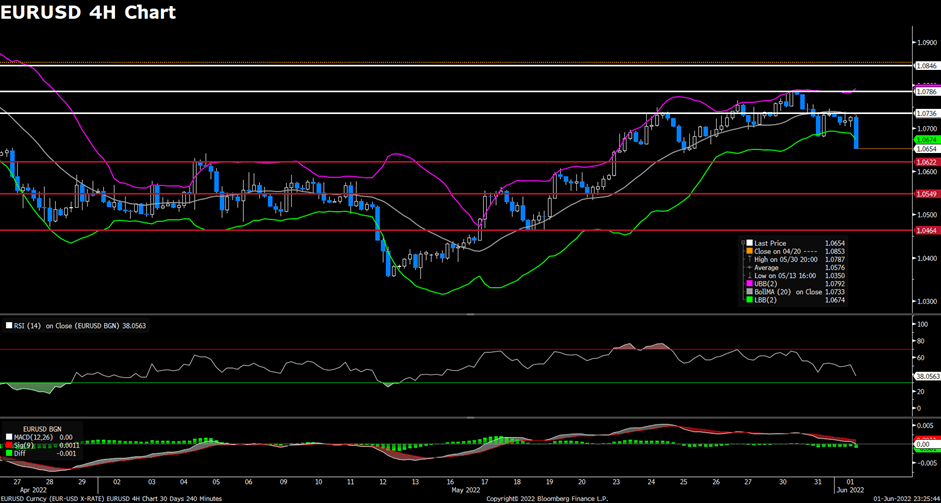
The EUR/USD pair declined on Wednesday, extending its slide that started yesterday and dropped to weekly lows below the 1.066 mark as the US dollar continues to gather strength against its rivals. The pair was trading lower at the open and remained under bearish pressure during the European session, then refreshed its daily lows toward the 1.065 area in the early US trading session. The pair is now trading at 1.0669, posting a 0.59% loss daily. EUR/USD stays in the negative territory amid renewed US dollar strength, as The stronger expected US economic data helped the greenback to find demand. The ISM Manufacturing PMI rose to 56.1 in May, showing that the business activity in the manufacturing sector continued to expand in the US. For the Euro, the ECB Governing Council member Robert Holzmann’s hawkish comments today failed to lift the EUR/USD higher, as he said that a 50 basis points rate hike will be needed due to the record-high inflation.
For the technical aspect, the RSI indicator is 38 figures as of writing, suggesting that the pair is facing heavy bearish pressure as the RSI keeps heading south. As for the Bollinger Bands, the price moved out of the lower band so a strong downside trend continuation could be expected. In conclusion, we think the market will be bearish as the pair is heading to test the 1.0622 support. A break below that support might open the road for near-term losses.
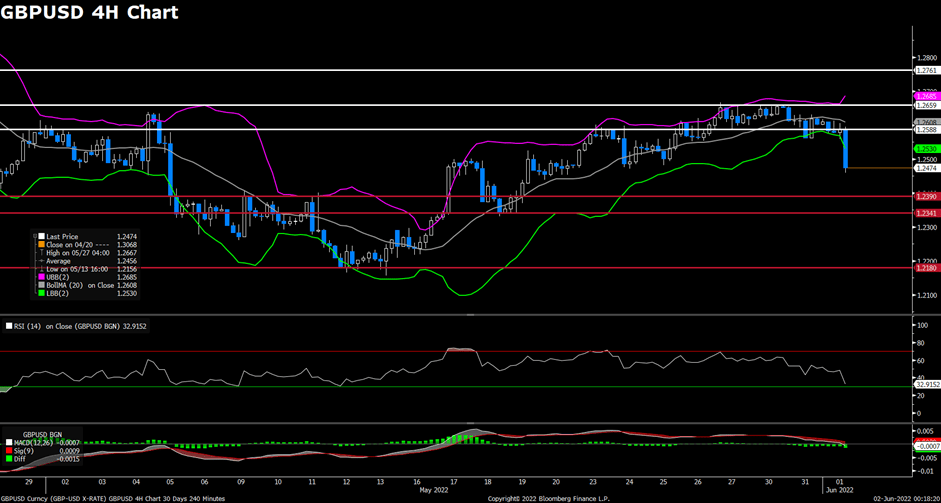
The pair GBP/USD tumbled on Wednesday, being surrounded by heavy bearish momentum and extended its slide toward the 1.2500 area as investors focus on the weakening UK economy. The pair preserved its downside traction during the first half of the day, then dropped to a daily low below the 1.2490 level and extended its intra-day losses. At the time of writing, the cable stays in negative territory with a 0.98% loss for the day. The risk aversion and higher US bond yields have both underpinned the US dollar today, as the US equity market tumbled sharply following the release of an upbeat US ISM Manufacturing PMI data. For the British pound, the worries about the cost of the living crisis remained as the UK Manufacturing PMI data for May showed that manufacturing activity in the UK expanded at its weakest pace rate since January 2021. The widening Fed/BoE policy differentials might also keep acting as a headwind for the cable.
For the technical aspect, the RSI indicator is 32 figures as of writing, suggesting that the downside is preserving strength and the bearish shift in the near-term outlook is confirmed. For the Bollinger Bands, the price moved out of the lower band, indicating that a strong trend continuation could be expected. In conclusion, we think the market will be bearish as long as the 1.2588 resistance line holds. GBP/USD could extend its slide toward 1.2341 if the pair breaks below the 1.2390 support and starts using that level as resistance.
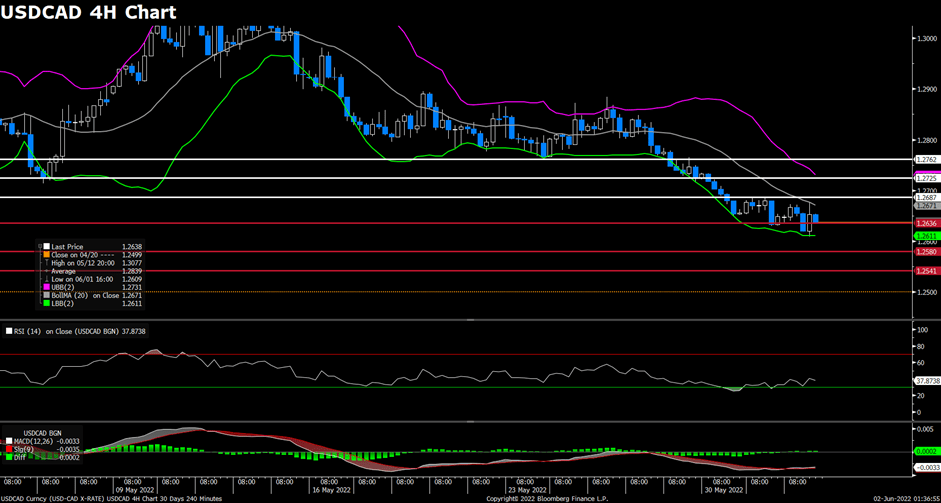
After the Bank of Canada’s decision to hike the overnight rate by 50 bps on Wednesday, the pair USD/CAD regained some upside momentum and recovered toward the 1.2670 area. The pair climbed to a daily high after dropping to daily lows below the 1.262 level in the early US session, but then witnessed fresh selling to erase all of its daily gains. USD/CAD is trading at 1.2637 at the time of writing, losing 0.10% daily. The loonie has been lifted higher by the hawkish BoC, who said that interest rates would need to rise further and they are prepared to act more forcefully if needed to meet its commitment to achieving the 2% inflation target. On top of that, the surging crude oil prices also acted as a tailwind for the commodity-linked loonie and dragged the USD/CAD pair lower as WTI has rebounded back to the $117 per barrel area. The black gold’s near-term outlook remains bullish as North America and Europe head into peak driving season and lockdowns in Shanghai have now ended.
For the technical aspect, the RSI indicator is 37 figures as of writing, suggesting that the downside is more favoured as the RSI stays below the mid-line. For the Bollinger Bands, the price lost its upside strength and dropped toward the lower band, therefore the downside traction should persist. In conclusion, we think the market will be bearish as the pair is testing the 1.2636 support. A four-hour close below that support will favour a downside continuation.