Investors were concerned that the Fed’s aggressive stance on inflation could force the economy into recession, so equities finished higher Friday, recouping some of the week’s more dramatic losses. All major indices ended the day in the green.
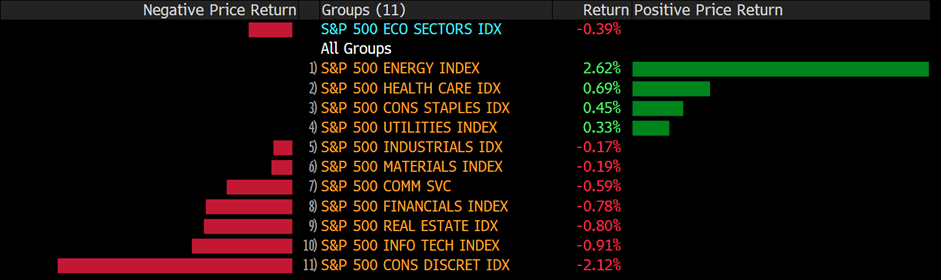
The Dow Jones Industrial Average (DJI) closed at 32,196.66, up 1.5 percent. The S&P 500 index rose 2.4 percent to 4,023.89, reaching bear market territory. The index, on the other hand, had its highest single-day performance since March 4. The top performers were Non-Essential Consumer Discretionary, Energy, and Technology.
The Nasdaq’s 3.8% increase to 11,805 was the largest one-day increase since November 2020. The VIX fell to 28.87 points. The ratio of stocks increasing to stocks falling on the New York Stock Exchange was 3.73:1. The NASDAQ’s 2.91:1 ratio benefited from rising equities. Friday’s volume of 13,32 billion shares was greater than the 20-day average of 13,17 billion shares.
Elon Musk fueled rumors that he may seek to renegotiate his acquisition of Twitter Inc. by stating that a purchase at a lesser price would not be “impossible.”
At the closing of trading in New York, Twitter shares plunged 8.2 percent. The stock has been declining on rumors that Musk may abandon the $43 billion deal. Musk’s questioning of Twitter’s publicly provided data on the number of spam and fraudulent accounts on its social media service has heightened this issue over the past week.
Musk emphasized this point further on Monday at a Miami tech conference, saying that at least 20 percent of Twitter accounts are phony. This was the low end of his estimate for the number of bots on the network, and he wondered rhetorically if it could reach 90 percent, according to a Twitter user’s live video of his remarks. At a recent conference, Musk stated, “I’ve been told that there is currently no method to determine the number of bots.”
Main Pairs Movement
Early in the week, the dollar strengthened, while most of its competitors closed the day with slight losses. European indices were neutral at the closing, while Wall Street managed to get gain. Because of the ongoing tensions with Russia, the bullish potential is restricted. The European Commission revised its projection for negative growth during the Ukraine crisis, with inflation growing higher this year and continuing above the ECB target until 2023 after EU ministers failed to agree on an embargo on Russian oil imports.
Furthermore, Bank of England Governor Andrew Bailey expressed dissatisfaction with the inflation prognosis, claiming that energy and tradable goods were responsible for more than 80% of the UK’s inflation overshoot. Saunders, a Bank of England member, warned that the UK’s exit from the European Union could aggravate inflation.
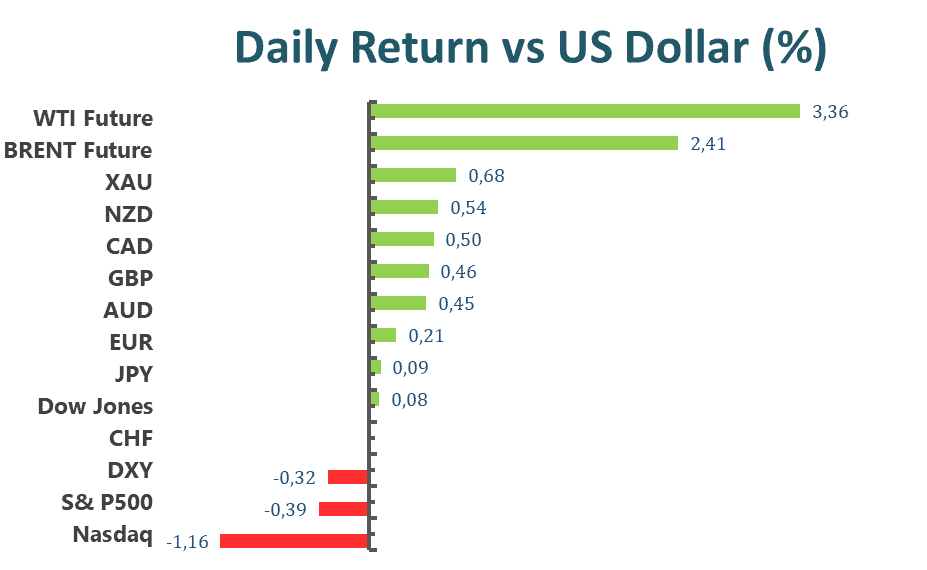
Due to the continued tensions with Russia, the EUR/USD closed around 1.0430 with limited upward potential. GBP/USD changed hands around 1.2310. AUD/USD traded near 0.6960 with the help of gold, which traded above $1,820 per troy ounce. With crude oil prices surging, USD/CAD fell to 1.2646 and WTI is now trading at $111.30 per barrel.
Technical Analysis
EURUSD (4-Hour Chart)
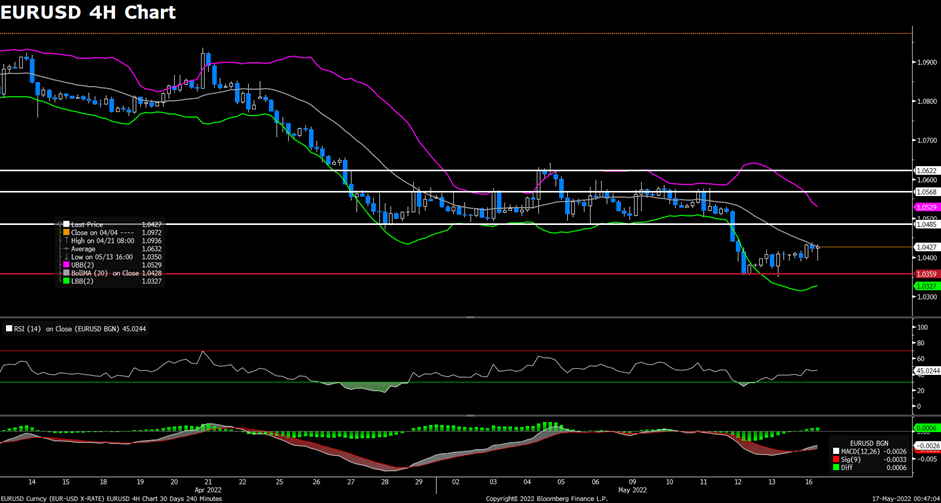
The EUR/USD pair edged higher on Monday, continuing to rebound slightly from its weakest level since early 2017 near the 1.0350 mark. The pair witnessed some upside momentum and touched a daily high above 1.043 level during the European session, then started to see fresh selling and erased some of its daily gains in the US session. The pair is now trading at 1.0417, posting a 0.08% gain daily. EUR/USD stays in the positive territory amid renewed US dollar weakness, as the softer risk tone and falling US Treasury bond yields both exerted bearish pressures on the safe-haven greenback. On the economic data side, the Empire State Manufacturing Index plunged to -11.6 in May, which marked the largest miss on expectations since April 2020. For the Euro, hawkish comments from ECB’s Villeroy provided support to the EUR/USD, as he expected a decisive policy meeting in June and will carefully monitor developments in the effective exchange rate.
For the technical aspect, the RSI indicator is 45 figures as of writing, suggesting that the pair is in a consolidation phase as the RSI lacks directions. As for the Bollinger Bands, the price is climbing towards the moving average, showing that some upside traction could be expected. In conclusion, we think the market will be slightly bullish as long as the 1.0359 support line holds. A break below that level will favor the bears.
Resistance: 1.0485, 1.0568, 1.0622
Support: 1.0359
GBPUSD (4-Hour Chart)
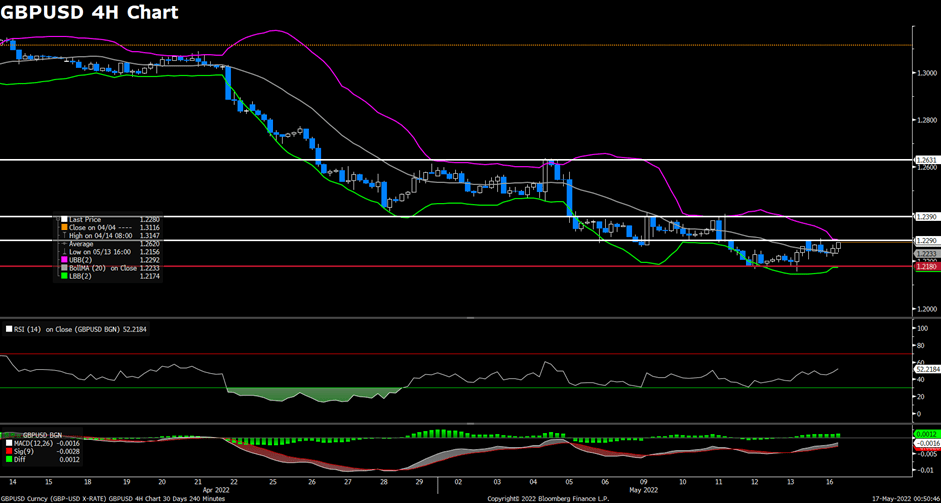
The pair GBP/USD edged higher on Monday, stabilizing in the 1.2250 area, and went into a consolidation phase ahead of a busy week of US/UK economic events. The pair was trading flat for most of the day and dropped to a daily low in the early European session, then regained some upside traction to recover most of its daily losses. At the time of writing, the cable stays in positive territory with a 0.07% gain for the day. The unexpected decline in the US Empire Manufacturing Index undermined the US dollar, as the disappointing data has resulted in heightened calls that the US might be going into a recession. For the British pound, the prospects that the UK economy could go into recession this year and worsening UK economic outlook might keep acting as a headwind for the GBP/USD.
For the technical aspect, the RSI indicator is 52 figures as of writing, suggesting that the upside is more favored as the RSI keeps heading north. For the Bollinger Bands, the price crossed above the moving average and rose towards the upper band, therefore the upside momentum should persist. In conclusion, we think the market will be bullish as the pair is heading to test the 1.2290 resistance level. A four-hour close above that resistance could be taken as a bullish development and open the door for additional profits toward 1.2390.
Resistance: 1.2290, 1.2390, 1.2631
Support: 1.2180
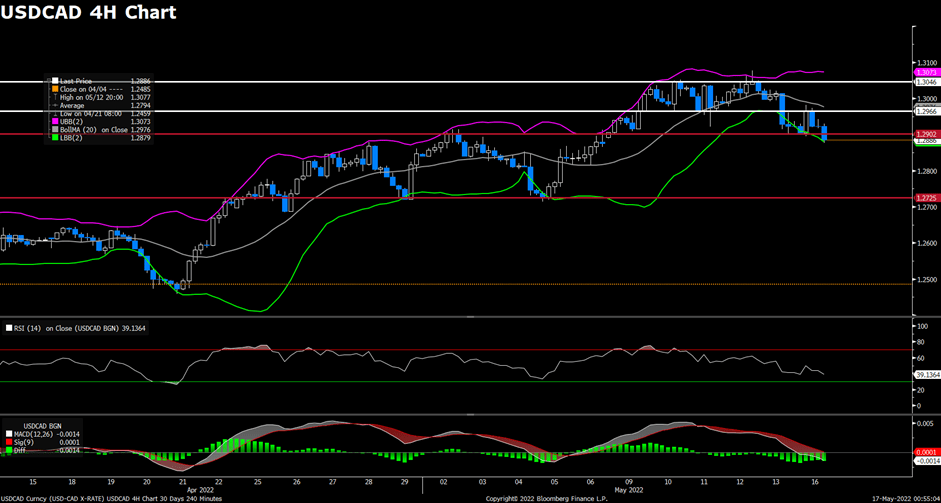
USDCAD (4-Hour Chart)
As the sliding US bond yields weighed on the US dollar on Monday, the pair USD/CAD declined towards the 1.287 mark and extended its slide that started last week. The pair was trading higher and touched a daily top above the 1.297 level during the Asian session, then started to see heavy selling to surrender all of its intra-day losses. USD/CAD is trading at 1.2871 at the time of writing, losing 0.31% daily. The US dollar lost its upside traction due to a weaker tone surrounding the US Treasury bond yields, which also exerted bearish pressure on the USD/CAD pair. On top of that, the surging crude oil prices also underpinned the commodity-linked loonie as WTI extended its rally towards the $114.00per barrel area. The Foreign Ministers from both Germany and Austria said that they expect the EU to agree on a deal on the proposed embargo of Russian oil imports later this week.
For the technical aspect, the RSI indicator is 39 figures as of writing, suggesting that the downside is more favored as the RSI stays below the mid-line. For the Bollinger Bands, the price remained under pressure and dropped to the lower band, therefore a continuation of downside traction can be expected. In conclusion, we think the market will be bearish as the pair is testing the 1.2902 support. The falling RSI also reflects bear signals, but a recovery above 1.2966 should change the outlook to bullish.