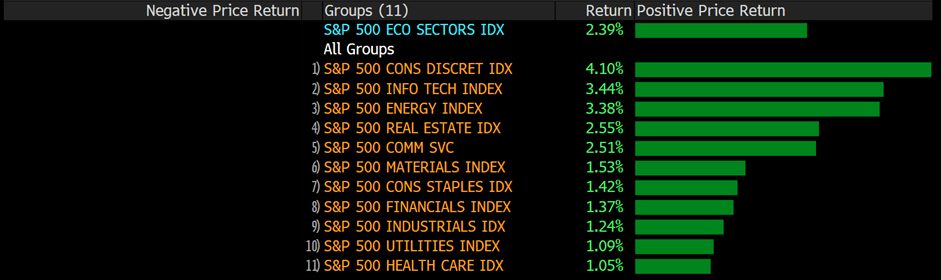
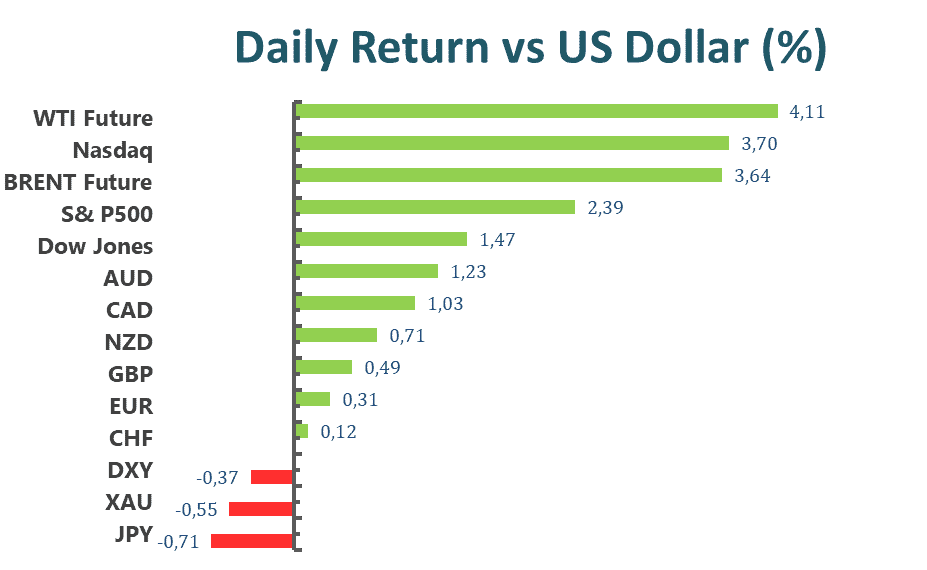
U.S. equity markets rebounded on the last trading day of the week. The Dow Jones Industrial Average rose 1.47% to close at 32196.66. The S&P 500 climbed 2.39% to close at 4023.89. The Nasdaq composite rallied 3.82% to close at 11805. After a week of sell-off, equities are set to recover in the week ahead as “dip buyers” return to the market. The benchmark U.S. 10 year treasury yield has cooled off and is now trading at 2.928%
Cathie Wood’s ARK Innovation ETF popped 11.82% amid a broad technology sector rally. The technology-focused ETF has dropped more than 50% since the beginning of the year and has wiped out most of its gains since 2020. NU Holdings Inc, the cryptocurrency bank, popped 20.5% after the broader cryptocurrency market recovered from the TerraUSD meltdown.
On this week’s economic docket, the UK is set to announce retail sales figures for the month of April on the 17th and CPI data on the 18th. The ECB will announce monetary policy meeting minutes on the 19th and the U.S. will announce initial jobless claims figures on the same day.
Main Pairs Movement
The Dollar Index retreated 0.27% on the last trading day of the week. As the U.S. 10-year treasury yield cooled off so did the U.S. Greenback. With the FOMC meeting scheduled for June 15th, market participants are cherishing a brief period of ease over interest rate fluctuations.
The EURUSD pair rose 0.3% over the course of Friday’s trading. Broad-based weakness of the U.S. Greenback allowed the EURUSD pair to finally find support around the 1.03767 price region.
Cable bounced 0.51% over the course of Friday’s trading. The weaker U.S. Greenback on Friday helped buoy the Pound against the Dollar, despite the U.K.’s gloomy GDP report.
The U.S. Dollar dropped 1.12% against the Canadian Loonie during last Friday’s trading. Commodity prices are again on the rise, thus helping the commodity-linked Canadian currency.
Technical Analysis
EURUSD (4-Hour Chart)
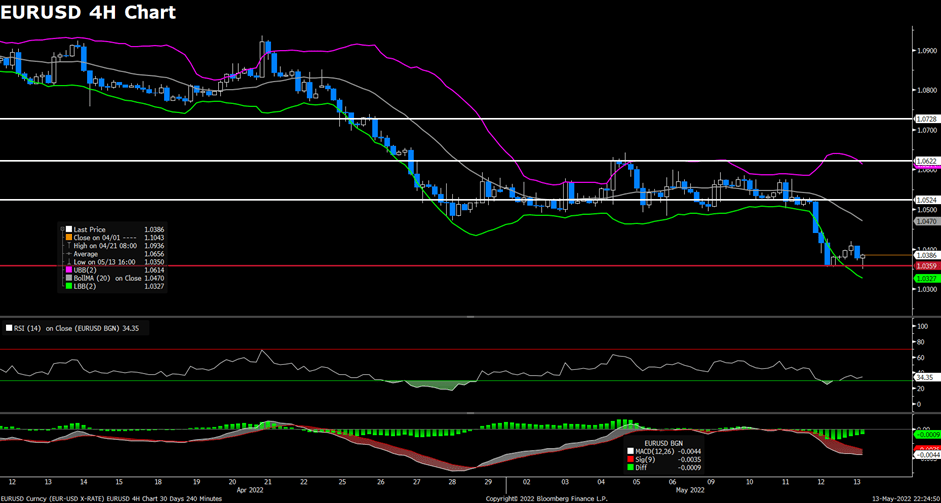
The EUR/USD pair edged lower on Friday, extending its slide and dropping to its weakest level since early 2017 near the 1.0350 level. The pair rebounded slightly towards the 1.042 area during the first half of the day, then started to see fresh selling and surrendered all of its daily gains in the US session. The pair is now trading at 1.0364, posting a 0.05% loss on a daily basis. EUR/USD stays in the negative territory amid renewed US dollar strength, as the rising US Treasury bond yields and the prospects for a more aggressive policy tightening by the Fed have both provided support to the greenback. On the economic data side, the Michigan Consumer Sentiment in May came at 59.1, which fell short of market expectations. For the Euro, the fact that the European Central Bank officials will likely announce a rate hike in July might limit the losses for EUR/USD.
For the technical aspect, the RSI indicator is 32 figures as of writing, suggesting that the pair is facing heavy bearish pressure and the RSI is reaching the oversold zone. As for the Bollinger Bands, the price failed to preserve upside traction and dropped towards the lower band, showing that the downside trend should persist. In conclusion, we think the market will be bearish as the pair is heading to test the 1.0359 support.
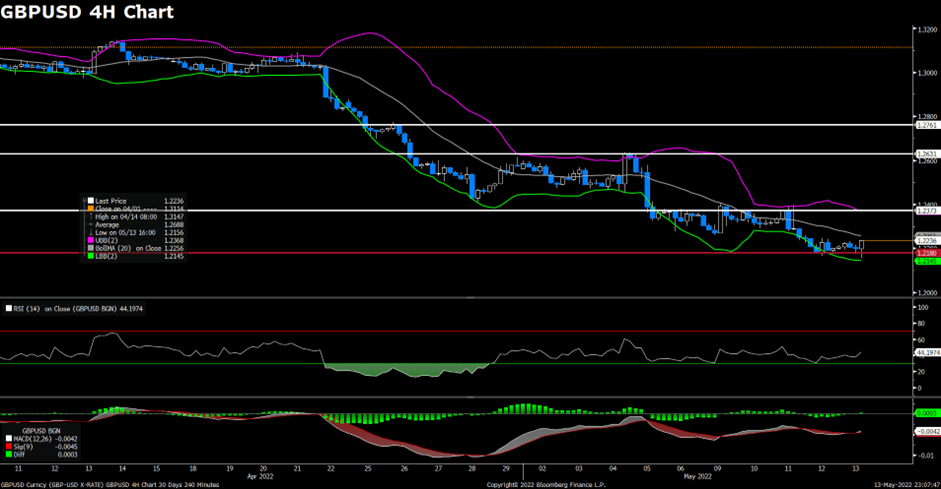
The pair GBP/USD edged higher on Friday, rebounding slightly from fresh two-year lows near the 1.2160 area but still remained under pressure. The pair touched a daily high around 1.2230 level at the start of the European session, then started to witness bearish momentum and dropped towards the 1.2160 mark. At the time of writing, the cable sees some buying and stays in positive territory with a 0.28% gain for the day. The downbeat Consumer Sentiment data exerted some bearish pressure on the US dollar, but the expectations for aggressive policy tightening by the Fed should limit the downside for the greenback. For the British pound, the disappointing UK GDP report released on Thursday and Brexit jitters both acted as a headwind for the GBP/USD, as concerns about UK economic weakness have escalated and resulted in the relatively dovish outlook for BoE’s tightening.
For the technical aspect, the RSI indicator is 35 figures as of writing, suggesting that the downside is more favored as the RSI is reaching the oversold zone. For the Bollinger Bands, the price regained upside traction and rose towards the moving average, therefore some bullish momentum could be expected for the pair. In conclusion, we think the market will be slightly bullish as long as the 1.2180 support line holds. The rising RSI also reflects bull signals. On the downside, a four-hour close below the 1.2180 level could attract sellers and open the door for additional losses.
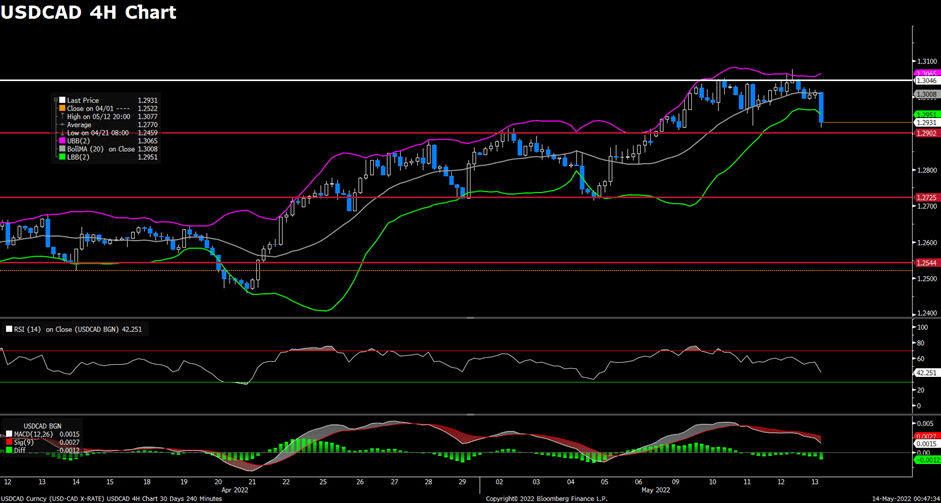
As the US dollar witnessed fresh selling after the release of the disappointing US Consumer Sentiment data, the pair USD/CAD declined towards the 1.300 mark and extended its daily losses on Thursday. The pair flirted with the 1.300~1.302 area for most of the day, then tumbled to a daily low below the 1.293 level during the US session. USD/CAD is trading at 1.2928 at the time of writing, losing 0.90% on a daily basis. The goodish recovery in the global risk sentiment and the dismal data exerted bearish pressure on the US dollar, which retreated from a two-decade high near 105 level today and dragged the USD/CAD pair lower. On top of that, the surging crude oil prices underpinned the commodity-linked loonie as WTI WTI rallied for the third straight day into the $110.00 per barrel area. The concerns about the EU/Russia gas trade escalated as Gazprom halted flows to some of its European sub-units.
For the technical aspect, the RSI indicator is 42 figures as of writing, suggesting that the downside is more favored as the RSI stays below the mid-line. For the Bollinger Bands, the price moved out of the lower band so a strong trend continuation can be expected. In conclusion, we think the market will be bearish as the pair is heading to test the 1.2902 support. USD/CAD looks bearish in the short term and the falling RSI also reflects bear signals, but a recovery above 1.3046 should change the outlook to bullish.