November 17, 2021
Market Focus
Eqiuities climbed after the largest increase in U.S. Retail Sales since March, with reports from industry leaders Walmart Inc. and Home Depot Inc. showing strong demand even as inflation pares down purchasing power.
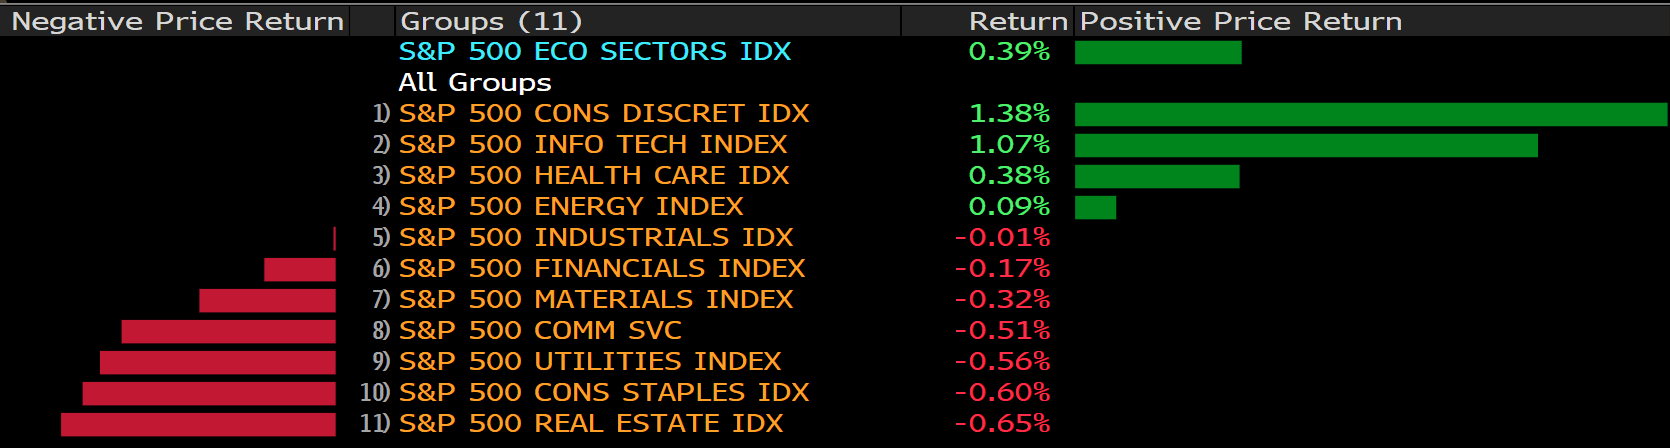
The robust retail figures along with better-than-anticipated Industrial Production and Housing Market index helped lift the US stocks, overshadowing words from St. Louis Fed’s head James Bullard that the central bank should accelerate its cut on monetary stimulus to ease inflation. All major equity benchmarks advanced, with the S&P 500 extending its November uptrend, Nasdaq surging 0.76% to 15973.86, and Dow Jones up a modest 0.15%, closing the day at 36142.22.
China is speeding up plans to replace American and foreign technology, quietly empowering a secretive government-backed organization to vet and approve local suppliers in sensitive areas from cloud to semiconductors, people familiar with the matter said.
Formed in 2016 to advise the government, the Information Technology Application Innovation Working Committee has now been entrusted by Beijing to help set industry standards and train personnel to operate trusted software. The quasi-government body will devise and execute the so-called “IT Application Innovation” plan, better known as Xinchuang (新創) in Chinese. It will choose from a basket of suppliers vetted under the plan to provide technology for sensitive sectors from banking to data centers storing government data, a market that could be worth $125 billion by 2025.
The existence of the Xinchuang white-list, whose members and over-arching goals haven’t been previously reported, is likely to inflame tensions just as Presidents Joe Biden and Xi Jinping wrapped up their first face-to-face virtual summit. It gives Beijing more leverage to replace foreign tech firms in sensitive sectors and quickens a push to help local champions achieve tech self-sufficiency and overcome sanctions first imposed by the Trump administration in fields like networking and chips.

Main Pairs Movement:
The greenback beat most of its major rivals amid the dollar index reaching fresh 2021 highs. The dollar was partially underpinned by a sour market mood, later by upbeat US Retail Sales.
Many fresh macro events were due on Tuesday. The upbeat UK labor market figures helped Cable to climb amid the robust USD, while the Euro pair continued its downtrend the previous day, as there was no surprise in the European GDP. Commodity-linked currencies were all shattered by the soaring dollar and the weakness of the oil prices, AUD/USD down 0.6% to 0.7300, and USD/CAD climbed 0.35% to 1.2550. The Japanese Yen was the worst performer, with USD/JPY surging 0.61% to a fresh yearly high at 114.85.
Gold reached a fresh multi-month high of $1,877.15 but pulled back to close in the red for a second consecutive day in the 1,850 price zone. Crude oil prices were mixed, with WTI down to $79.70 a barrel, and Brent posted a modest gain to $82.35. EU gas prices were up over 12%, as Germany suspended Nord Stream 2 certification. Geopolitical tensions escalated in Europe, along with the higher gas prices, would add pressure to current inflationary situations.
Technical Analysis:
EURUSD (4- Hour Chart)
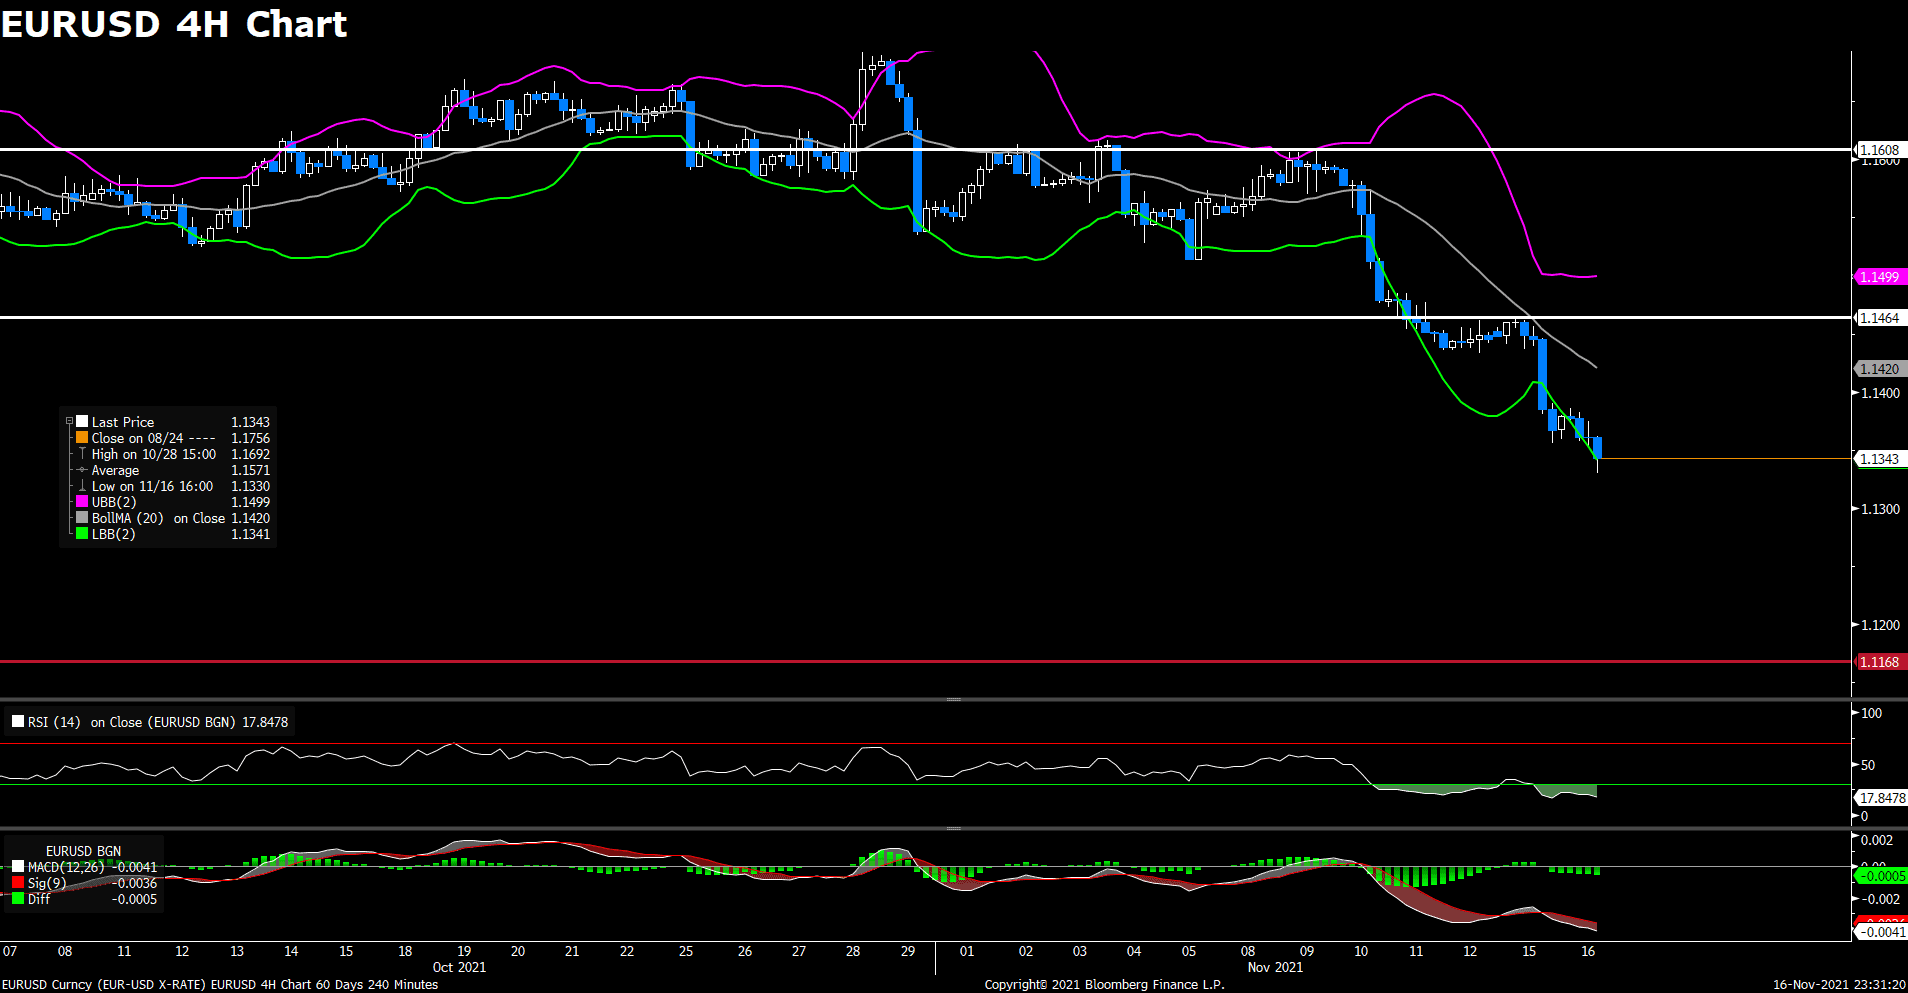
The pair EUR/USD continued to fall on Tuesday, touching the lowest level since July 2020 and remains under heavy pressure. The pair was flirting with 1.137 area during Asian and early European session, but then dropped towards a fresh yearly low amid renewed US dollar strength. The pair is currently losing 0.20% on a daily basis. Furthermore, the US Retail Sales released today showed an expansion of 1.7% in October, while Industrial Production expanded 1.6%. The upbeat data underpinned the greenback and pushed the DXY index higher to 95.74 at the time of writing. Investors now awaits ECB President Lagarde’s speech, as a different tone might change the outlook on the EUR/USD.
For technical aspect, RSI indicator 18 figures as of writing, suggesting that the pair is in oversold zone, a trend reversal could be possible. For the MACD indicator, the MACD is now sitting below the signal line, which also indicates a possible downward trend for the pair. Looking at the Bollinger Bands, the price moves alongside the lower band, therefore the bearish momentum is likely to persist. In conclusion, we think market will be bearish as the continuation of the downtrend could drag the pair lower, a drop below 1.1168 opens the door to a deeper pullback.
Resistance: 1.1464, 1.1608, 1.3834
Support: 1.1168, 1.0871
USDCAD (4- Hour Chart)

The pair USD/CAD advanced on Tuesday, ending its previous two-day slide amid resurging US dollar. The pair followed yesterday’s bear movement and dropped to a four-day low in early Asian session, but then rebound back above 1.254 level during American session. The pair is currently rising 0.28% on a daily basis. In addition to the surprising US Retail Sales report, the cautious market sentiment and hawkish Fed expectations also supported the safe-haven US dollar, which caused the USD/CAD pair to see fresh buying. But the pull back witnessed in US Treasury bond yields might cap the upside for the pair. On top of that, falling crude oil prices also weighed on the commodity-linked loonie.
For technical aspect, RSI indicator 58 figures as of writing, suggesting bull movement ahead. Looking at the MACD indicator, the diminishing negative histogram also indicates a possible upward trend for the pair. As for the Bollinger Bands, the price crossed above the moving average after touching the lower band, therefore the upper band becomes the profit target. In conclusion, we think market will be bullish as the pair is heading to re-test the 1.2605 resistance. The bullish tone could be intensified if the pair break above that resistance.
Resistance: 1.2605, 1.2775, 1.2896
Support: 1.2387, 1.2288
AUDUSD (4- Hour Chart)
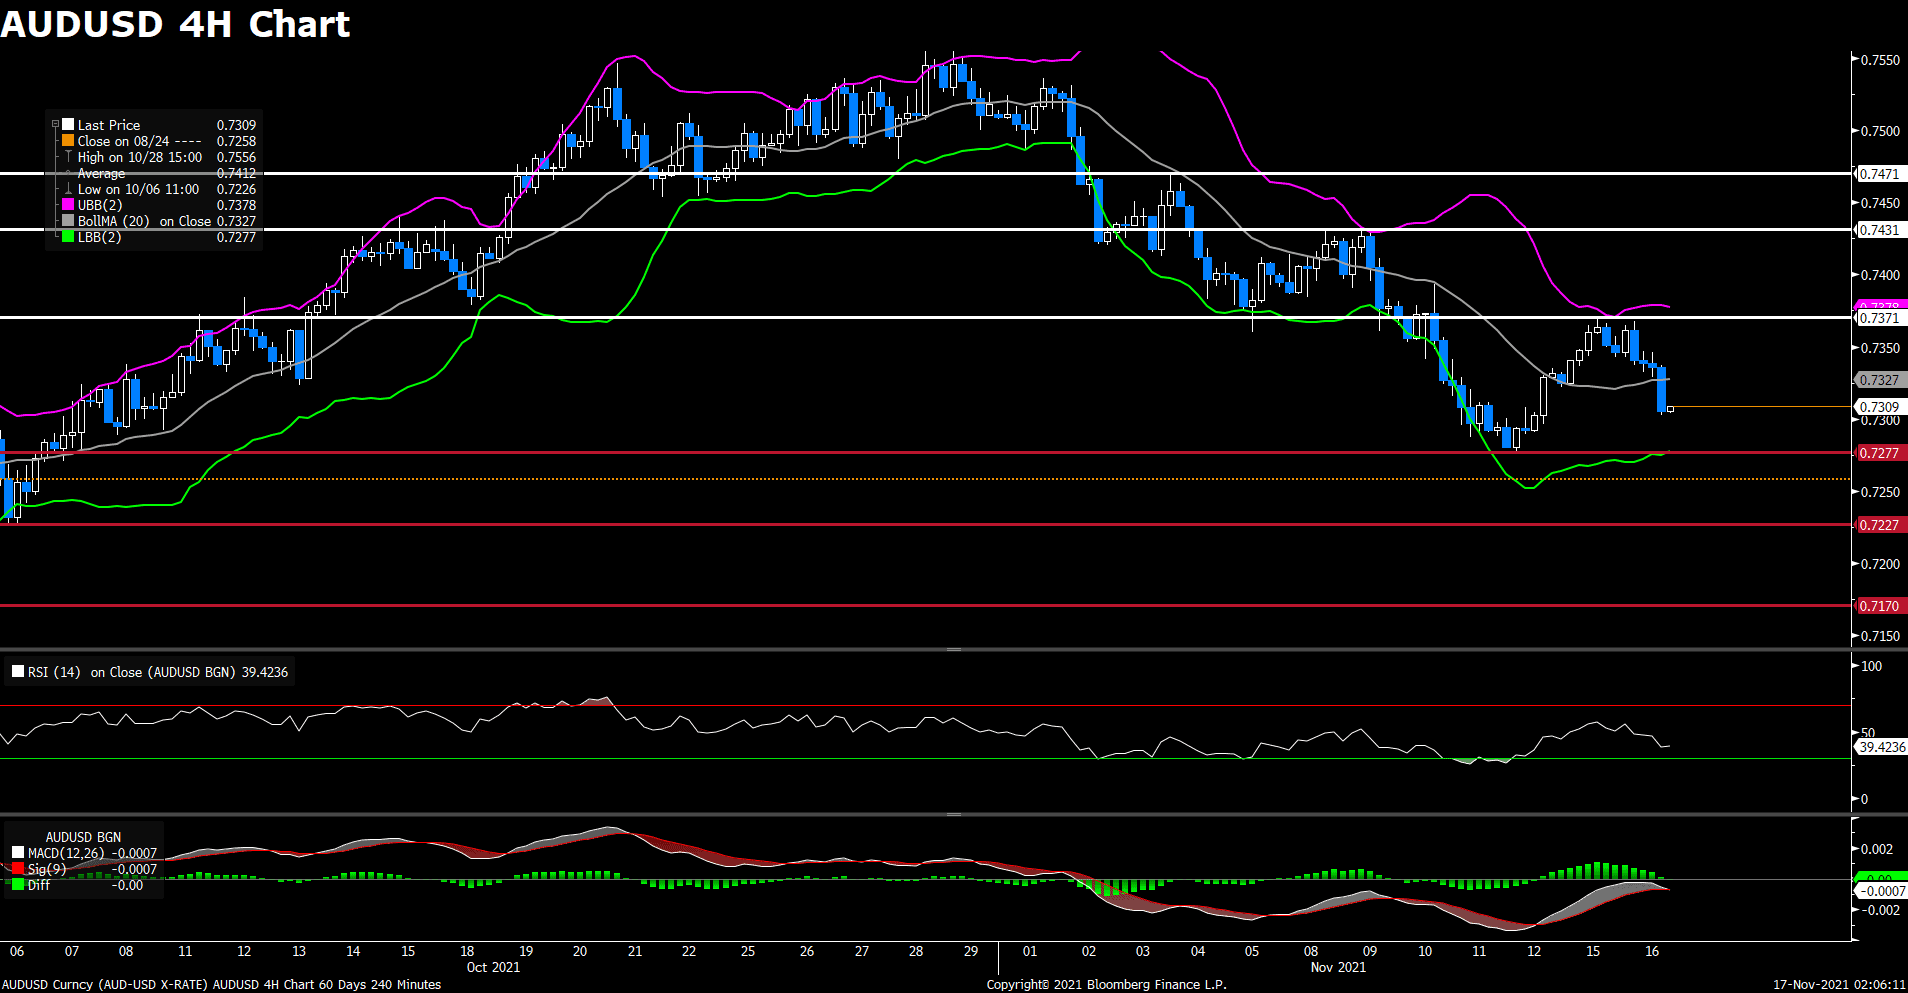
The pair AUD/USD tumbled on Tuesday, retreating from daily highs above 0.7365 level due to stronger US dollar across the board. The pair is surrounded by heavy selling pressure, losing 0.47% on a daily basis. Upbeat US Retail Sales data lend some support to the US dollar and dragged the AUD/USD pair lower. Moreover, the Reserve Bank of Australia announced its monetary policy minutes today, as the bank insisted on its previous standpoint that the cash rate will stay unchanged until 2024 unless wage growth and inflation targets are met. RBA Governor Philip Lowe also said that recent data would not support a rate hike in 2022.
For technical aspect, RSI indicator 38 figures as of writing, suggesting bear movement ahead. Looking at the MACD indicator, a death cross is forming on the histogram, which also indicates a bear market. As for the Bollinger Bands, the price crossed below the moving average after touching the upper band, therefore the lower band becomes the loss target. In conclusion, we think market will be bearish as the pair is eyeing a test of the 0.7277 support.
Resistance: 0.7371, 0.7431, 0.7471
Support: 0.7277, 0.7227, 0.7170
Economic Data
|
Currency
|
Data
|
Time (GMT + 8)
|
Forecast
|
|
EUR
|
ECB President Lagarde Speaks
|
09:20
|
|
|
GBP
|
CPI (YoY) (Oct)
|
15:00
|
3.9%
|
|
EUR
|
CPI (YoY) (Oct)
|
18:00
|
4.1%
|
|
USD
|
Building Permits (Oct)
|
21:30
|
1.638M
|
|
CAD
|
Core CPI (MoM) (Oct)
|
21:30
|
|
|
USD
|
Crude Oil Inventories
|
23:30
|
1.398M
|
|
|
|
|
|
|
|
|
|
|
|
|
|
|
|
|
|
|
|
|
|
|
|
|
|
|
|
|


