November 8, 2021
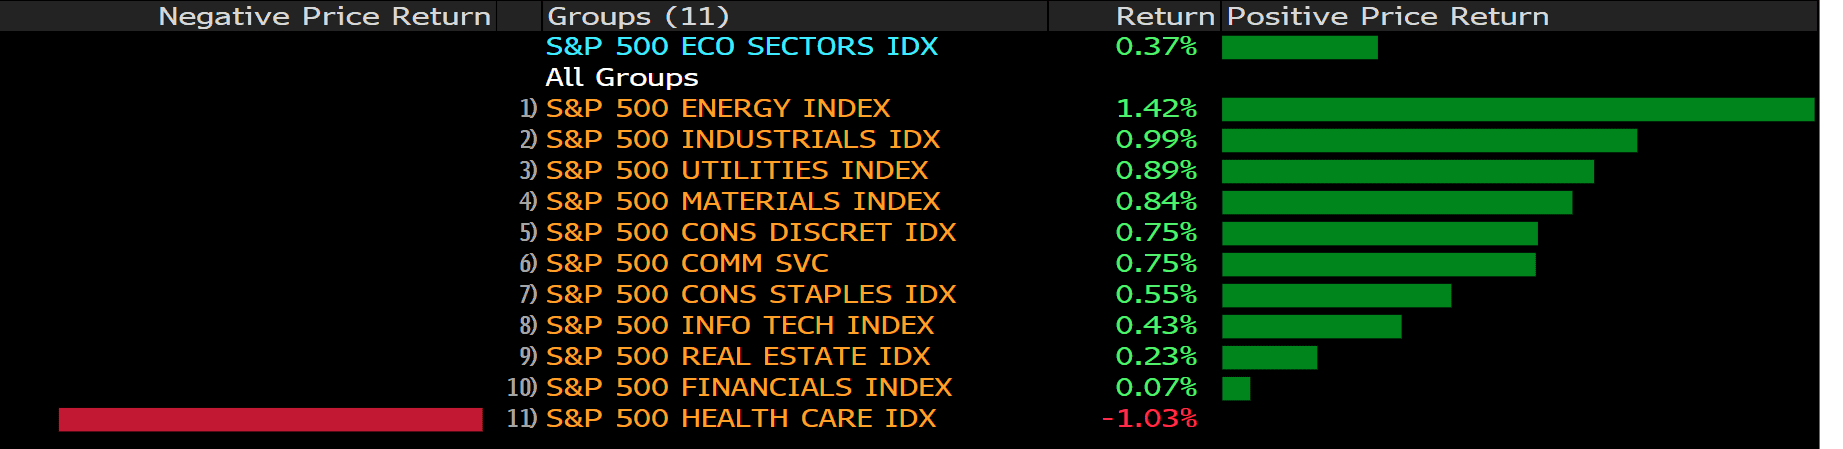
Stocks surged at the end of the week, with major indices rallying to fresh highs as investors reacted positively to the October jobs reports, which showed a better-than-expected pick-up in payroll growth and further improvement in the unemployment rate. The S&P 500 rose about 2% for the week to mark a fifth consecutive weekly gain — its longest winning streak since August 2020. The Nasdaq also jumped to a record as the broad move higher in tech shares, and the Dow reached a record close as well.
Elon Musk’s social media followers have spoken: The Tesla Inc. chief should sell 10% of his stake in the electric-car maker. A majority of 3.5 million Twitter users said they’d support the move in a poll that Musk launched Saturday when he floated the idea of selling the stock, which is valued at about $21 billion based on 170.5 million Tesla shares he holds. The poll closed shortly after 2:15 p.m. Sunday in New York, with about 58% of respondents backing the idea of the sale.
“I was prepared to accept either outcome,” Musk said in a tweet after the poll closed.
In Sunday trading on FTX, a digital asset version of Tesla’s shares recently fetched $1,138.95 — 6.8% lower than Friday’s close for the real stock — suggesting Musk’s tweeting may cause the shares to fall when Wall Street wakes up Monday.
While large sales by insiders are often seen as a negative signal, a sale of this size won’t alter Tesla’s story in a meaningful way, said Dan Ives, an analyst at Wedbush Securities. Demand remains high for Tesla shares among both institutional and retail investors, he said. The unorthodox step of getting buy-in from fans and investors via a poll may also ease any concerns.

Main Pairs Movement:
The greenback was mixed against G10 peers as the trading week gets underway in Sydney. The dollar’s strength shattered after the upbeat job reports, as the risk-on mood arose, weighing on the save-heaven bucks.
EUR/USD was up 0.12% to 1.1568 after touching a year-to-date low of 1.1514 on Friday. Despite an abundance of Covid-19 shots, countries from Germany to Greece have reported record infections in recent days. GBP/USD declined a modest 0.03% to 1.3494 later the Thursday’s massive plummet. The impact of Bank of England’s dovish statement was so huge that the pound had yet to recover from the loss.
USD/CAD held at familiar 1.2452; closed last week up 0.6% for a third straight weekly gain. Bank of Canada Governor Tiff Macklem says the central bank is “in control” of inflation. The November 17th CPI data will provide further insight in the bank’s statement. USD/JPY posted a 0.31% loss on Friday, plunged after the US NFP release and closed at 113.39.
Commodities ended the day in green. Gold jumped nearly 1.5% to $1816.17 a troy ounce. Crude oil posted gains as well. The WTI was last seen $81.34, 2.5% up on Friday, and Brent up 1.73% to $82.32.
Technical Analysis:
GBPUSD (Daily Chart)
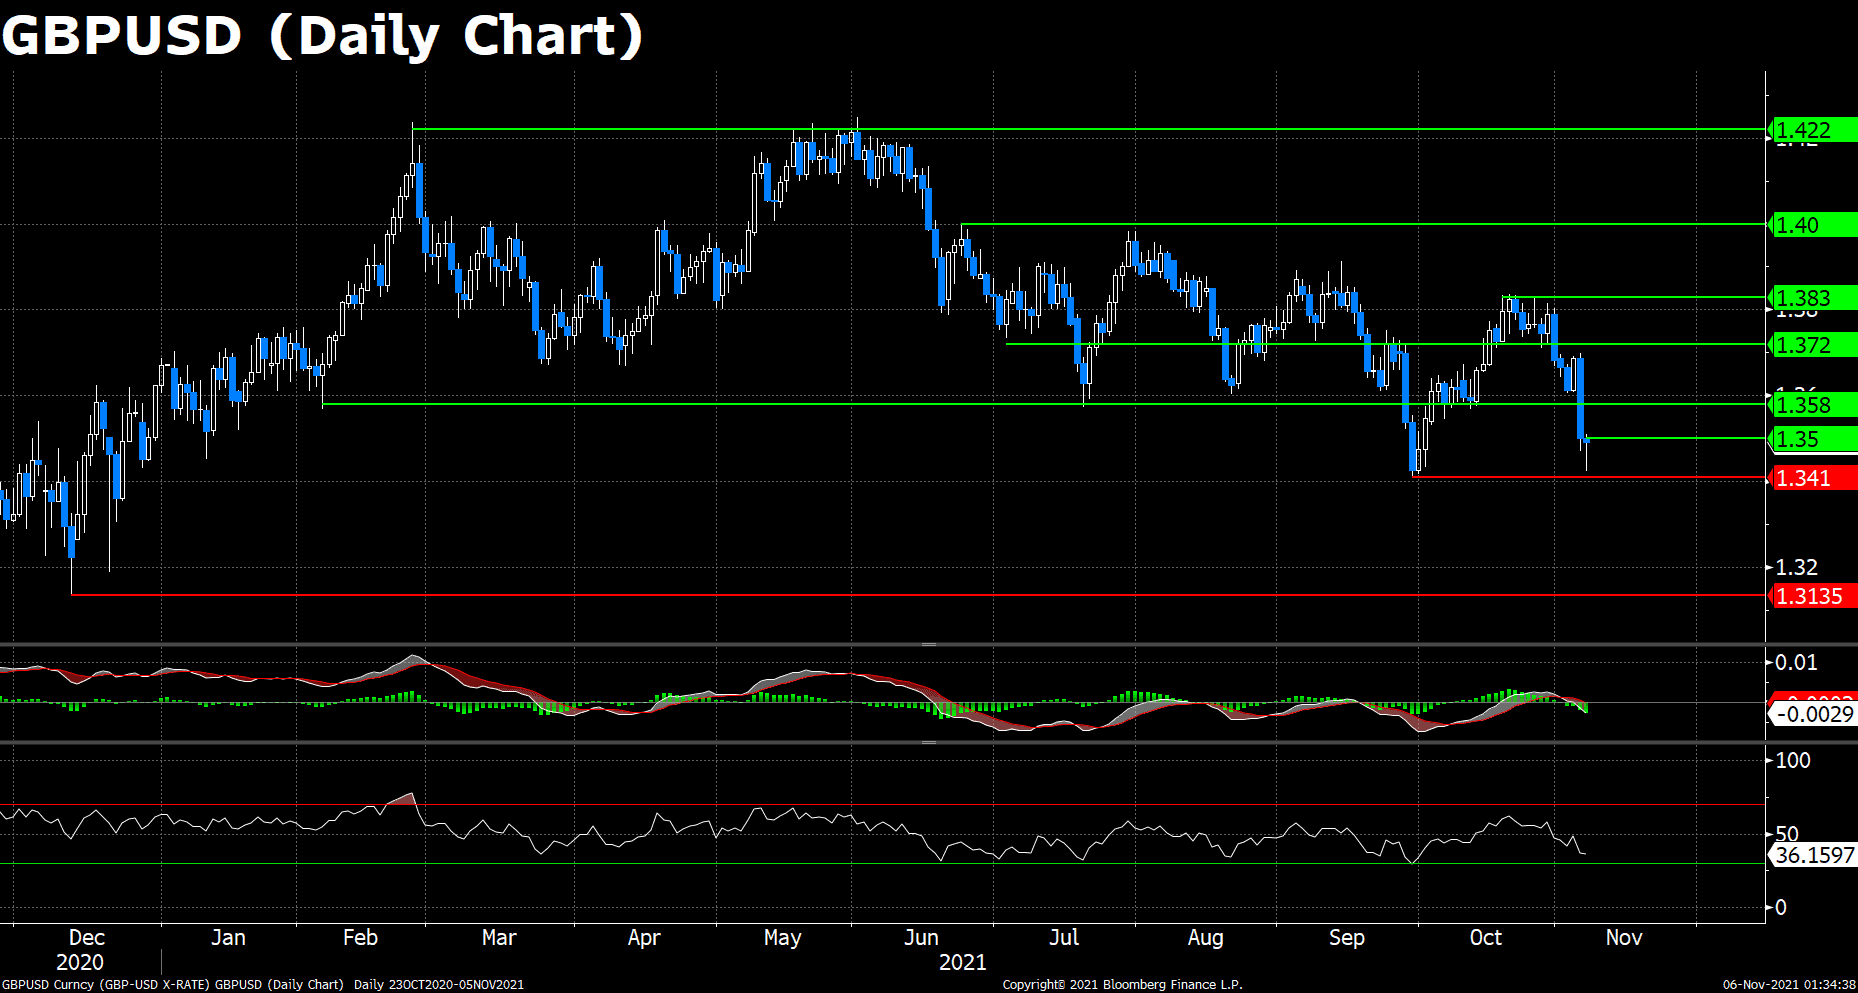
GBP/USD plummeted over 1.3% on Thursday after the Bank of England (BoE) voted to continue its bond-purchase program and to remain the interest rate unchanged at 0.1%. Cable extended further south on Friday and a recovery seems difficult in the short term. The pair trades at 1.3440 at the moment of writing, declined 1.8% from the open price of the week.
On the technical front, after the failing attempt to breach the 20-day moving average (DMA) on Wednesday, the unstoppable downward traction has dragged Cable over the lower bound of the Bollinger Bands. Moreover, the longer-term DMAs shifted to the downside on Friday. The diving 50 DMA is endorsing the growing downtrend and could boost it with a bearish crossover of the 200 DMA. The MACD and RSI also appears bearish, and despite the huge selling pressure, the RSI indicator has not reached the oversold territory yet, suggesting the downfall may proceed.
Resistance: 1.3500, 1.3567, 1.3720
Support: 1.3410, 1.3135
AUDUSD (Daily Chart)
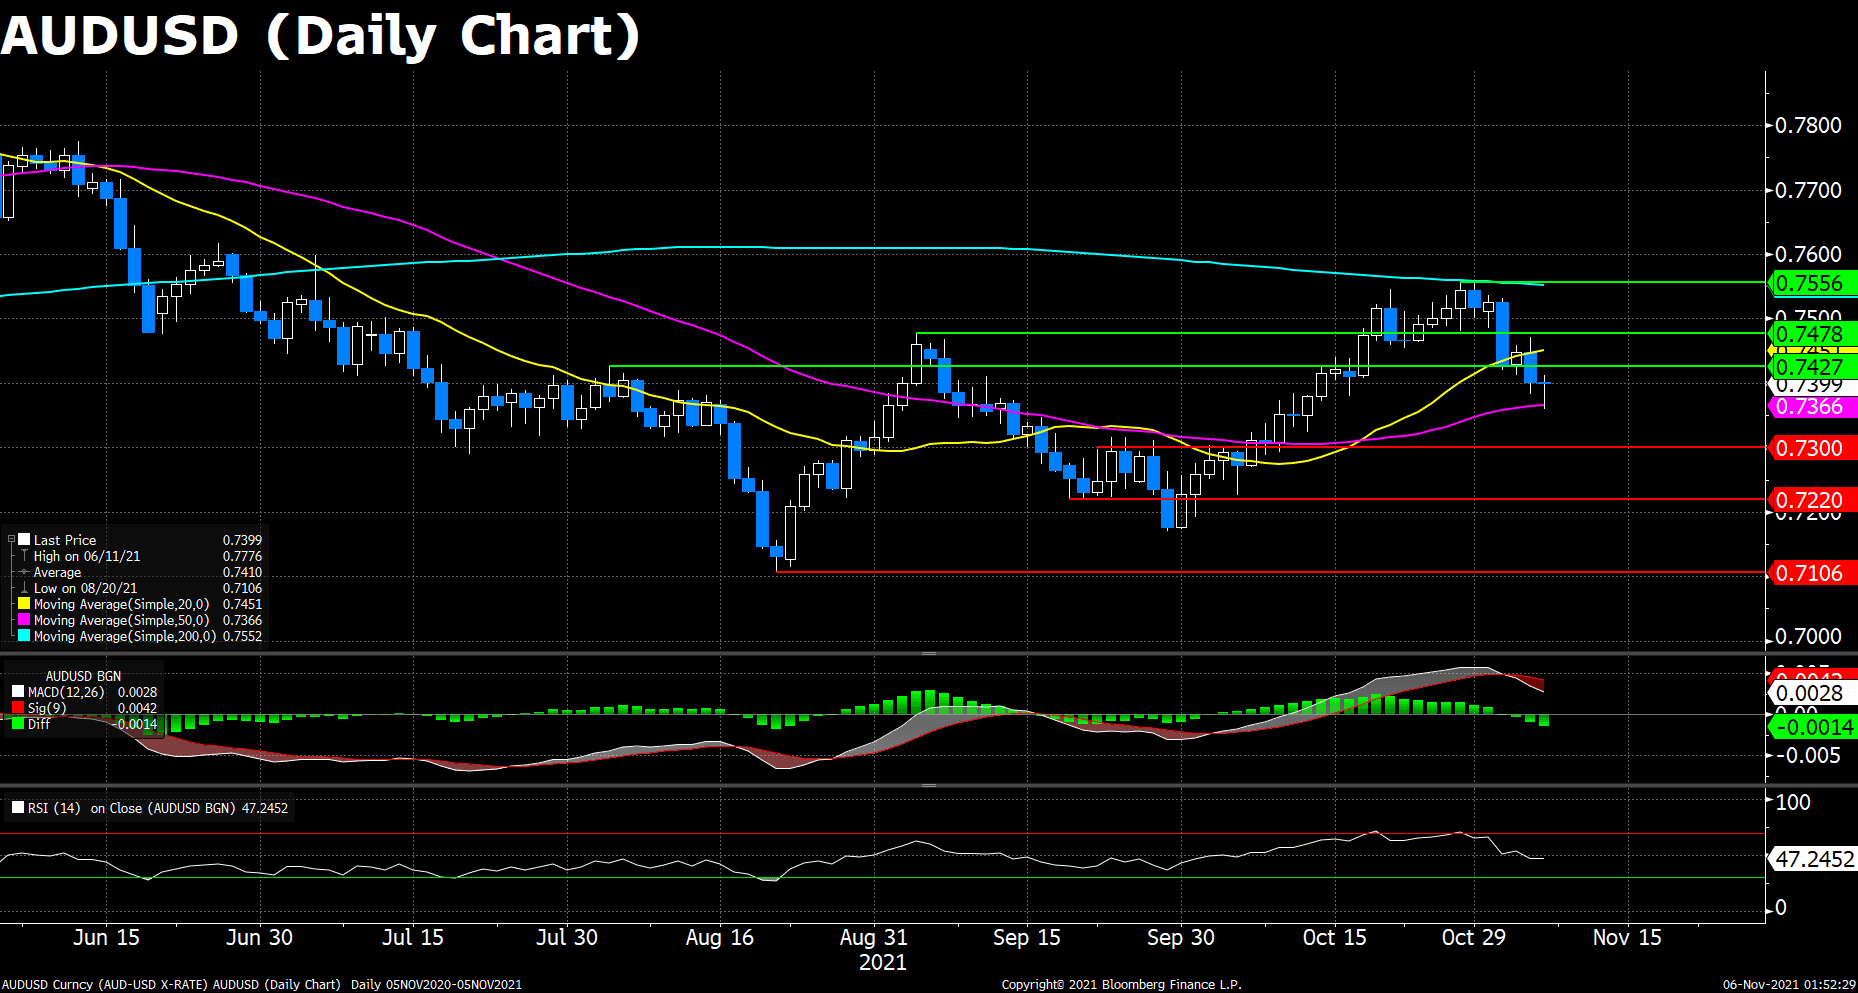
AUD/USD remains on the backfoot below 0.7400, looking to extend Thursday’s sell-off amid the recent strength in the US dollar against its major rivals. The Reserve Bank of Australia’s (RBA) dovish stance on the monetary policies also weighed on Aussie, let alone the recent plummet in commodity prices to make the commodity-linked AUD less attractive.
On the other hand, the high Treasury yield levels and fresh Chinese property sector concerns continue to keep the buoyant tone intact around the greenback. The dollar index hovers around the highest levels throughout the year, last seen 94.50.
Looking at AUD/USD’s daily chart, the price action on Friday is below all the moving averages, along with the bearish MACD histogram and RSI indicator, showing the downward traction is in charge and will prevail for a period of time.
Resistance: 0.7427, 0.7478, 0.7556
Support: 0.7300, 0.7220, 0.7106
USDJPY (Daily Chart)

USD/JPY seesawed around the familiar levels during the day, consolidating around a narrow range between 113.50 to 114.05. The pair witnessed some demand in the European session, posting a daily high at 114.03. However, after the upbeat NFP data released, the pair plummeted around 50 pips and touched a daily low at around 113.50.
Looking at USDJPY’s daily chart, we can see the price actions were simply lingering around the 76.4% to 100% Fibonacci interval since it jumped into this territory at mid-October. The pair seems lack of momentum to either penetrate the 76.4% support or refresh the yearly high. The technical indicators also hovering around the average levels in this period, failing to provide insights for further directions. To the upside, the instant resistance will appear at 114.45, where the multiple October highs sits, then the yearly high 114.70; on the flip side, the Fibonacci levels await, along with the daily moving averages (DMAs), especially the 200 DMA, a breach over that line may open a long term downtrend.
Resistance: 114.45, 114.70
Support: 113.38, 112.57, 111.91
Economic Data
|
Currency
|
Data
|
Time (GMT + 8)
|
Forecast
|
|
CHF
|
Unemployment Rate n.s.a. (Oct)
|
14:45
|
2.6%
|
|
CHF
|
Unemployment Rate s.a. (Oct)
|
14:45
|
2.7%
|
|
EUR
|
Eurogroup Meetings
|
18:00
|
|
|
|
|
|
|
|
|
|
|
|
|
|
|
|
|
|
|
|
|
|
|
|
|
|
|
|
|
|
|
|
|
|
|
|
|
|
|
|
|
|