September 6, 2021
Daily Market Analysis
Market Focus
Disappointment over the U.S. August payroll report is all but certain to push Federal Reserve policy makers to delay considering a move to scale back asset purchases at their Sept. 21-22 meeting.
The addition of 235,000 jobs last month, falling well short of forecasts and the smallest jobs gain in seven months, suggests U.S. central bankers will need to see additional gains before starting to slow bond buying, economists said Friday following the Labor Department release.
Officials wants to see “substantial further progress” in jobs and inflation, and the hiring slowdown — blamed on a flare-up in Covid-19 cases — means moves in November or December are now more likely.
Stocks barely budged after Bloomberg News reported that Democratic lawmakers are considering slapping an excise tax on stock repurchases or treating them as taxable dividends as a way to offset some spending proposals.
On the face of it, that could see corporations slow the flood of cash into buybacks — some $370 billion already this year — that some argue props up share prices. But a possible proposal by one party, even the one with control of both legislative bodies, is a very long way from becoming law.
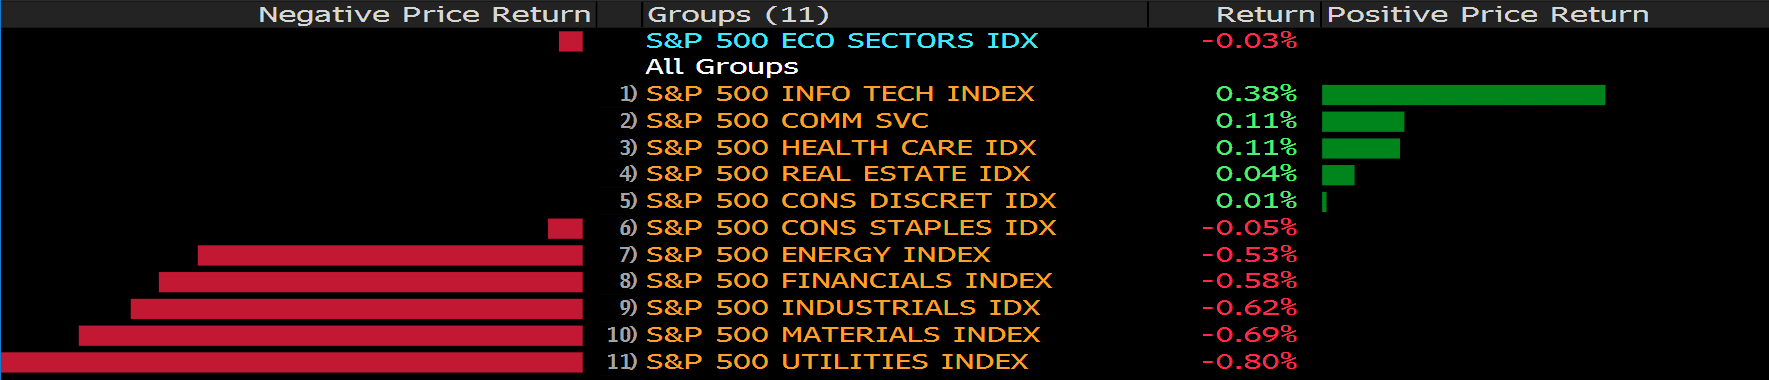
And if it did become enacted, the chances that the tax would have a meaningful impact on stocks remains low, money managers argued. With government spending and Federal Reserve largesse juicing the economy, dip-buyers have yet to let the S&P 500 Index decline by much more than 4% this year before swooping in.
The S&P 500 was little changed near an all-time high in trading volume 20% below the 30-day average, with many investors starting early on the three-day weekend.
Main Pairs Movement:
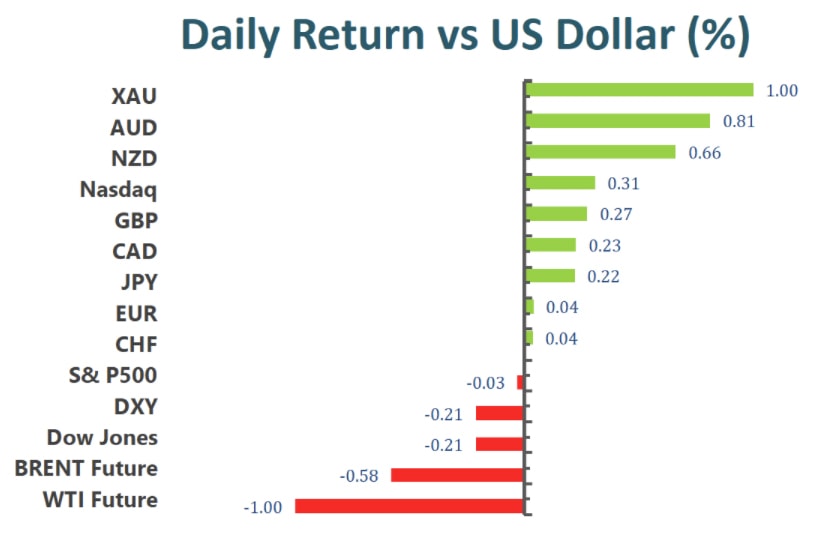
Non-US currencies flourished against the US dollar amid a devastating jobs report on Friday. August’s Non-Farm Payrolls figure printed 235,000, far missing anticipated 750,000. The concerning data indicated recovery in the labor market remains stalled. Spiking delta variant infections could contribute to the slowdown.
Today’s ugly NFP figure may foreshadow September’s number, which the Federal Reserve is desperately praying for. Given the importance between school season and parents’ availability, September’s NFP will critically determines the fate of Fed’s tapering program. It has to deliver a perfect report, similar to the one in July, in order to start unwinding its asset purchases.
Gold gained 1% to close the day around $1830. Judging from the performance in the US labor market, Gold should be well placed in an upward trajectory. However, big Gold ETF’s holding is somewhat contrary to current trend. The SPDR Gold ETF reduces holdings in the yellow metal by 103,000 ounces for the week of August 30th, the lowest volume recorded since last April. This suggests current incline in price may be temporary or pure speculative, and position could reverse quickly.
Technical Analysis:
XAUUSD (Daily Chart)
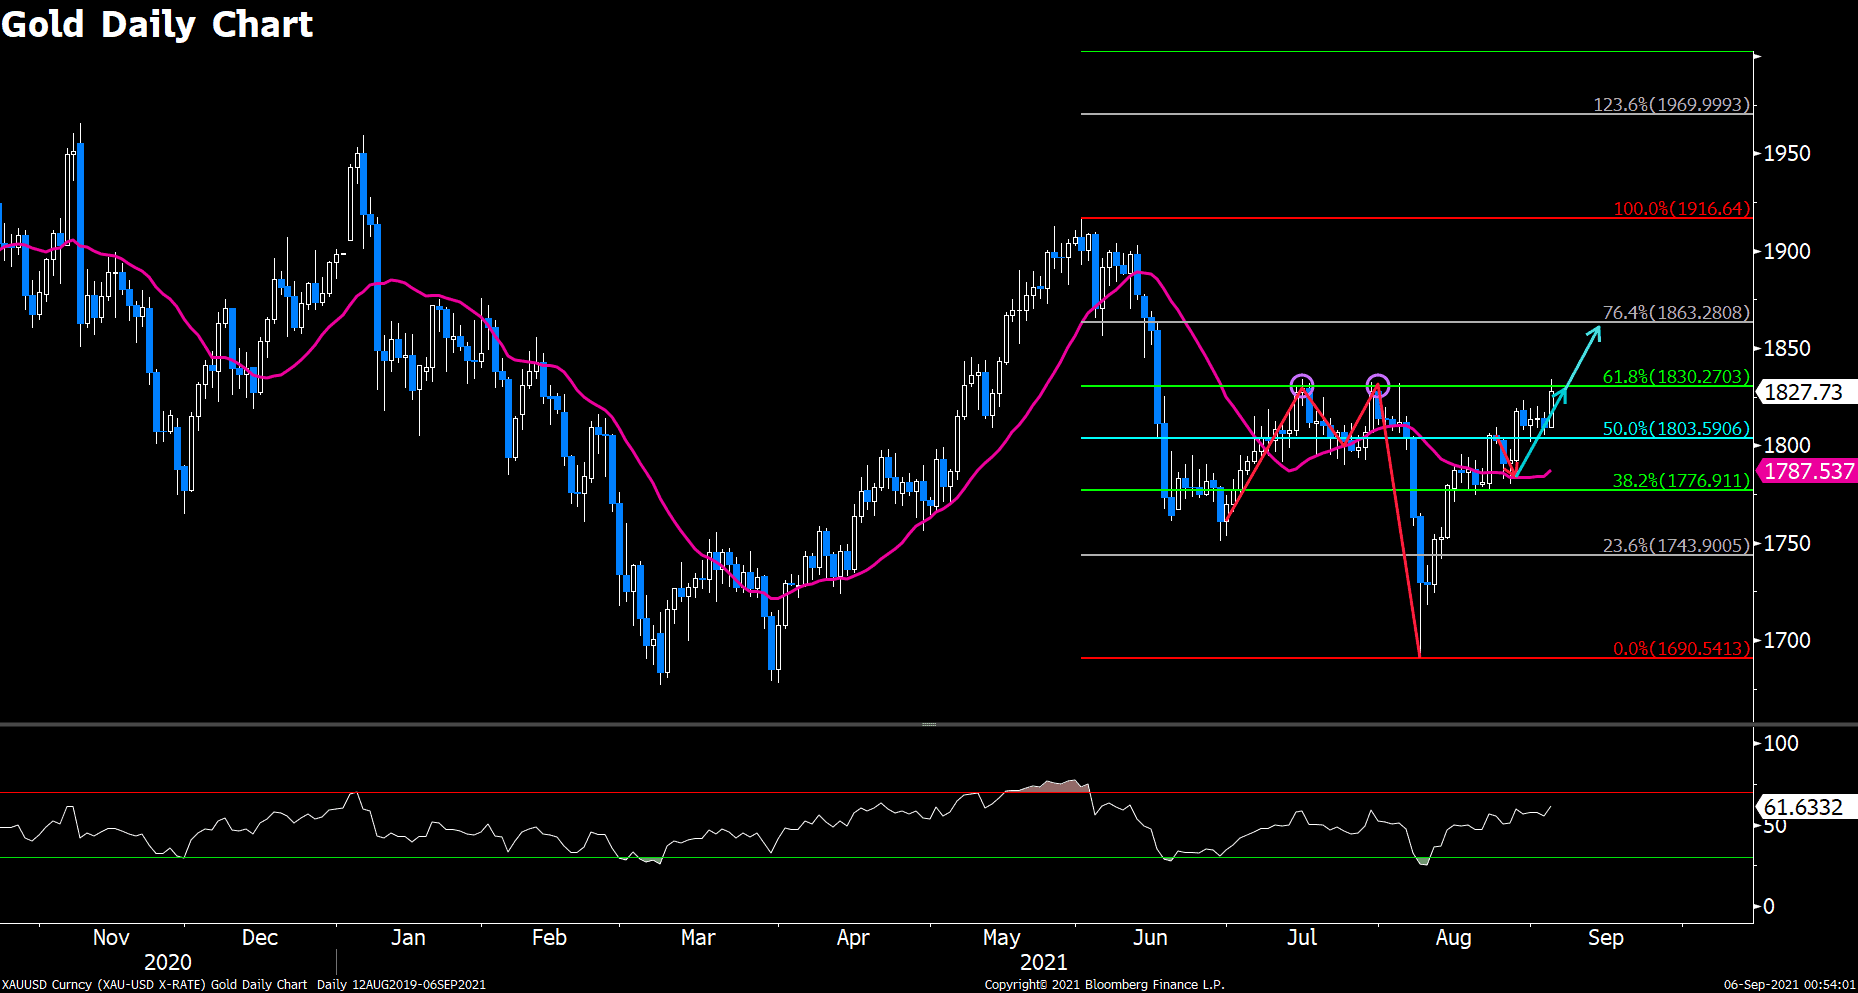
Gold climbed to one-month high of $1830 amid disappointing jobs data in the United States. The precious metal has made a remarkable comeback from a mini flash crash on August 9th, surged nearly 9% from the lowest point in the past six-months. Price is battling with a stubborn resitsance at $1830 handle. However, the sustained pressure is likely to ease this time around.
The big miss in NFP report provided strong incentives for central bank policy makers to further delays the timing of tapering asset purchases, which in turn deepens market concerns of short term inflation outrunning Fed’s policy. For the time being, price will rest around $1830 to close the week. But given the pessimism surrounding today’s NFP report, we believe plenty of institutional investors will at least increase the hedge positions in Gold, therefore lifting price. In the north, Gold will look to break $1830, and advance to 23.6% Fibonacci resistance of $1860. The high of $1910 may be a bit overstrenched in the near term, but could definitely be a target for further Fed’s dovish tone.
Resistance: 1860, 1910, 1950
Support: 1797, 1768, 1728
GBPUSD (Weekly Chart)
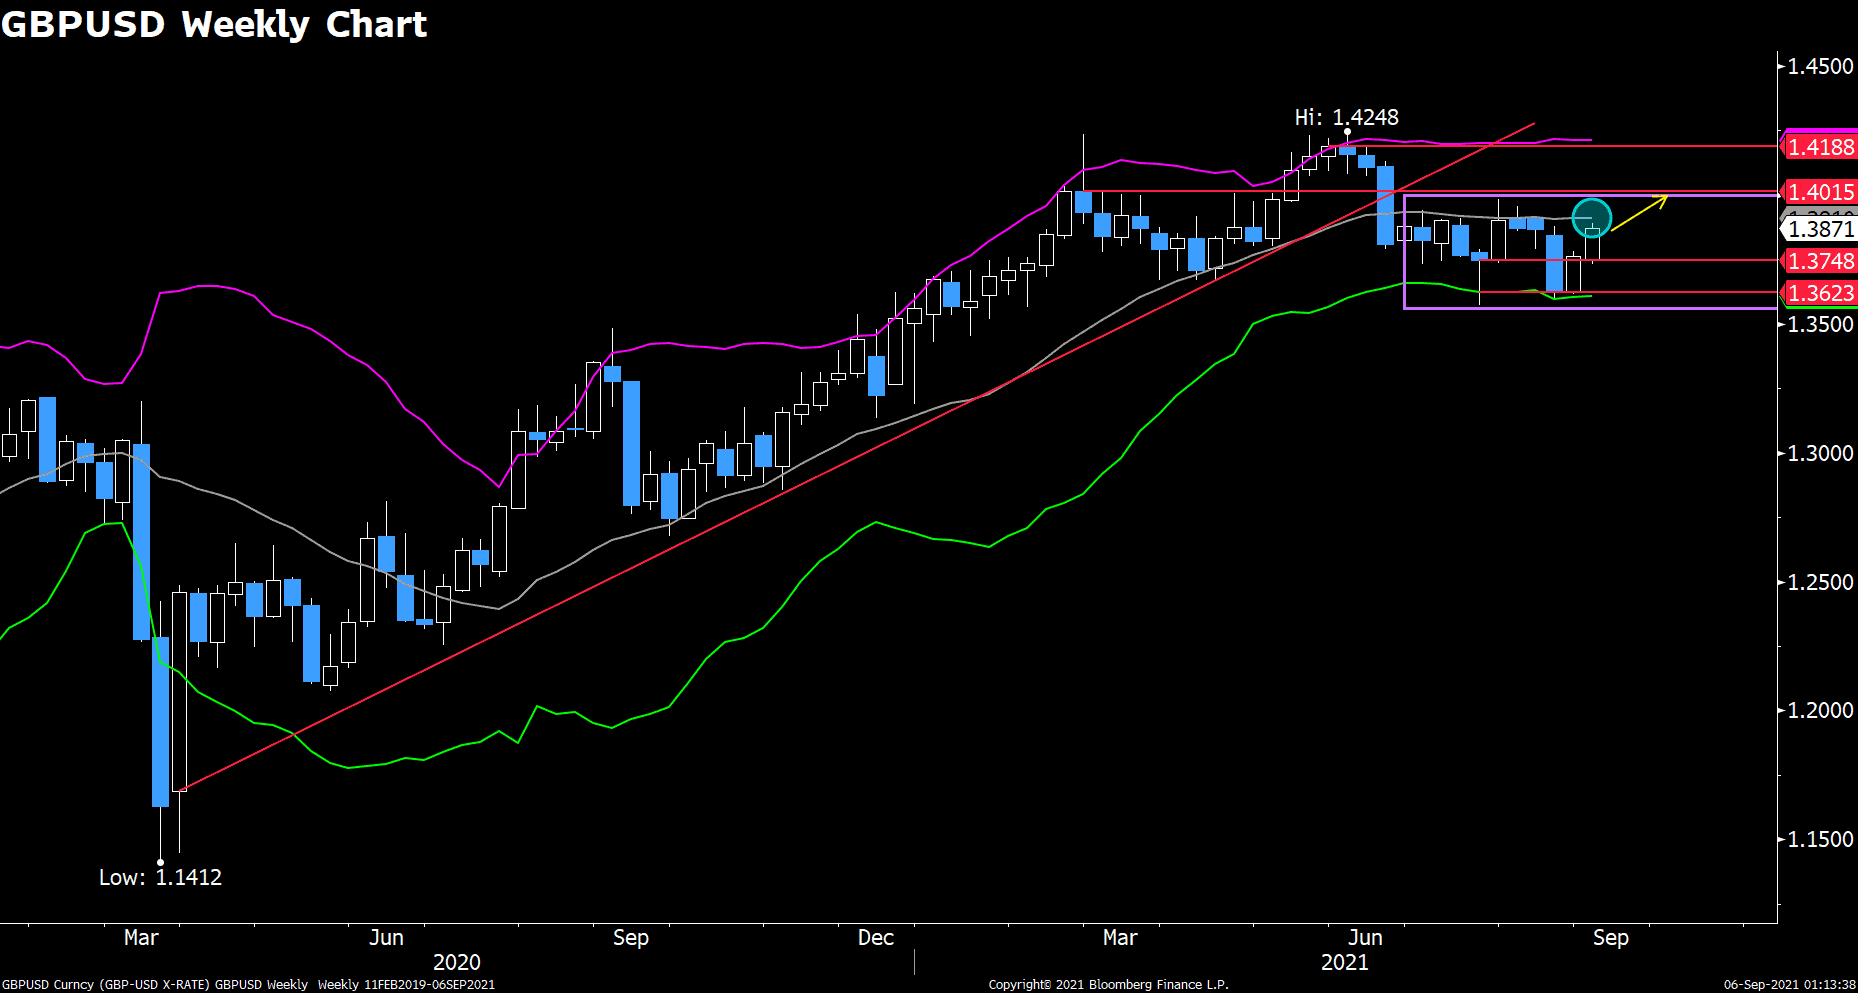
Cable pulled off a remarkable run since last March’s big plunge, but has been trapped in consolidation zone between 1.39 and 1.36 recently. This pair gained 0.93% during this week thanks to weaker dollar demand.
After spending two-months trading beneath the SMA20 on the weekly chart, it finally has another opportunity to contest this dynamic resistance. Furthermore, a decending trendline failed to cap price under, which could signal the beginning of a bullish reversal. We still need today’s strong momentum to carry over to next week in order to complete a trend reversal.
On the upside, buyers could be eyeing to take down 1.4 hurdle, which opens up doors to May’s high of 1.423. Downside risk will be cushioned by 1.374, followed by 1.36.
Resistance: 1.4, 1.423
Support: 1.374, 1.36
NZDCHF (Daily Chart)
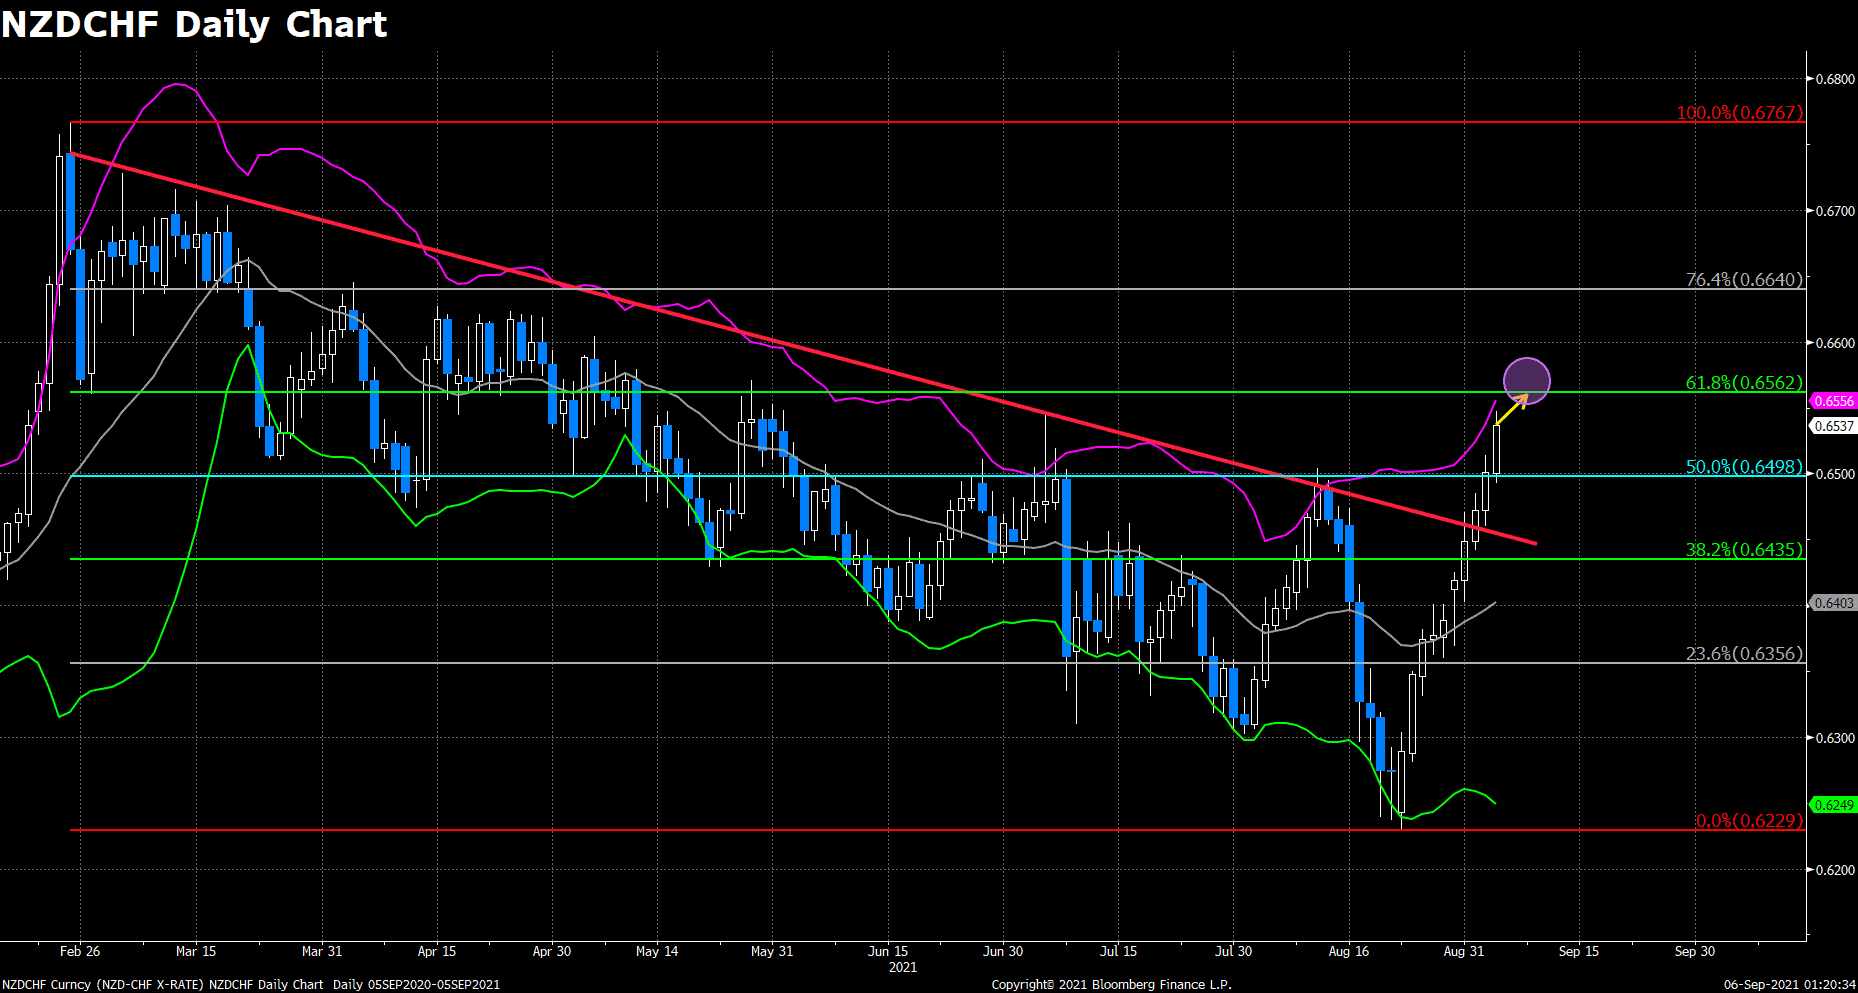
NZDCHF is on the tenth winning streak, rose 4.5% in two weeks. This pair broke above a seven-months downward tunnel with robust buying bias. It is about to hit the upper bollinger band, which conincides with 38.3% Fibonacci of 0.6567. We expect it to briefly touch this level before any pullbacks could materialize. The RSI indicates price is on the cusp of stepping into overbought zone, and could help to cool off an overheated bull.
All in all, we see further upside gains in NZDCHF in a longer investment horizon. A modest retreat could be very healthy to sustain such bullish trend. On the south, a good rebounding point would be 50% Fibonacci support of 0.65, followed by 0.644.
Resistance: 0.6567, 0.6645, 0.677
Support: 0.65, 0.644, 0.6353
Economic Data
|
Currency
|
Data
|
Time (GMT + 8)
|
Forecast
|
|
EUR
|
German Factory Orders (MoM) (Jul)
|
14:00
|
-1.0%
|
|
EUR
|
IHS Markit Construction PMI (Aug)
|
15:30
|
|
|
GBP
|
Construction PMI (Aug)
|
16:30
|
56.9
|
|
|
|
|
|
|
|
|
|
|
|
|
|
|
|
|
|
|
|
|
|
|
|
|
|
|
|
|
|
|
|
|
|
|
|
|
|
|
|
|


