August 10, 2021
Daily Market Analysis
Market Focus
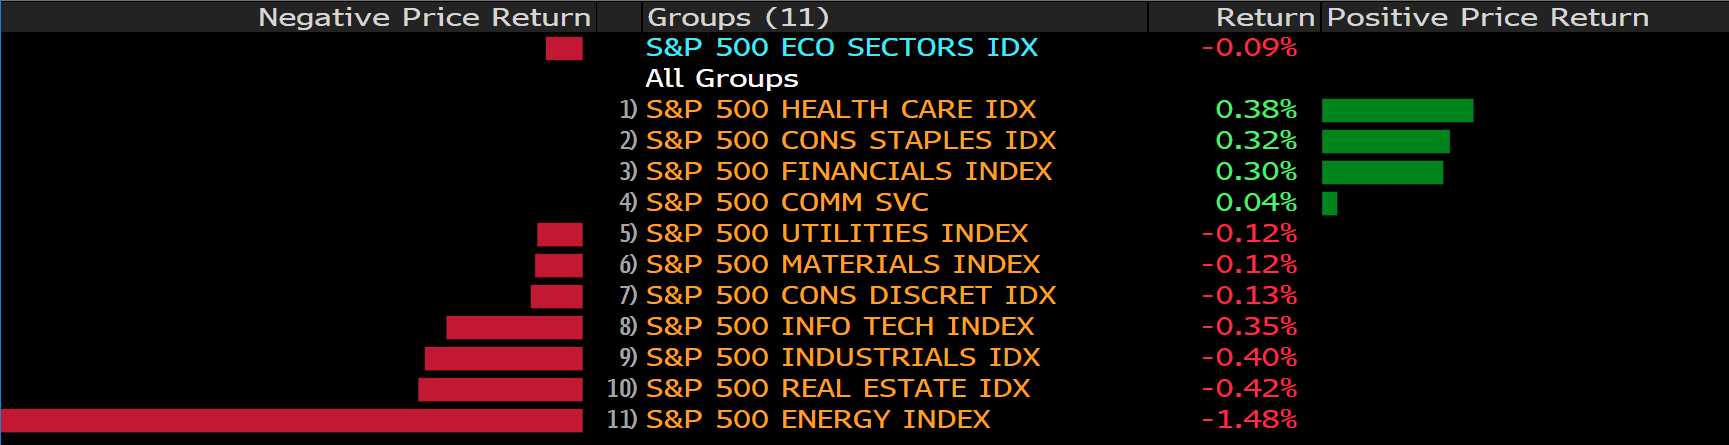
The US markets were mixed on Monday as investors concerned about the potential stimulus withdrawal and a resurgence of the delta virus variant. The Dow Jones Industrial Average dropped 106.66 points. The S&P 500 was down 0.1% and the Nasdaq 100 climbed 0.16%. The market tone was flat as investors mulled comments from the Fed’s tapering asset purchases and the US jobs report was better than expectations.
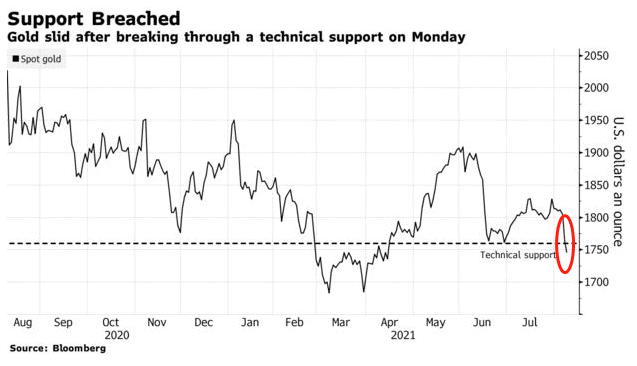
Gold slumped as much as 4.4% during the early trading hours of Asian session, but gradually recover later Monday. The major sudden sell- off was a prototypical shake by last Friday’s better- than- expected jobs report, which led the market to fear that the Fed might be being one step closer to reducing asset purchases and to accelerating the pace of raising the interest rates.
The president of the Fed of Boston added more comments on monetary policy. The Fed’s Eric Rosengren mentioned, there are growing number of people, outside and inside of the Fed agreeing on the Fed who should start dialing back its extraordinary aid because the economy is coming back strongly. Addition to Rosengren’s comment, the central bank should announce in September that it will start reducing its $120 billion by this fall.
Main Pairs Movement:
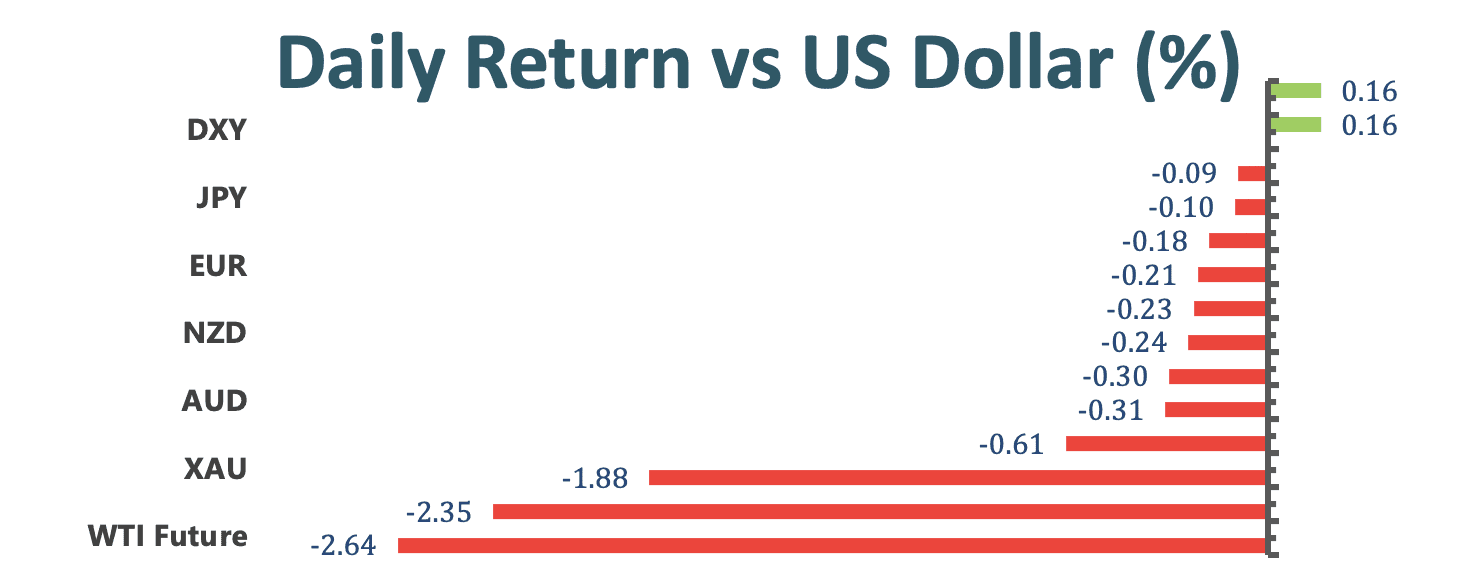
The Aussie’s bears moving in on a critical support, declining 0.32% on Monday. The bearish move was mostly driven by a strong US dollar as the tapering talk continued to be brought up the table. The US 10- year Treasury yields climbed 1.32%, which underpinned the demand for the US dollar.
The EURUSD currency pair dropped to a multi- month low, closing at 1.1736, and the GBPUSD currency pair declined 0.13% on Monday. The pairs continued to be under pressure as the US dollar held onto gains across the broad.
Crude oil price edged lower as much as 4%, closing at 66.48 as the demand might be lower since Return- to- Office might possibly delay.
Technical Analysis:
GBPUSD (4-hour Chart)
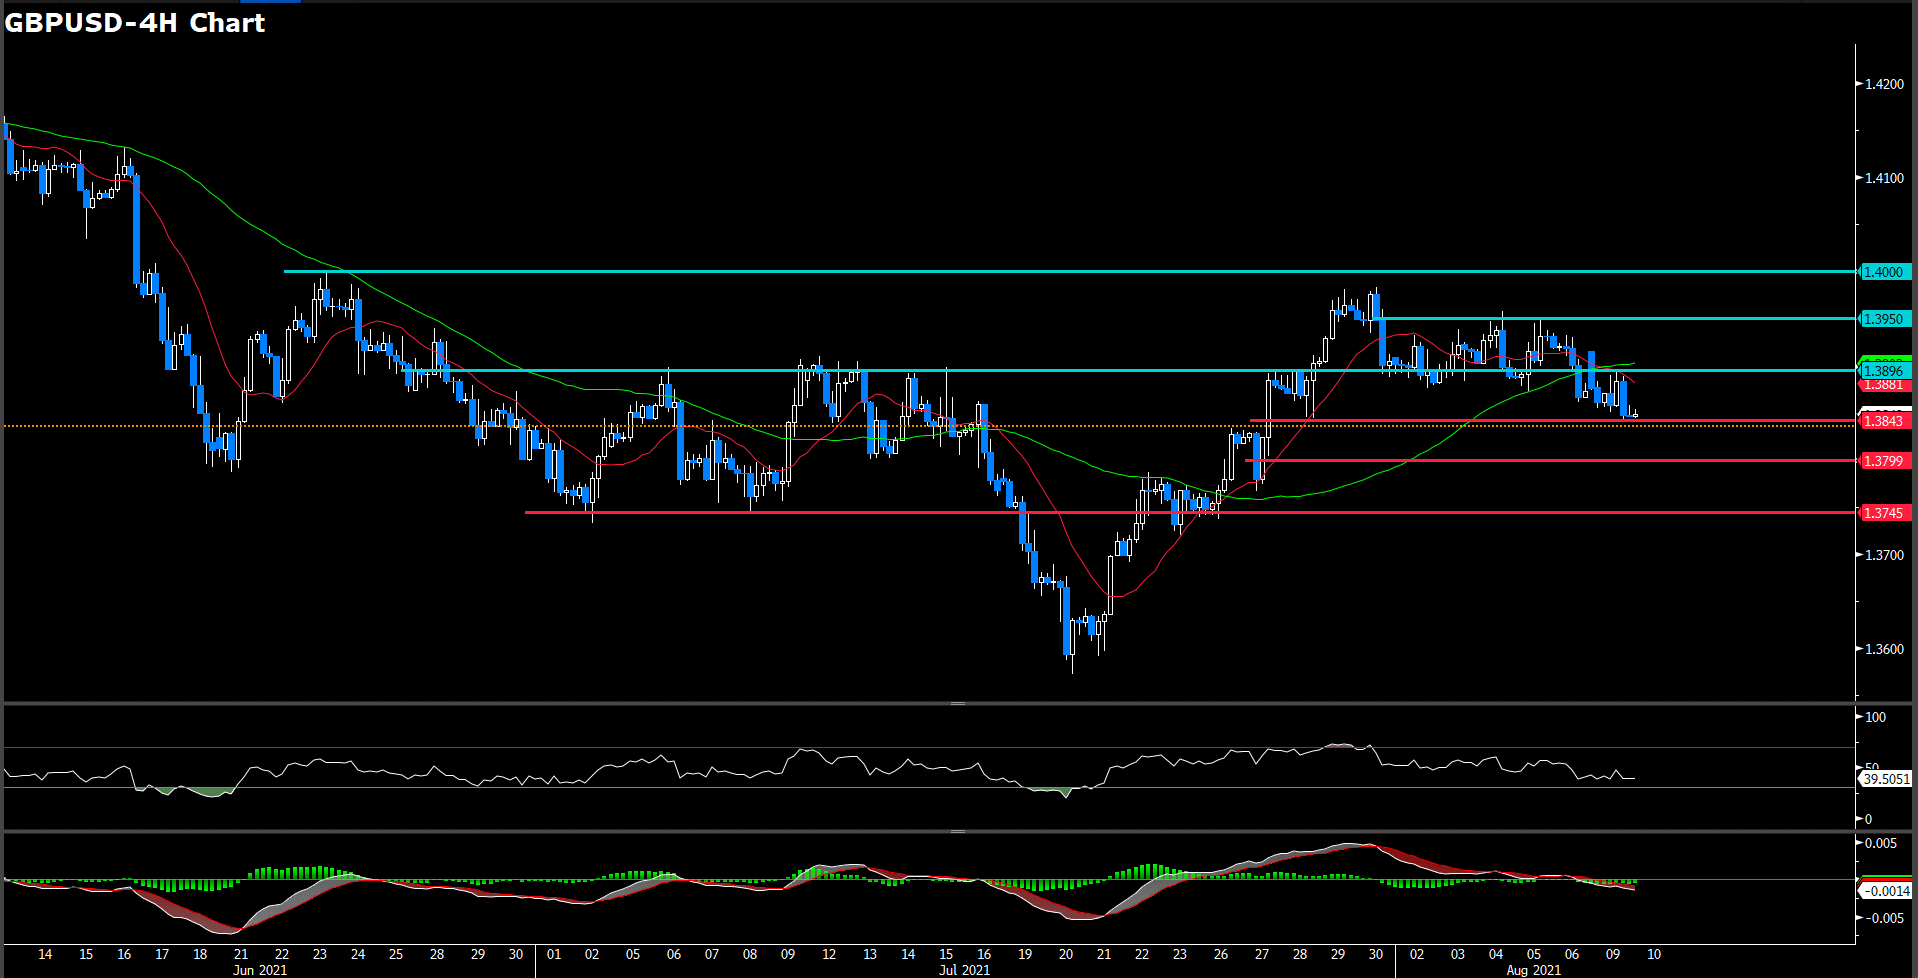
Sterling is trading a touch lower on the day, down 0.15% at the time of writing after sliding from a high of 1.3894 to 1.384. The markets are in consolidation and are still digesting Friday’s jobs report, showed that jobs were added and it was the largest gains in NFP since August 2020. The dollar is better bid on the back of the data, taking on the bears at fresh daily highs. For technical aspect, RSI indicator printed 39 figures nearly market close, suggesting bearish momentun ahead. For moving average side, 15 long SMA indicator have death cross with 60 long SMA indicator while 60 long remaining slightly upside movement.
All in all, we believe this pair still lacking of a direction as it miring in a tiny horizontal channel which choppy nearly a week. If price fall ahead, the first immediately support level is 1.3843 as recently low on Jul 28 and successive fall then market will eye on 1.385 level in short term and 1.38 level follow. On upway, if price could go over the last highs spot which around 1.395, it will heading to over 1.4 level.
Resistance: 1.3896, 1.395, 1.4
Support: 1.3843, 1.38, 1.3745
EURUSD (4- Hour Chart)
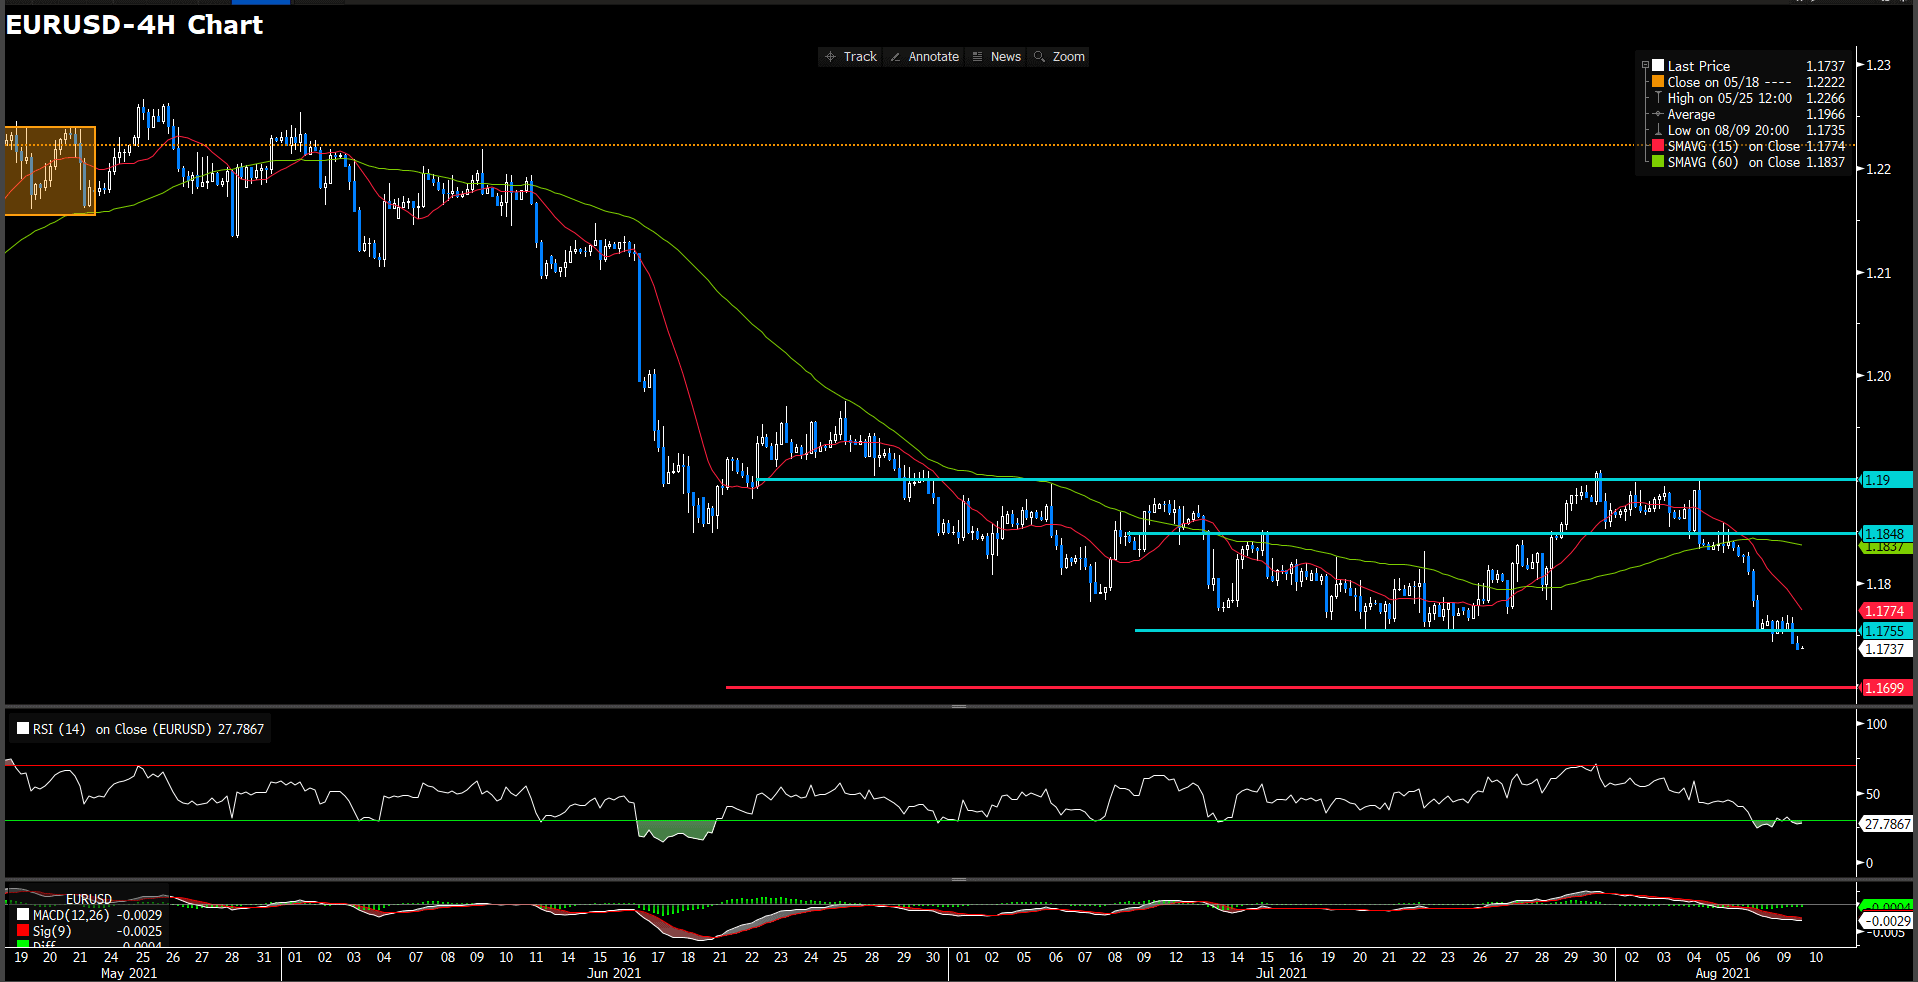
The euro dollar turned to the downward and gained a fresh monthly low under 1.174 threshold that pressure as the greenback holds daily win across the board, losses 0.19% to 1.1736 as of writing. No key macroeconomic data was released on Monday. Market participants continue to digest last Friday’s NFP data. From the technical perspective, RSI indicator has drop to 27 figures as of writing, suggesting over sought sentiment for a short term. For moving average side, 15 long SMA indicator retaining downward slope and 60 long SMA has turned it way to negative side.
As our mention previously, we expected if price drop below 1.1755, market momentum would drag it to lower lows that eyes on 1.17. Therefore, we forecast 1.17 will be the last support level, especially for bid buyer. On contrast, if price could stand above 1.1755, price will choppy between 1.1755 and 1.18.
Resistance: 1.1755, 1.18, 1.185
Support: 1.17
XAUUSD (4- Hour Chart)
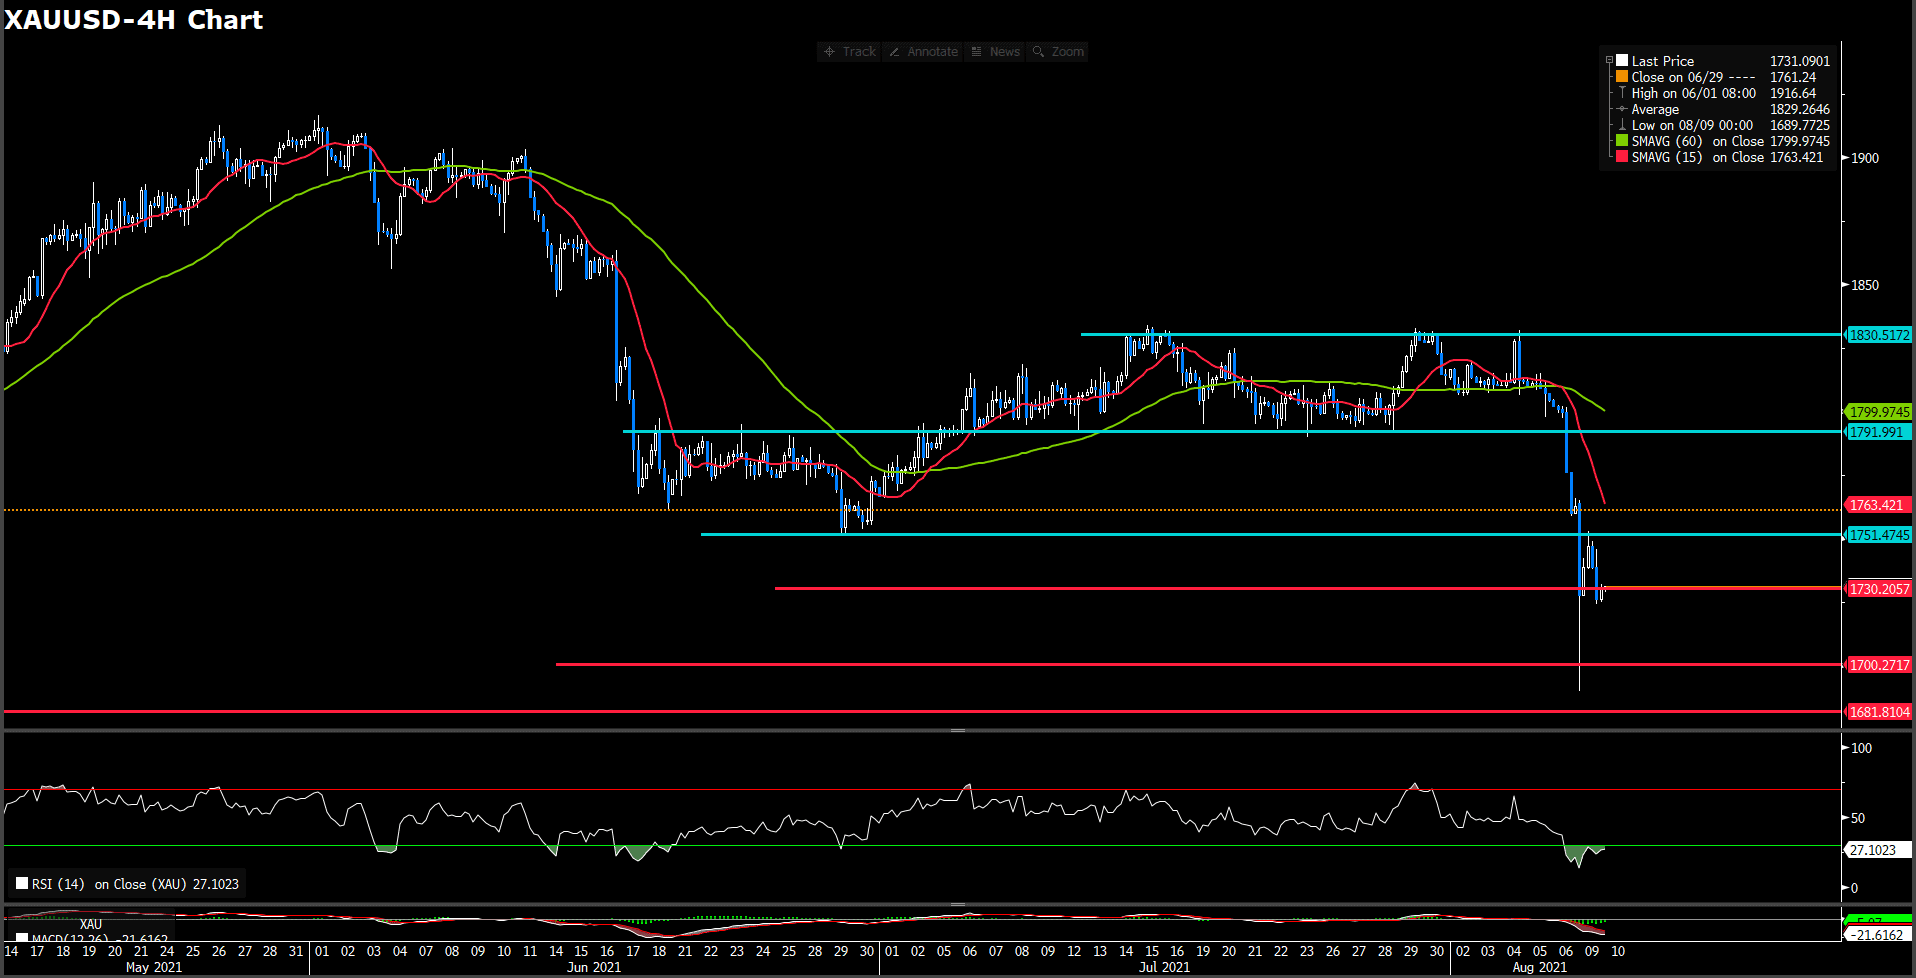
Gold is having a difficult time staging a convincing rebound following the steep drop witnessed in the early Asian session. With the latest data from the U.S. confirmng the improving labour market conditions, the pair started to edge lower and was last seen losing 1.91 on a daily basis at $1729. At the same time, the greenback rallied along with the U.S. treasury yield shooting into 1.3% territory. Concerns that the Fed is about to taper are likely to remain heightened in the short term, denting investor appetite for the precious metal for which we have witnessed an exodus at the start of the week. For technical side, RSI indicator still immerse in over sought territory, suggesting extremely sell side momentum fuel the market. For moving average perspective, both 15 and 60 long SMAs indicator are retaining downside movement.
For the market sentiment, we see indicator shows market is overly incling to selling moementum which fueled by market data. On the other hands, extremely dynamic movement impact the perspective of moving average. Therefore, we expect market will possibly rebound according to indicator suggestion. however, if momentum continue toward to downside, the first critical will on 1730. On up way, we expect 1751 will be strong resistance.
Resistance: 1751.5, 1792, 1830
Support: 1730, 1700, 1682
Economic Data
|
Currency
|
Data
|
Time (GMT + 8)
|
Forecast
|
|
EUR
|
German ZEW Economic Sentiment (Aug)
|
17:00
|
56.7
|
|
OIL
|
EIA Short-Term Energy Outlook
|
00:00
|
–
|
|
|
|
|
|
|
|
|
|
|
|
|
|
|
|
|
|
|
|
|
|
|
|
|
|
|
|
|
|
|
|
|
|
|
|
|
|
|
|
|
|
|
|
|