June 16, 2021
Daily Market Analysis
Market Focus
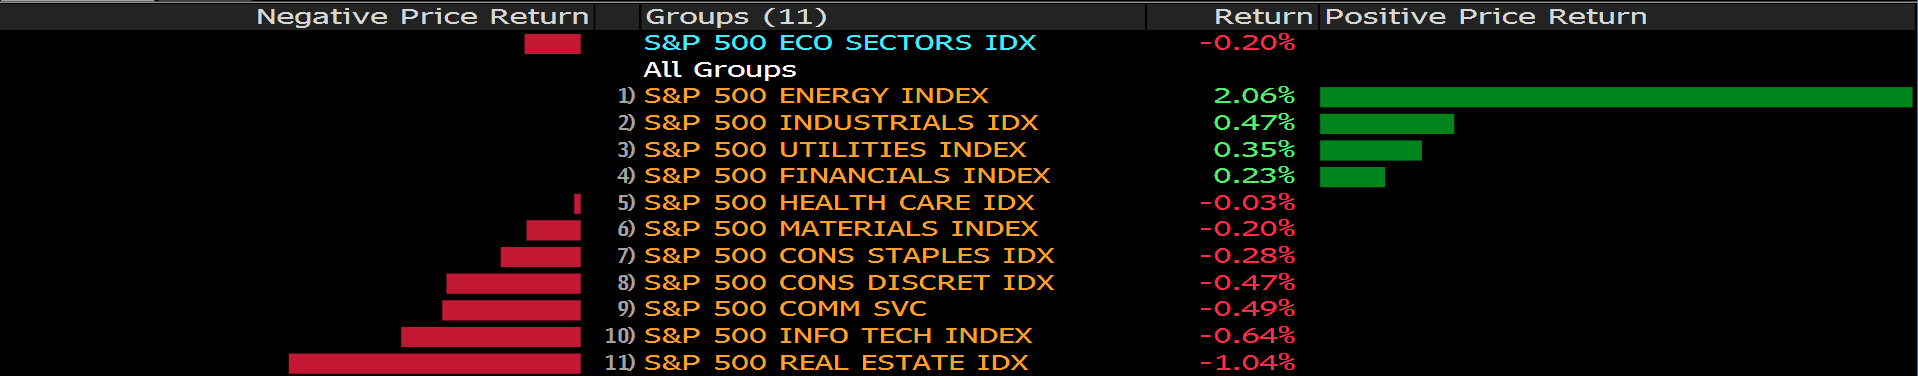
US stocks retreated from their peaks after the retail sales missed the expectations. Tech shares closed in the red, with the Nasdaq 100 dropped 0.71%, and Dow Jones declined 0.27%. Energy shares gained traction, but still could not lift the S&P 500 index as Real Estates and Tech stocks dragging behind.
Investors remained calm ahead of Fed’s policy decision. The statement is set to include updated forecasts, and communication of any taper plans well in advance. “After nearly a year of anti-climactic FOMC meetings, tomorrow’s meeting has the potential to move markets because it will likely start the process of the Fed communicating tapering of this historic accommodation,” commented Tom Essaye former Merrill Lynch trader.
China called the US “very ill indeed,” after President Joe Biden formed an anti-China ally during his Europe trip. China Foreign Ministry spokesman Zhao critized Biden’s efforts to counter China’s global economic expansion and told reporters “The G-7 had better take its pulse and come up with a prescription.” Tension continues to mount between the developed nations and the rising giant, though no actions are taken so far, but such development worries investors.
Main Pairs Movement:
Market turned cautious after the US depressing retail sales figures and the better-than-expected PPI. Investors focus on news about the Delta variant of COVID and uncertainty US infrastructure as the Fed’s decision approaches. Cryptos are struggling to cling gains.
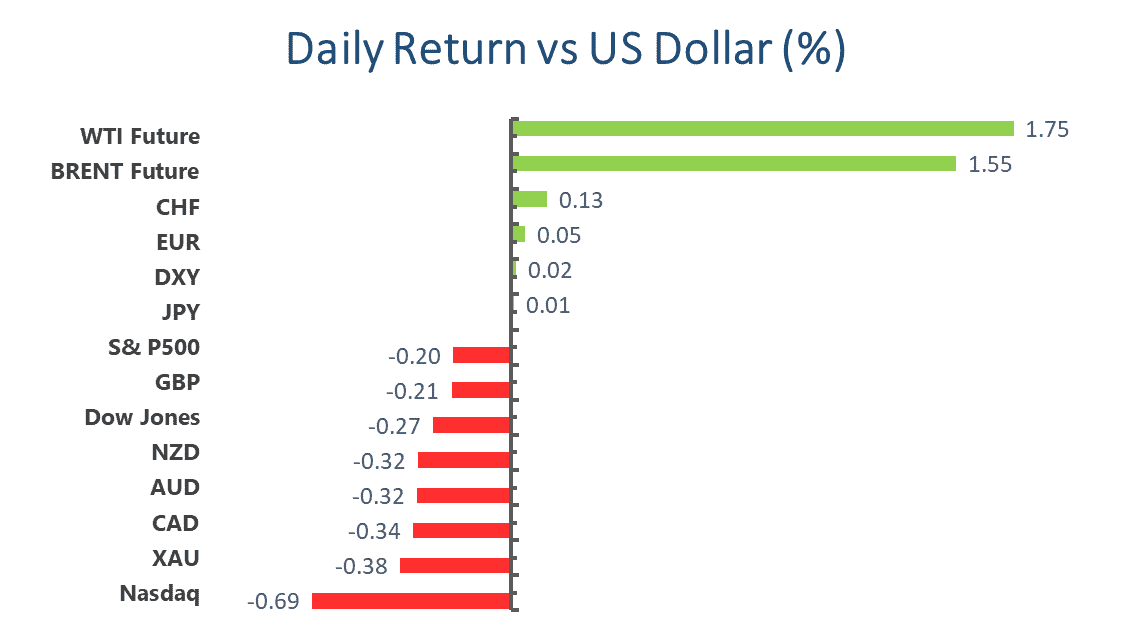
The dollar index performed well heading into the US opening but turned sour after the release of the macros, closing the day mixed. The swissy and the fiber are unchanged against its American rival, as well as the Japanese Yen, while the loonie and the sterling declined significantly.
US 10-year Treasury yields has breached 1.50% after US retail sales release, seemingly consolidating its previous gains. The UK and Canada CPI and industrial output also stand out on the economic calendar, along with the New Zealand GDP.
Oil price edged further north. WTI traded at $72.5, and Brent traded at $74.24, both recovering to the past-pandemic price level. Gold continues to fall, traded at $1858.82 as of writing.
Cryptos seems experiencing a correction. Bitcoin surged to $41330 earlier today, and rapidly dropped below $40000 within two hours, and Ethereum slightly decreased toward its $2,500 support after it bounced off $2,600.
Technical Analysis:
GBPUSD (Daily Chart)
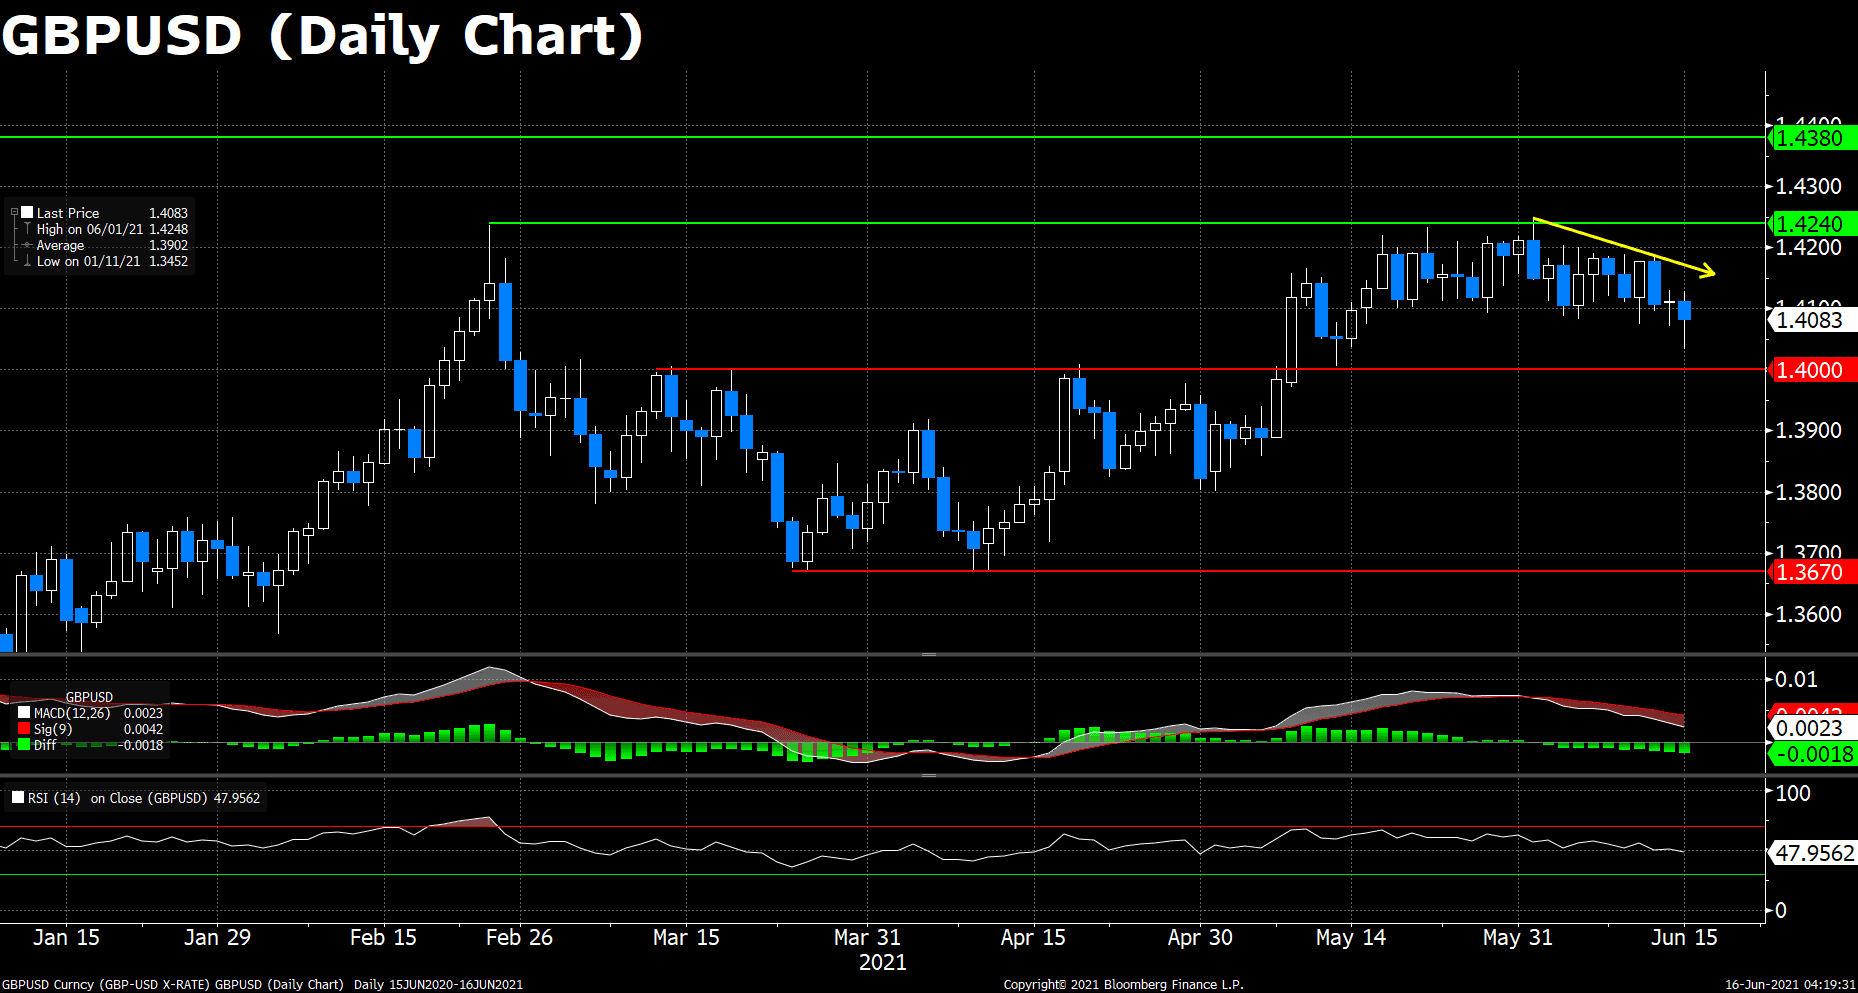
GBPUSD has declined for three consecutive days, and the selling pressure seems still strong. The MACD histogram remains bearish, while the RSI indicator fell under 50. Sterling fell short for demand despite the goodish UK employment report as analysts are worried about the delay of the lockdown program forcing some struggling businesses to lay off. On the other hand, though Fed is supposed to remain monetary policy unchanged, a less dovish statement are still possible given the upbeat inflation figures, and this may further dragged the pair down. The instant support for cable appears at 1.40, followed by the quarterly low, 1.367.
Resistance: 1.424, 1.438
Support: 1.40, 1.367
USDCAD (Daily Chart)
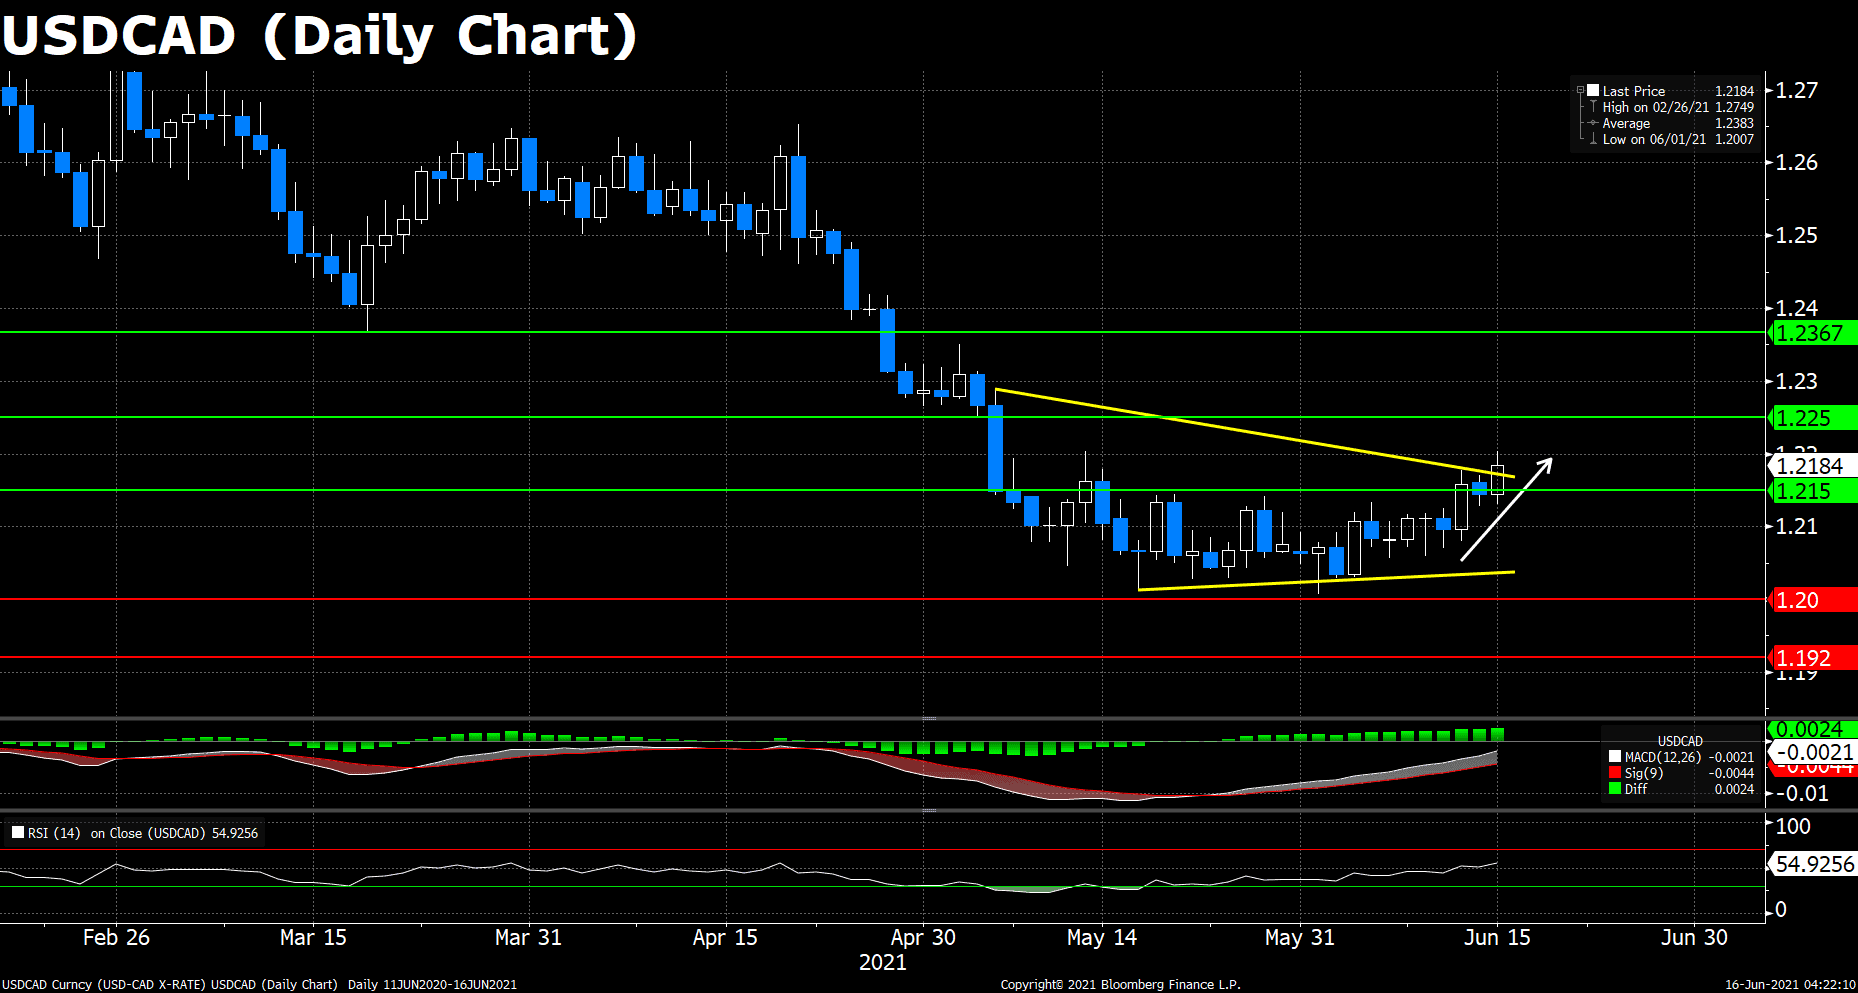
After three consecutive week’s consolidations, USDCAD finally broke through the 1.2 to 1.215 interval. Similar to other major pairs, the breakthrough of the loonie derived from the expectations of a slightly less dovish Fed after the US greater-than-expected inflation figures poped up. The MACD histogram appears bullish, while the RSI indicator has just consolidated in the buy-side territory.
However, pressure from the rising oil price is still a concern, adding that the policymakers’ attitude toward the higher inflation is still unclear, a solid rebound is still questionable. The FOMC press conference that takes place this Wednesday will provide further instructions from the officials. The best strategy is to stay positive but prudent before that.
Resistance: 1.225, 1.2367
Support: 1.215, 1.20, 1.192
AUDNZD (Daily Chart)
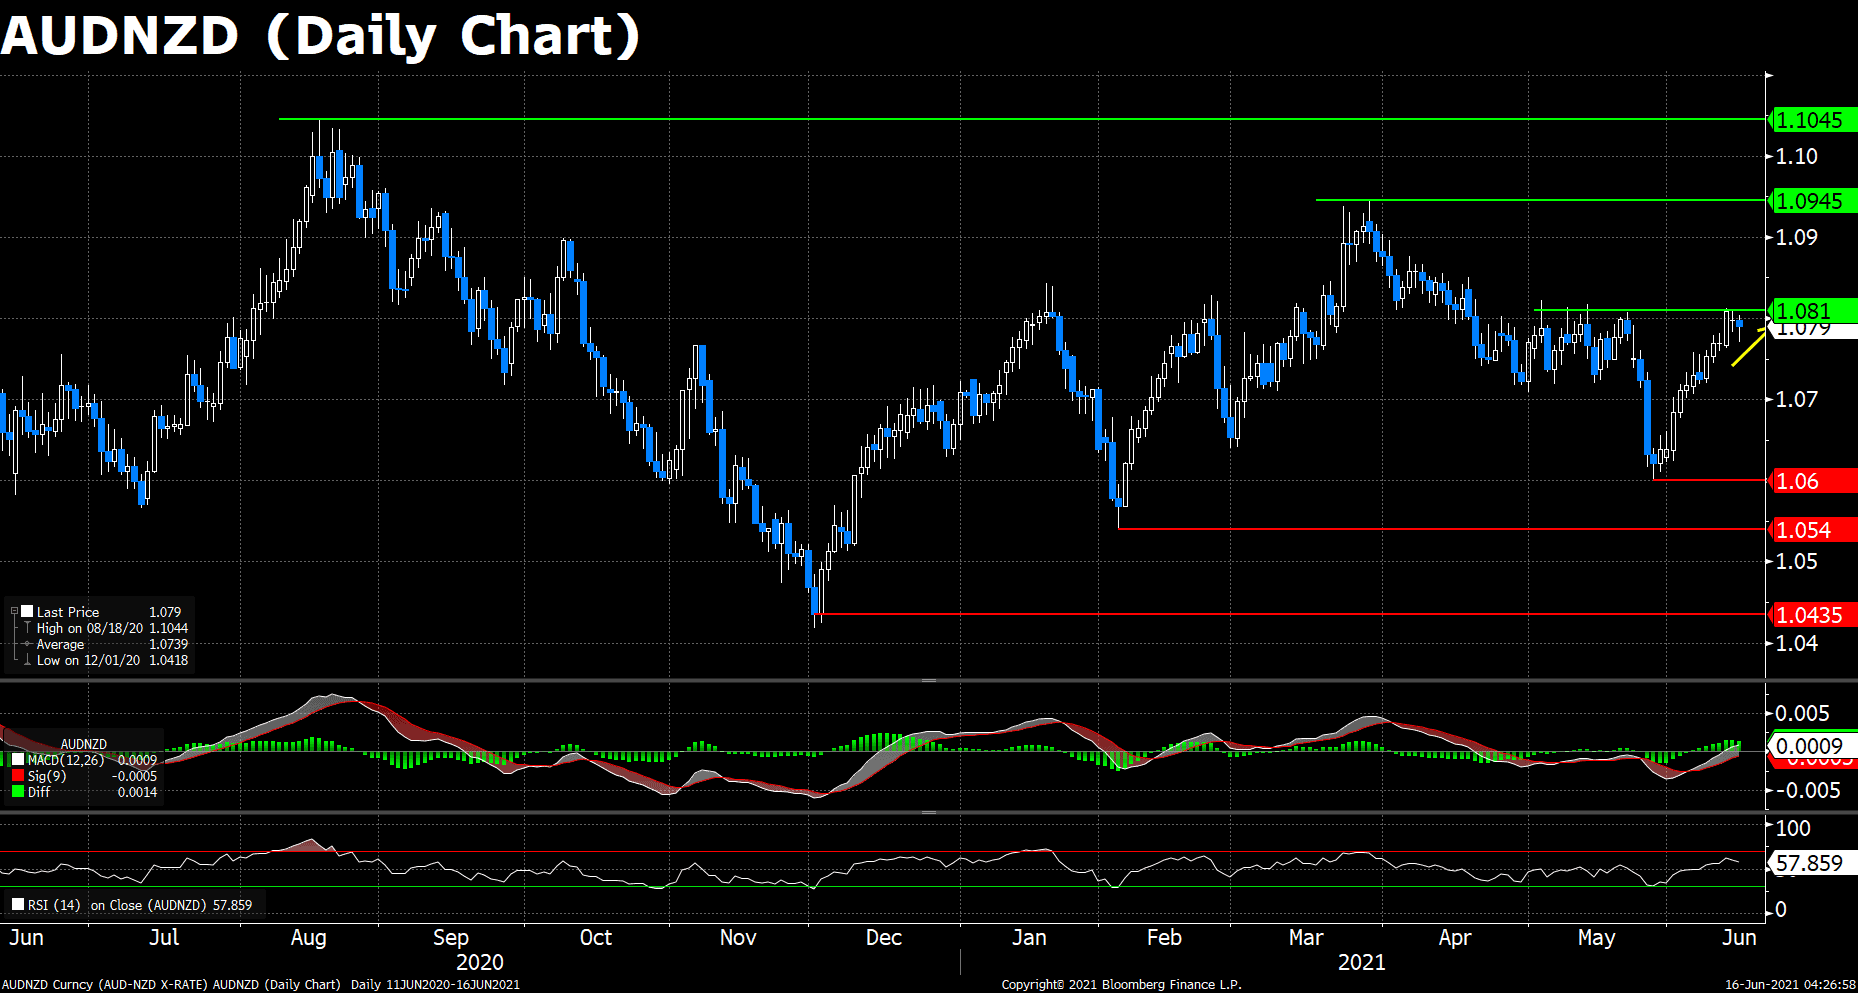
AUDNZD was rejected by the 1.081 resistance last Friday and slipped below 1.080 at the beginning of the week, traded 1.0794 as of writing. The Australian dollar got slightly weaker on the dovish RBA meeting minutes as the policymakers suggested no rush to taper, albeit emerging reflation.
However, due to the technicals, the bullish sentiment seems to resume a little more time, as the RSI indicator still haven’t reached the overbought territory, and the MACD histogram remain positive. The strong 1.081 resistance level is the key. If breached, then, at least in the short term, the upside traction will still prevail.
Resistance: 1.081, 1.0945, 1.1045
Support: 1.060, 1.054, 1.042
Economic Data
|
Currency
|
Data
|
Time (GMT + 8)
|
Forecast
|
|
GBP
|
CPI (YoY) (May)
|
14:00
|
1.8%
|
|
CNY
|
Industrial Production (YoY) (May)
|
15:00
|
9.0%
|
|
USD
|
Building Permits (May)
|
20:30
|
1.730M
|
|
CAD
|
Core CPI (MoM) (May)
|
20:30
|
0.4%
|
|
USD
|
Crude Oil Inventories
|
22:30
|
-3.290M
|
|
USD
|
FOMC Meeting Minutes
|
02:00 (June 17)
|
|
|
USD
|
FOMC Statement
|
02:00 (June 17)
|
|
|
USDD
|
Fed Interest Rate Decision
|
02:00 (June 17)
|
|
|
|
|
|
|
|
|
|
|
|
|
|
|
|
|
|
|
|
|
|


