May 27, 2021
Daily Market Analysis
Market Focus
Another quiet day in US equities market, with the big three indices edged marginally higher amid thin liquidity on Wednesday. Within the S&P 500 index, we saw better performance in Consumer Discretionary sector, while Health Care shares trailed behind.

A report from Fitch Ratings suggests the US labor market will take about a year and a half to recover from pandemic’s impact. Unemployment rate will not return to their ‘natural’ rate of 4.3% until the last quarter of 2020.
Iran bans bitcoin mining as the nation face power shortages. Major cities are having difficulty supplying electricity, and government officials are putting the blame on illegal cryptocurrency mining. Statistics showed that around 4.5% of bitcoin mining between January and April took place in Iran, according to blockchain analytics firm Elliptic. The negative headline did little impact to Bitcoin’s price, which rallied roughly 1% to $38,674.
Reserve Bank of New Zealand left its cash rate unchanged at 0.25%, and here are Bloomberg’s key takeaways from RBNZ’s meeting:
• The central bank projected that its official cash rate may start to rise in the second half of next year after it reinstated a forward track for the average OCR showing it starting to rise in mid-2022.
• Kept bond-purchase program at NZ$100 billion.
• Governor Adrian Orr said the outlook for rate hikes depends on how the economy plays out.
• The bank expects inflation to weaken to 1.5% by mid-2022 before gradually climbing back to 2% in 2023.
Main Pairs Movement:
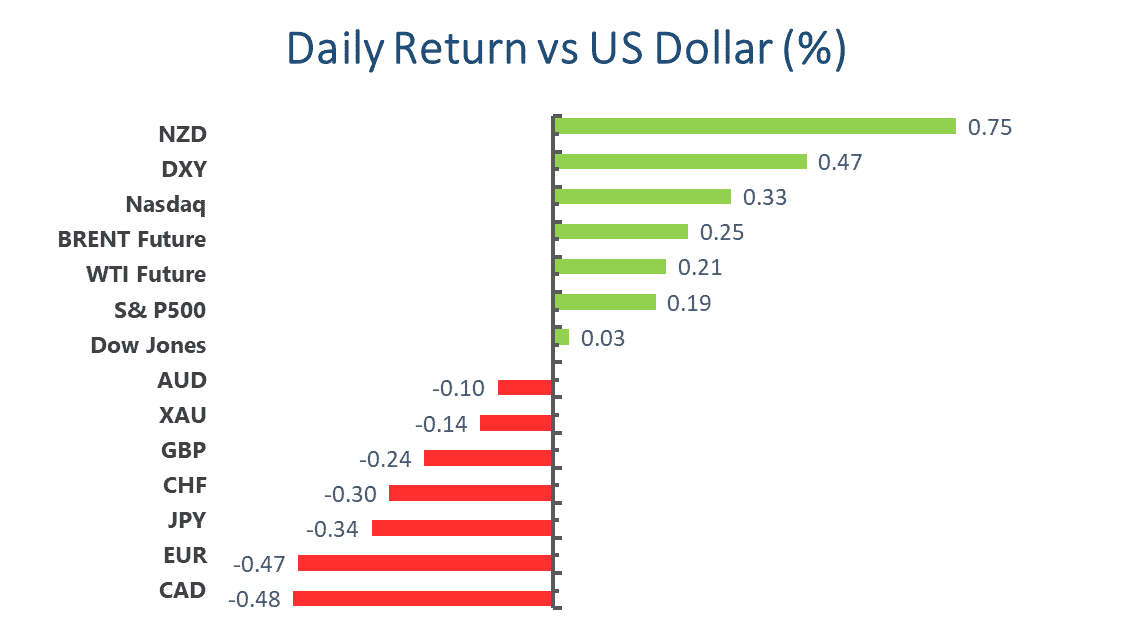
The US dollar is rebounding across the board today with dollar index up 0.45%, regaining its 90 handle. Euro dollar plunged 0.5%, and essentially gave back all of its gains in the last two days, closed the day just south of 1.22. The 10-year US treasury yield was up 1%, trading at 1.577%.
Cable is also facing some headwinds, slipped 0.2% near closing time. With strong fundamentals such as leading progress in vaccine distribution and optimistic business mood acting as a backdrop, the Sterling was able to withhold dollar’s rebound better than its European peer. Economic docket will be dollar dominated for the rest of this week, key data like US GDP and Pending Home Sales will be out on Thursday.
Kiwi was the best performer against the dollar greenback as RBNZ lift their projection in the second half of 2022. It is the second central bank to send out hawkish signal, the first being BoC. Kiwi promptly surge 1.1% after the announcement, went as far as 0.7316. On the other hand, its antipodean peer Aussie initially ride with RBNZ’s positive shock, but all gains were pared by recovering dollar, closed the day down 0.1%.
USDCAD continues to rebound after failed to break the 1.2022 support, climbed 0.4% on Wednesday. However, the bounce may be temporary as oil prices are advancing further, the WTI crude oil futures reclaimed $66 and Brent futures are getting closer to $69. Oil price will be closely monitored since it can used as a proxy for future inflation, persistent biddings may indicate rapid economic activities, hence leading to high inflation figures.
Technical Analysis:
AUDNZD (Daily Chart)

The knee-jerking reaction in AUDNZD was triggered by RBNZ’s hawkish tone, though the interest rate was left unchanged. The pair plunged nearly 1% on Wednesday, refreshed the largest one-day loss since last March. Price pierced through 61.8% Fibonacci support of 1.064 and look to contest a low point at 1.053. Some traders were probably expecting a positive shift in RBNZ’s narrative at the beginning of this week, thus the dynamic upward support line was already under attack earlier. Given the magnitude of this decisive breakout, it really sets the bearish trading sentiment in the coming month, unless RBA can pull off something similar. There is a chance for price to revisit 1.064, which would be healthy for the longer-term trend.
Resistance: 1.0643, 1.0725, 1.082
Support: 1.057, 1.052, 1.0433
USDCHF (Daily Chart)

USDCHF has been on a rather steep decline since April, retreated 5.7% from a yearly high of 0.947. The south travel was mostly dominated by sellers, no sight of any significant rebounds in the last two months. Price already breached the 23.6% Fibonacci support of 0.9, and now eyes for another crucial level at 0.884 on the downside. It would take huge dedications from the bulls to push price back above 0.91 handle in order to reverse this strong selling bias. Otherwise, the pair will remain subdued, which resonates with MACD bearish signal.
Resistance: 0.9, 0.908, 0.9154
Support: 0.889, 0.884, 0.878
XAUUSD (Daily Chart)

Gold ramped up to $1900 mark earlier than we’ve expected, even advanced to $1913 during mid-day. The constantly leg up in the precious metal is probably associated with institutional inflows like hedge funds and ETFs. We still expect some form of correction coming, likely receding toward the 38.2% Fibonacci level at $1847. With big players bulking their Gold positions against flying inflation, the pullback in Gold will be bumpy ahead. On the upside, there are quite some open spaces to capitalize on, the nearest resistance lays around $1955, next to a big round $2000. RSI indicated Gold is overheated, which also echo with our short-term correction theory.
Resistance: 1955, 2000
Support: 1847, 1815, 1782
Economic Data
|
Currency
|
Data
|
Time (GMT + 8)
|
Forecast
|
|
USD
|
Core Durable Goods Orders (MoM) (Apr)
|
20:30
|
0.8%
|
|
USD
|
GDP (QoQ) (Q1)
|
20:30
|
6.5%
|
|
USD
|
Initial Jobless Claims
|
20:30
|
425K
|
|
USD
|
Pending Home Sales (MoM) (Apr)
|
22:00
|
0.8%
|
|
|
|
|
|
|
|
|
|
|
|
|
|
|
|
|
|
|
|
|
|
|
|
|
|
|
|
|
|
|
|
|
|
|
|
|


