


Bitcoin closed August bruised but not broken. On 12 August, the cryptocurrency carved out a new all-time high of 124,492 dollars, only to tumble back to 107,340 dollars by month’s end.
These kinds of sharp reversals are nothing new in Bitcoin’s story. The market has always swung between euphoric climbs and sudden flush-outs, shaking off leveraged excess before testing how much conviction remains in its buyers.
Liquidity Still Strong
The liquidity backdrop is still powerful. From November 2024 through August 2025, more than 67 billion dollars in fresh stablecoins have entered circulation across USDT, USDC, and EURC.
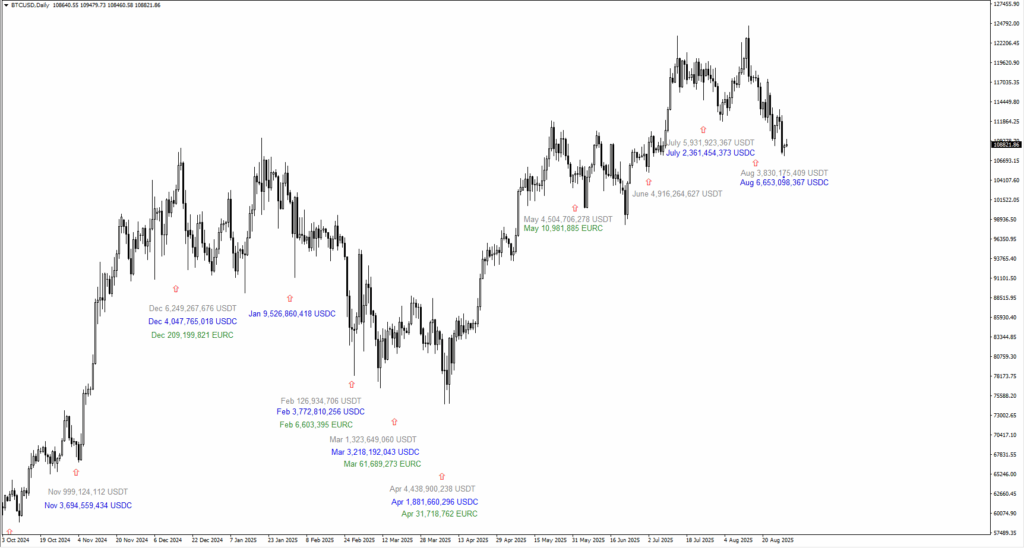
December 2024 alone delivered over 10 billion dollars in new issuance, January followed with 9.5 billion, while July and August together added another 18 billion.
By late August, the total stablecoin market cap hit fresh records, with USDT standing at 167.3 billion dollars, USDC at 70.6 billion, DAI at 5.4 billion, and FDUSD at 1.45 billion, for a combined total near 245 billion.
Including smaller issuers, the figure rises above 275 billion dollars.
That mountain of liquidity remains “dry powder” that could flow into Bitcoin once confidence returns.
Institutions remain the other side of this equation. July was explosive, with U.S. spot Bitcoin ETFs pulling in around 6 billion dollars of inflows and total crypto ETFs capturing a record 12.8 billion dollars.
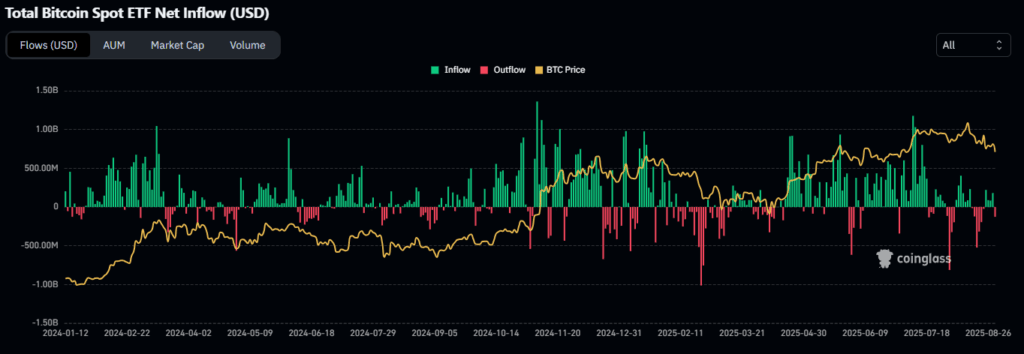
This surge of demand carried Bitcoin through the 120,000 dollar barrier.
Then August hit with an opposite force. Spot ETFs bled capital, including a single-day 2.6 billion dollar redemption from BlackRock’s IBIT, dragging Bitcoin down by 16,000 dollars in parallel.
The story here is one of pacing. Daily ETF flows are volatile, monthly flows shape momentum, and cumulative flows define the trend. Despite August’s pain, the bigger picture shows net institutional buying for 2025 still intact.
The forecast is cautious: more outflows are possible if volatility remains elevated, but the broader current still runs toward accumulation, not abandonment.
Seasonal Patterns Point to Q4
Seasonality leans bullish into year-end. Bitcoin has a history of weakness in August and September, followed by strength in October and November.
On average, October has brought gains above 20 percent and November over 40 percent. August has indeed ended negative this year, consistent with the pattern.
If Bitcoin can weather September without slipping through support, the stage is set for another Q4 push. The caveat is that history rhymes but does not repeat with certainty, and macro conditions may yet disrupt the seasonal script.
Technical levels remain tight. Bitcoin is now battling with the 110,000 dollar threshold, which flipped from support to resistance.
Liquidity maps show heavy supply stacked between 109,000 and 110,000 dollars, which means rallies into this range will face pressure from trapped longs trying to exit.
On the downside, liquidity clusters thicken at 108,000 and 107,000 dollars. A decisive move above 110,000 would steady the structure and tilt momentum back to the upside.
Failure could see price slide toward 105,000 dollars or even deeper, marking those levels as critical lines in the sand.
Traders Brace for Impact
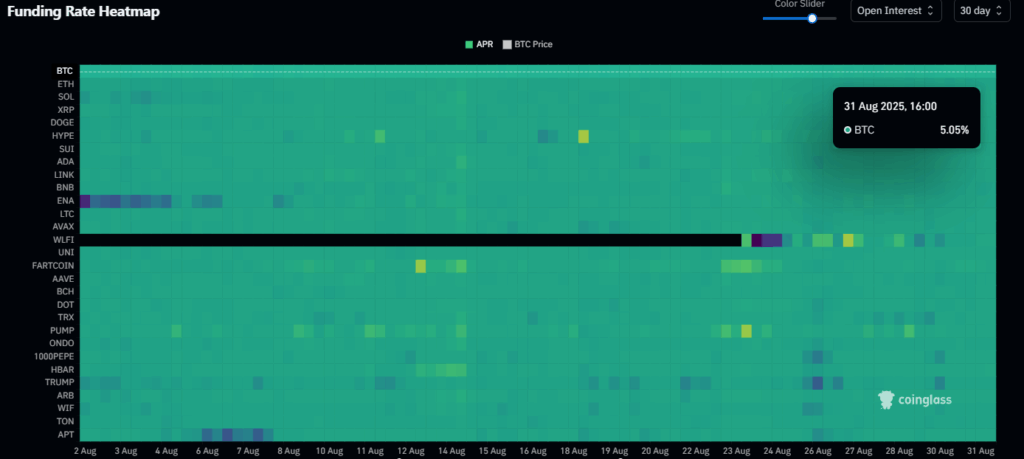
Sentiment has cooled without collapsing. The Fear and Greed Index sits at 40, reflecting nervousness but not despair. Perpetual futures funding rates are only slightly positive, suggesting a market modestly tilted long but far from overheating.
This is the anatomy of a reset: exuberance flushed, leverage contained, but no full capitulation. It gives Bitcoin room to stabilise, though it also signals hesitation as traders wait for clearer direction.
August has tested conviction. Yet the structural pillars of this cycle remain: abundant liquidity, net-positive institutional flows, and favourable seasonality into year-end.
The market’s fate now hinges on whether Bitcoin can hold its footing near 107,000 dollars and reclaim the 110,000 zone. Success would invite another run at 124,000 dollars before 2025 closes, while failure could expose it to another leg down toward 105,000 dollars.
Key Movements of the Week
The new week opens with the US Dollar Index locked in a holding pattern. Prices have lingered around the same area since Friday, showing little appetite for a decisive move.
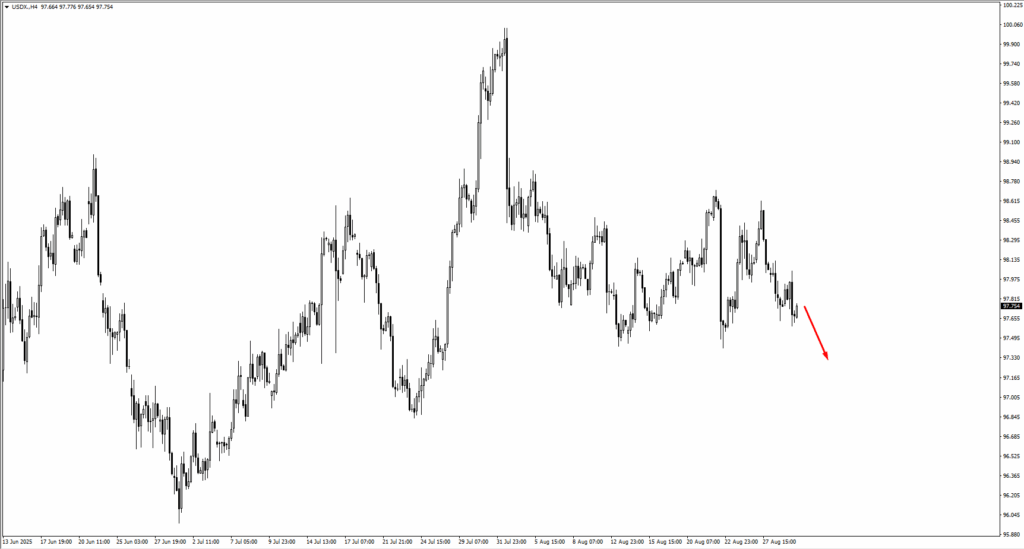
Traders are watching the 97.409 swing low, a level that, if broken, could pull the index lower toward 97.35.
For now, the lack of momentum signals indecision, but any sharp shift in data or sentiment may push the dollar out of its narrow corridor.
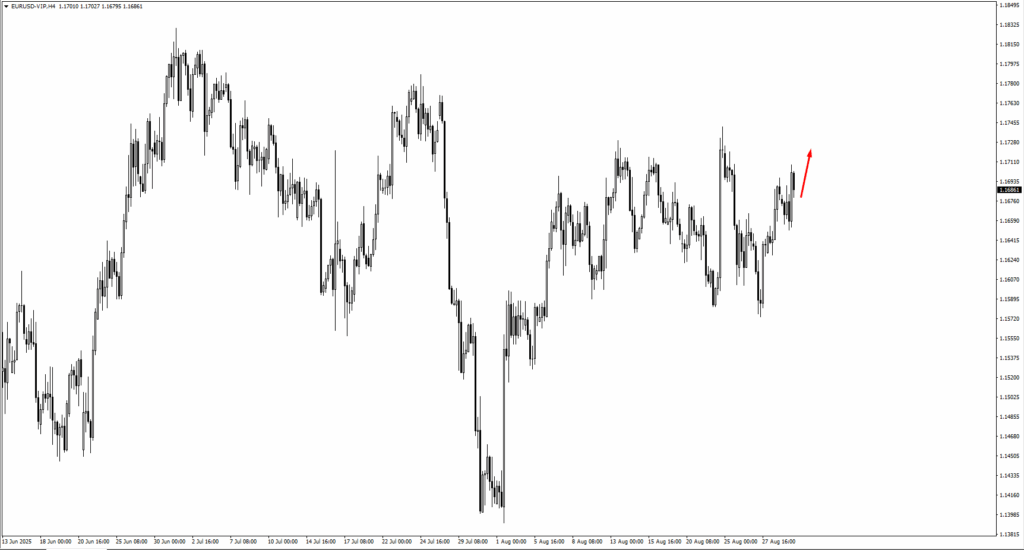
In Europe, the single currency mirrors the dollar’s pause. EURUSD trades close to Friday’s levels, though the charts suggest that a lift toward 1.1755 would be the next zone to monitor.
Sterling also sits in a pivotal position. GBPUSD dipped but failed to crack through 1.35435. If buyers step in and drive it higher, the 1.3555 mark becomes the line to watch for signs of strength.
Across the Pacific, USDJPY drifts lower, and eyes are set on whether 146.208 will give way. A break beneath that level could invite deeper downside.
USDCHF also trends down, with traders marking 0.7960 as the key checkpoint.
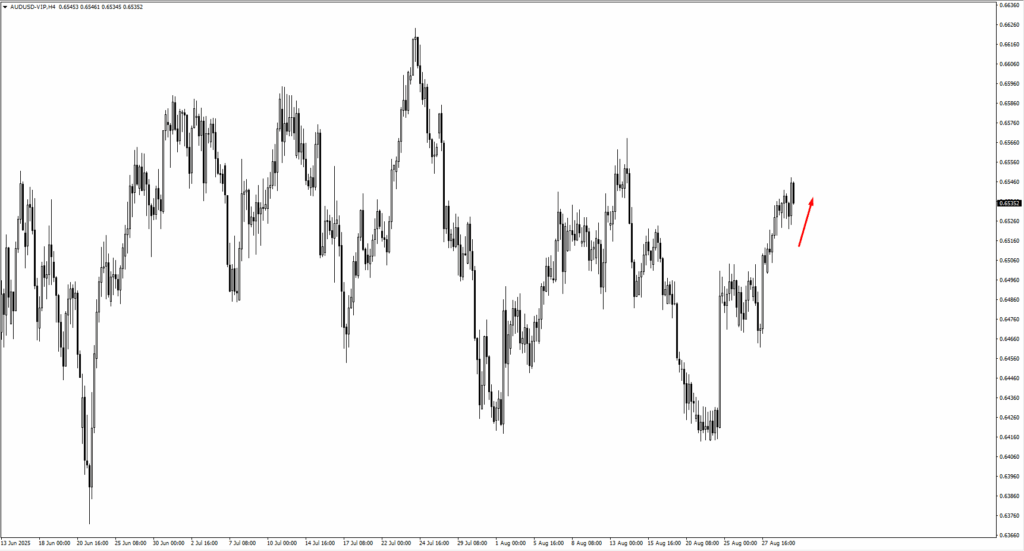
The Australian dollar is testing nerves at 0.6550. Sellers have held ground here, but if the price edges upward, 0.6570 offers the next area of interest. New Zealand’s dollar is climbing instead, with 0.5920 as its near-term target.
North America tells a mixed story, as USDCAD trades around 1.3735. Consolidation is evident, and should the pair slip lower, the 1.3700 handle could come into play.
Commodities, meanwhile, are showing more rhythm. Oil appears to be consolidating after recent swings. Traders have an eye on 66.45, where bearish price action could reassert itself should prices rise.
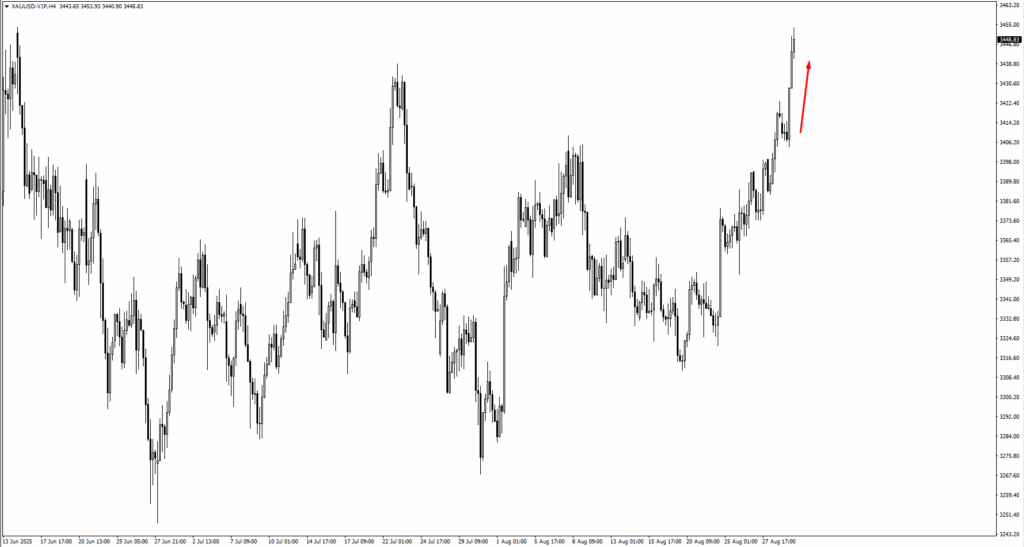
Gold, by contrast, has found traction. After pausing around 3,420 dollars, it pressed higher, with the next challenge set at 3,470 dollars.
Silver continues its own march upward, with momentum favouring the bulls. If a consolidation phase emerges, the 38.75 level will serve as the staging ground for the next push.
Natural gas is also climbing, having rebounded from 2.80. The market now leans toward testing 3.04. Energy traders will be alert to whether this move holds or fades under fresh supply pressures.
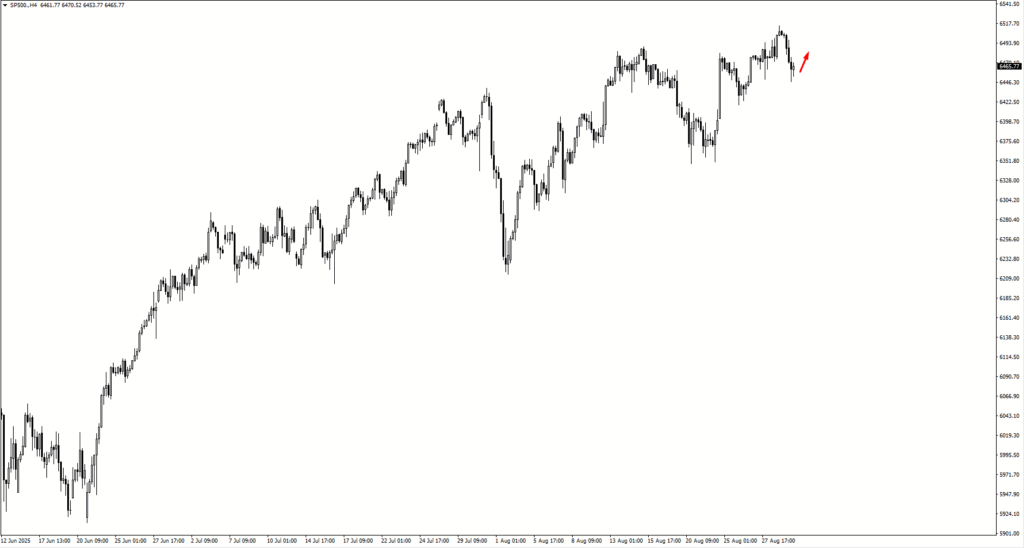
In equities, the S&P 500 retreated from the psychological 6,500 mark before settling. If it manages to rise again, traders are watching the 6,485 area for the quality of price action. A close above 6,497 could open the path to 6,630 or even 6,730.
Nasdaq tells a similar tale. It slipped from 23,780, but the focus now shifts to 23,600. Should it close above 23,700, momentum would likely swing back to the upside.
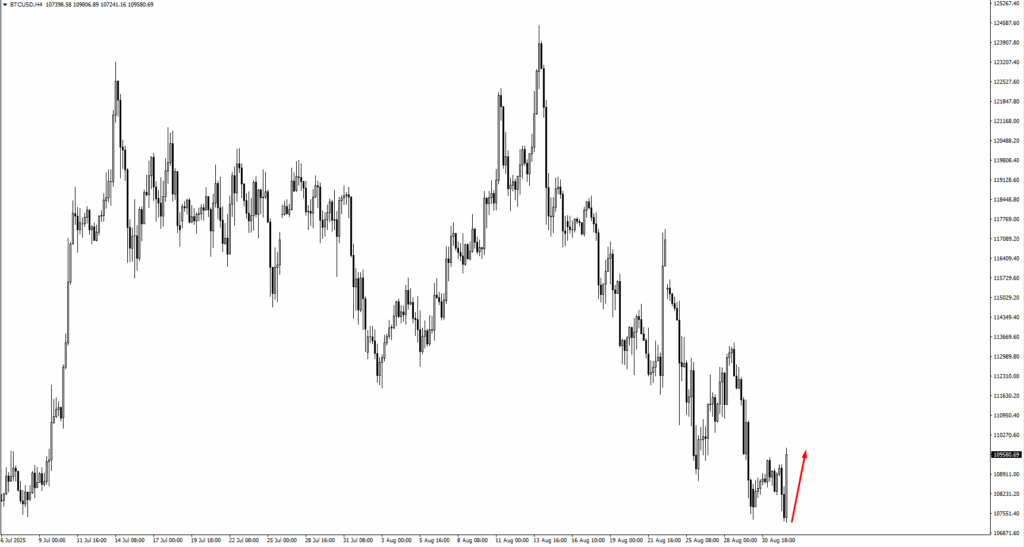
Bitcoin holds the spotlight among digital assets. It found footing at 107,245 but remains fragile. If the price makes a lower low, the market will eye 105,700 and even 101,400 as the next potential landing spots.
Ethereum has its own test ahead, with the 4,585 mark acting as the key pivot for traders seeking confirmation of renewed strength.
Among individual stocks, UnitedHealth shows potential consolidation. If support holds, bulls may look to 270 for a fresh entry, with intrinsic value estimates climbing as high as 410 on recent earnings.
Novo Nordisk, trading above 55.37, also signals the possibility of a fresh leg higher. Analysts now place its intrinsic value around 90, suggesting that investors still see more room in its climb.
The week is set against a backdrop of fragile confidence. Many assets hover around support or resistance, waiting for data or sentiment to tip the balance.
Key Events of the Week
Activity starts to pick up on Tuesday, 2 Sep, when the US releases its ISM Manufacturing PMI. Forecasts point to a reading of 48.9, slightly higher than July’s 48.0.
Wednesday, 3 Sep, brings a pair of releases that could move different corners of the market. Australia’s GDP is expected to show growth of 0.5 percent quarter-on-quarter, an improvement over the previous 0.2 percent. In the US, JOLTS Job Openings are projected at 7.24 million, down from 7.44 million. The labour market remains a focal point for traders and policymakers alike.
Thursday, 4 Sep, shifts attention back to US services, with the ISM Services PMI forecast at 50.5 compared to the previous 50.1. This sits just above the expansion line and could reinforce the picture of an economy slowing but not yet stalling. Traders will be watching whether the reading provides relief for the dollar or continues to paint a cautious outlook.
Friday, 5 Sep, closes the week with the headline jobs report. Non-Farm Employment Change is expected at 74,000, just above the prior 73,000. The unemployment rate is forecast to tick up to 4.3 percent from 4.2 percent. Together these figures underline a gradual softening in the labour market.


