





Key Takeaways:
- The commodity channel index (CCI) is a momentum oscillator that measures how far price has moved from its average.
- It was created by Donald Lambert in 1980 and works on forex, gold, indices, shares and crypto CFDs.
- Readings above +100 signal strong momentum, while readings below -100 signal weakness. The zero line marks the shift between the two.
- The CCI works best with a clear plan, a second indicator and sound risk management, not on its own.
The commodity channel index is one of the most flexible tools in technical analysis. Yet, many traders still misread it. Some utilise it as a simple overbought and oversold gauge. Others avoid it on shares because of the name. Both miss most of what the indicator can do.
This guide explores the commodity channel index in an easy way to understand. You will study what it measures, how it is calculated, and how to read its signals. Lastly, you will discover how to build a simple commodity channel index strategy around it.
What Is the Commodity Channel Index (CCI)?
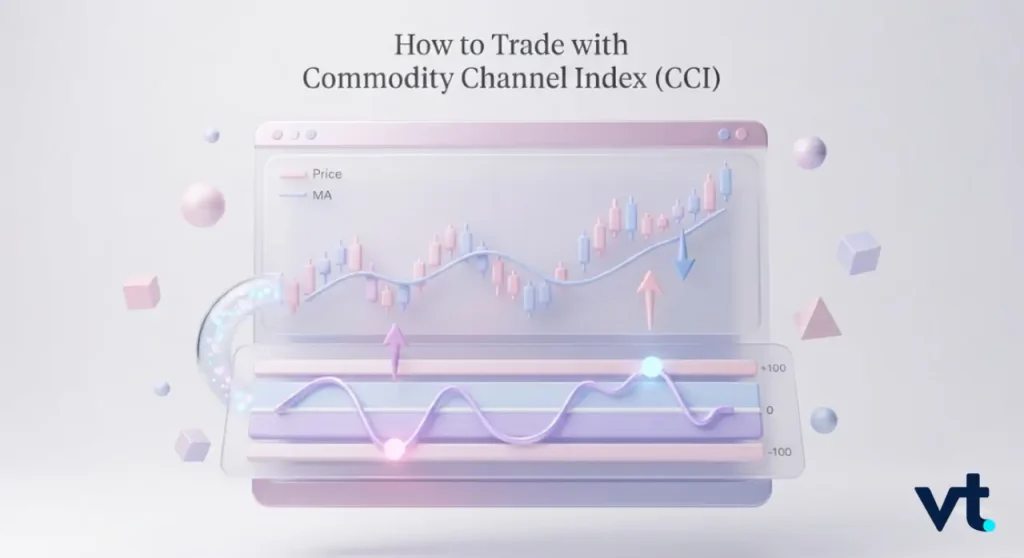
The commodity channel index is a momentum oscillator. It compares the current price to an average price over a set period. When prices run far above that average, the CCI rises. When price drops far below it, the CCI falls. Long story short, it tells you how stretched a market is from its own normal.
What Does CCI Stand for and What Does It Measure
CCI stands for commodity channel index. Despite the name, it does not only measure commodities. It measures the distance between price and its simple moving average, scaled by how volatile that market has been. A high reading means the price is unusually far above average. A low reading means the opposite.
Who Created the Commodity Channel Index
The commodity channel index was created by Donald Lambert, a technical analyst. He introduced it in the October 1980 issue of Commodities magazine, now called Futures. Lambert built it to spot cyclical turns in commodity prices. Traders soon found it worked just as well on shares, indices and currencies.
Is the CCI a Momentum Indicator or a Trend Indicator
This point trips up a lot of people. The CCI is mainly a momentum indicator, but it doubles as a trend tool.
- As a momentum tool, it flags when a move is stretched and losing steam.
- As a trend tool, sustained readings above +100 or below -100 confirm trend strength in one direction.
That dual nature is why it appears in so many strategies.
Which Markets Can the CCI Be Used On
One of the biggest strengths of the commodity channel index is its flexibility. You can apply it to almost any market with price data, including:
- Forex pairs such as EUR/USD and GBP/USD
- Gold, silver and oil
- Stock indices like the US 500 and US Tech 100
- Individual share CFDs
- Cryptocurrency CFDs such as BTC/USD
How the Commodity Channel Index Is Calculated
You do not need to calculate the CCI by hand. Your platform does it for you. Still, understanding the maths helps you trust the signal and tune your settings with intent.
What Is the Commodity Channel Index Formula
The commodity channel index formula looks scary at first, but it breaks into simple parts:
CCI = (Typical Price − SMA of Typical Price) / (0.015 × Mean Deviation)
In plain terms, you take how far today’s price sits from its average, then divide by a measure of recent volatility. The result is a single, readable number that oscillates around zero.
What Is the Typical Price in the CCI
The typical price is the heart of the calculation. It is simply the average of the high, low and close for each period.
Typical Price = (High + Low + Close) / 3
For example:
If a candle prints a high of 25.20, a low of 24.80 and a close of 25.00, the typical price is (25.20 + 24.80 + 25.00) / 3 = 25.00.
To see the full formula in action, here is a worked example. Standard settings use 20 periods, but a 5-period version is easier to read.
| Period | Typical Price | Distance from average |
| 1 | 20 | 2 |
| 2 | 21 | 1 |
| 3 | 22 | 0 |
| 4 | 23 | 1 |
| 5 (current) | 24 | 2 |
The calculation runs in three quick steps:
- Simple moving average of typical price = (20 + 21 + 22 + 23 + 24) / 5 = 22
- Mean deviation = (2 + 1 + 0 + 1 + 2) / 5 = 1.2
- CCI = (24 − 22) / (0.015 × 1.2) = 2 / 0.018 = +111
A reading of +111 sits above +100. That points to strong upward momentum.
Why the 0.015 Constant Is Used
The 0.015 figure is a scaling constant. Lambert chose it so that roughly 70 to 80 per cent of readings fall between -100 and +100. Without it, the numbers would be hard to compare across markets. With it, +100 and -100 become meaningful reference lines on any chart.
Is the CCI Bounded or Unbounded
Unlike some oscillators, the CCI is unbounded. It has no fixed ceiling or floor. Readings of +250 or -300 are possible in fast markets. This matters for two reasons:
- It can show extreme momentum that capped indicators would hide.
- It also means fixed overbought and oversold levels are guides, not hard limits.
How to Read Commodity Channel Index Signals
Reading the commodity channel index comes down to three zones: above +100, below -100, and around zero. The chart below shows how the line moves through these zones on a live market.
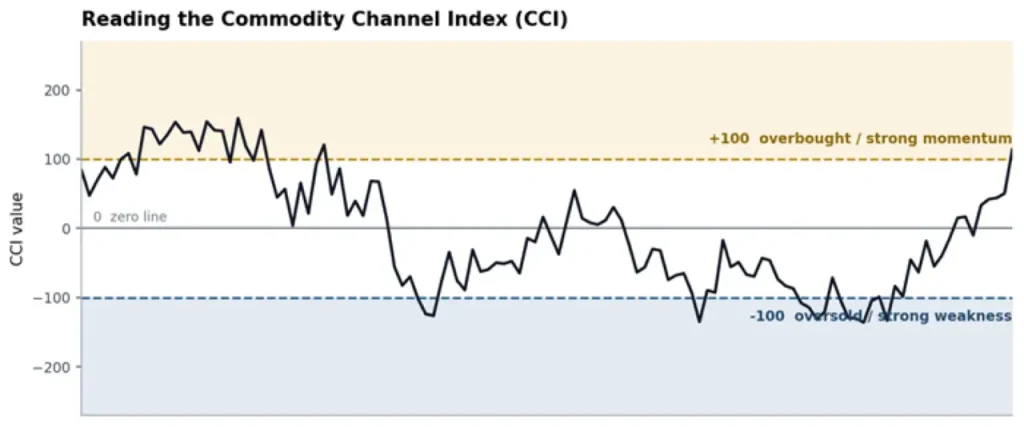
CCI signal zones chart
Here is a quick reference for what each reading suggests.
| CCI reading | What it suggests |
| Above +100 | Strong upward momentum, possible new uptrend |
| Below -100 | Strong downward momentum, possible new downtrend |
| Around 0 | Balance, with price near its average |
| Above +200 | Overextended to the upside, reversal risk rising |
| Below -200 | Overextended to the downside, bounce risk rising |
What Does a CCI Reading Above +100 Mean
A move above +100 shows price is well above its average. Lambert read this as a buy signal and a sign of an emerging uptrend. In practice:
- A first push above +100 often marks the start of strong momentum.
- Very high readings above +200 warn the move may be overstretched.
What Does a CCI Reading Below -100 Mean
A drop below -100 is the mirror image. Price sits well below its average, which points to strong selling. Lambert treated this as a sell signal. Deep readings below -200 flag a possibly oversold market that could bounce.
What Does a CCI Reading of Zero Mean
The zero line is the average itself. When the CCI crosses zero, price has moved from one side of its average to the other. A cross above zero hints at building bullish momentum. A cross below zero hints at bearish momentum. This is the basis of the zero-line crossover method covered below.
What Are CCI Overbought and Oversold Levels
As the CCI is unbounded, overbought and oversold levels are flexible. Common choices are:
- ±100 for active, shorter-term trading
- ±200 for calmer, higher-quality reversal signals
Wider levels give fewer but cleaner trading signals.
What Is CCI Divergence (Bullish and Bearish)
CCI divergence is one of its most powerful signals. It appears when price and the CCI disagree.
- Bullish divergence: price makes a lower low, but the CCI makes a higher low. Selling pressure is fading.
- Bearish divergence: price makes a higher high, but the CCI makes a lower high. Buying pressure is fading.
Divergence often warns of price reversals before they show on price alone.
Best Commodity Channel Index Settings by Trading Style
There is no single best setting. The right commodity channel index settings depend on your timeframe and goals.
1. What Is the Standard CCI Period
The standard period is 20, and most platforms use it by default. A 14-period setting is another common choice. A shorter period reacts faster but produces more noise. A longer period is smoother but slower to react.
2. Best CCI Settings for Scalping and Day Trading
Fast traders want speed. A common question is is CCI good for scalping, and the answer is yes, with tighter settings.
- Scalping: try a 7 to 14 period on 1 to 5 minute charts
- Day trading: try a 14 to 20 period on 15 minute to 1 hour charts
Shorter periods catch quick momentum, but they need strict risk control.
3. Best CCI Settings for Swing and Position Trading
Slower styles suit longer settings.
- Swing trading: 20 to 30 period on 4 hour and daily charts
- Position trading: 30 to 50 period on daily and weekly charts
Longer periods filter out noise and focus on major turns.
4. Adjusting CCI Levels for Volatile Assets
On volatile markets like gold or crypto, the ±100 levels can trigger too often. Widening the bands helps. The table below sums up sensible starting points.
| Trading style | CCI period | Timeframe | Suggested levels |
| Scalping | 7–14 | 1–5 min | ±100 |
| Day trading | 14–20 | 15 min–1 hr | ±100 to ±150 |
| Swing trading | 20–30 | 4 hr–daily | ±100 to ±200 |
| Position trading | 30–50 | daily–weekly | ±200 |
How to Trade Using the Commodity Channel Index
Here are the core methods, plus a simple commodity channel index strategy you can test on a demo account.
1. The Trend or Breakout Method
- Wait for the CCI to push above +100 for longs, or below -100 for shorts.
- Enter in the direction of the breakout.
- Exit when the CCI falls back inside the ±100 band.
This method follows momentum rather than fighting it.
2. The Zero-Line Crossover Method
- Go long when the CCI crosses above zero.
- Go short when it crosses below zero.
- Use it mainly in trending markets, where crossovers are cleaner.
3. The Divergence Method
- Spot bullish or bearish CCI divergence against price.
- Wait for the CCI to cross back through ±100 as confirmation.
- Place a stop beyond the recent swing high or low.
Divergence trades aim to catch reversals early, so confirmation matters.
4. How to Combine CCI with Other Indicators
The CCI works best with a partner that confirms its signals. A pro tip is to keep it simple and avoid crowding the chart.
- Pair it with a moving average to trade only in the trend direction.
- Add support and resistance to time entries with more precision.
- Use volume to confirm breakouts.
On a MetaTrader 4 or MetaTrader 5 platform such as VT Markets, you can stack these indicators on one chart in seconds.
5. Best Timeframe for the CCI
There is no single best timeframe. Match it to your style:
- Scalpers: 1 to 5 minutes
- Day traders: 15 minutes to 1 hour
- Swing traders: 4 hour to daily
A useful pro tip is multi-timeframe analysis. Check the trend on a higher timeframe, then time your entries on a lower one. This keeps you trading with the bigger move, not against it.
CCI Versus Other Indicators
The commodity channel index overlaps with other oscillators, but each one has its own personality.
| Indicator | Type | Range | Best for |
| CCI | Momentum oscillator | Unbounded | Momentum, breakouts, divergence |
| RSI | Momentum oscillator | 0 to 100 | Overbought and oversold |
| Stochastic | Momentum oscillator | 0 to 100 | Reversals in ranges |
| MACD | Trend and momentum | Unbounded | Confirming trend shifts |
CCI Versus RSI
Both measure momentum. The key difference is range. The Relative Strength Index (RSI) is bounded between 0 and 100. The CCI is unbounded, so it reacts faster to sharp moves. RSI suits range trading, while CCI suits momentum and breakouts.
CCI Versus Stochastic Oscillator
The stochastic oscillator focuses on where the close sits within a recent range. It shines in sideways markets. The CCI reacts more to the size of a move, so it handles trends better.
CCI Versus MACD
The Moving Average Convergence Divergence (MACD) tracks the relationship between two moving averages. It is slower and better at confirming an established trend. The CCI is faster and better at spotting early momentum. Many traders run both together.
Can You Use CCI and RSI Together
Yes, and it is a popular combination.
- Use the CCI to spot momentum and breakouts.
- Use the RSI to confirm overbought or oversold conditions.
When both agree, the signal is stronger. When they disagree, it pays to stay cautious.
Find out more why more indicators are not better on your charts.
Limitations of the Commodity Channel Index
No indicator is perfect. Knowing the weaknesses of the commodity channel index keeps you realistic and helps you avoid painful mistakes.
Is the CCI a Leading or Lagging Indicator
The CCI can act as a leading indicator at extremes and during divergence. But it is built on a moving average, so it also lags. Treat its signals as early warnings, not certainties.
Why the CCI Produces False Signals in Choppy or Volatile Markets
In sideways or wild markets, the CCI whipsaws. It can cross ±100 repeatedly with no follow-through. To reduce false signals:
- Widen the levels to ±200
- Trade only in the direction of the higher-timeframe trend
- Wait for confirmation before entering
Is the CCI a Good Indicator for Beginners
A question new traders often search is is CCI a good indicator to start with. On balance, yes. It is visual, simple to read and works across markets. Beginners should start on a demo account and keep the settings standard until the signals feel familiar.
Why the CCI Should Not Be Used on Its Own
The CCI is a single lens on the market. Used alone, it produces too many false signals. Pair it with trend analysis, support and resistance, and firm risk management. That is the difference between a random signal and a real edge.
Frequently Asked Questions (FAQs)
Q1: What is the commodity channel index (CCI)?
The commodity channel index is a momentum oscillator that measures how far price has moved from its average over a set period. It was created by Donald Lambert in 1980. It helps traders spot momentum, trend strength and possible reversals across forex, commodities, indices and shares.
Q2: What does a CCI above +100 or below -100 mean?
A reading above +100 means price is well above its average, which points to strong upward momentum and a possible uptrend. A reading below -100 means the opposite: strong downward momentum and a possible downtrend. Extreme readings beyond ±200 warn that the move may be overstretched.
Q3: What is the CCI formula?
The commodity channel index formula is CCI = (Typical Price − SMA of Typical Price) / (0.015 × Mean Deviation). The typical price is (High + Low + Close) / 3. The 0.015 constant scales the result so that most readings fall between -100 and +100.
Q4: What is the best CCI setting?
There is no single best setting. The standard 20-period works for most traders. Scalpers often use 7 to 14 periods, while swing and position traders prefer 20 to 50. Match the setting to your timeframe and always test it before trading live.
Start Trading the Commodity Channel Index with Confidence
The commodity channel index is a versatile tool that rewards traders who understand it. It flags momentum, confirms trend strength and warns of reversals, all from one clean line beneath your chart. Used with a plan, a second indicator and disciplined risk control, it can sharpen your timing across almost any market.
The next step is practice. Open a chart, add the CCI, and test the methods above on a demo account before risking real capital. When you are ready to trade live, VT Markets gives you the commodity channel index and dozens of other tools on MetaTrader 4 and MetaTrader 5. You get fast execution across forex, gold, indices and shares, all from one account.
Create a live VT Markets account today to access our platform features, including market insights and educational content.








