On Thursday, the S&P 500 and Nasdaq Composite surged to their highest closing levels since August 2022, driven by ongoing debt ceiling negotiations. The S&P 500 rose by 0.94% to reach 4,198.05, while the Dow Jones Industrial Average ended the day up 0.34% at 33,535.91, and the Nasdaq gained 1.51% to close at 12,688.84. This marked the second consecutive positive session for the major stock indexes. The weekly gains for the indexes were also boosted by the advance, with the Nasdaq leading the way with a 3.3% increase, followed by the S&P 500 up 1.8% and the Dow up 0.7%.
Debt ceiling negotiations remained a focal point for Wall Street, with House Speaker Kevin McCarthy expressing optimism that a deal could be reached before a House vote next week. Traders appeared to be cautiously optimistic, looking past some of the drama surrounding the negotiations. The positive market sentiment was supported by strong financial results from retail giant Walmart, which saw its stock rise by 1.3% after beating Wall Street forecasts and raising its full-year performance expectations. However, the market’s sentiment was somewhat tempered by comments from Dallas Fed President Lorie Logan, who indicated that the latest economic data does not warrant a pause in rate hikes yet, suggesting the possibility of another rate hike at the June policy meeting based on forthcoming inflation and employment data.
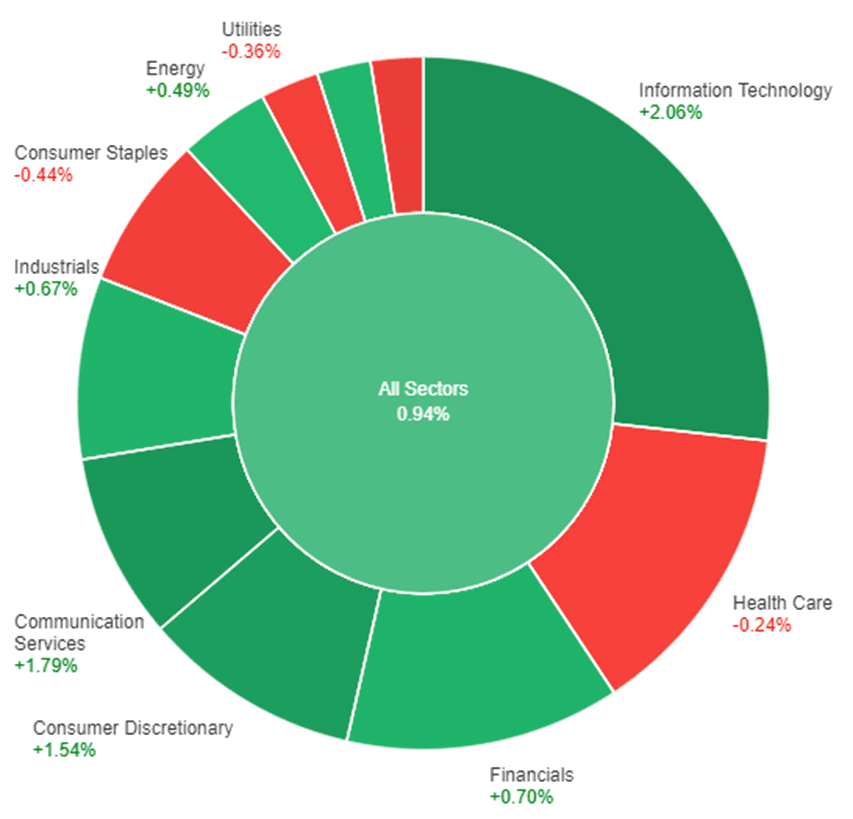
Data by Bloomberg
On Thursday, the stock market experienced overall gains, with the S&P 500 rising by 0.94%. The Information Technology sector performed particularly well, surging by 2.06%, followed by the Communication Services sector, which saw a gain of 1.79%. The Consumer Discretionary sector also showed strong growth, increasing by 1.54%. Financials and Industrials sectors both had more modest gains of 0.70% and 0.67% respectively, while the Materials and Energy sectors experienced smaller increases of 0.55% and 0.49%. However, the Health Care sector saw a decline of 0.24%, and the Utilities and Consumer Staples sectors also experienced losses, down by 0.36% and 0.44% respectively. The Real Estate sector had the largest decline, falling by 0.68%.
Major Pair Movement
The dollar index saw a significant increase of 0.67%, reaching its highest level since May 20. This surge was driven by positive U.S. jobless claims data and reduced concerns about bank and debt defaults. As Treasury yields improved and the outlook for the U.S. economy brightened, the market adjusted its expectations, with the likelihood of aggressive rate cuts in the second half of the year diminishing and the possibility of a rate hike in June increasing.
EUR/USD continued its downward trend, falling below key levels such as the 100-day moving average, the 50% retracement of its March-April rise, and the uptrend line from last year’s lows. Several factors contributed to the euro’s decline, including disappointing economic data in the eurozone, China’s underwhelming reopening after the pandemic, and reduced concerns about banking and Treasury defaults in the United States.
Meanwhile, USD/JPY experienced a surge as Treasury-JGB yield spreads widened and risk appetite improved. The pair surpassed previous peaks and reached halfway between its peak and low from last year. The 0.67% gain in USD/JPY was similar to the dollar’s gains against other major currencies like the yuan, euro, and sterling. However, caution remains as the upcoming Japanese CPI report and the possibility of the Bank of Japan tightening its policies in response to rising inflation could lead to a correction in overbought USD/JPY prices.
Picks of the Day Analysis
EUR/USD (4 Hours)
EUR/USD Continues Downward Trend as US Dollar Strengthens Amid Rate Hike Speculations
The EUR/USD continued its downward trend, dropping for the fifth time in six days. There are no signs of stabilization as the US dollar gains strength in the market. Comments from the Federal Reserve indicating the lack of support for skipping a rate hike at the next meeting boosted US yields, leading to increased expectations of a rate hike (although still below 50%).
Recent US economic data, such as declining Initial Jobless Claims and an improved Philly Fed index, contributed to the strengthening of the US dollar. On the other hand, the European Central Bank’s concerns about inflation in the service sector have reduced expectations of further rate hikes for the Euro. Germany’s upcoming release of wholesale inflation numbers is anticipated to show a decline in the Producer Price Index and a decrease in the annual rate.
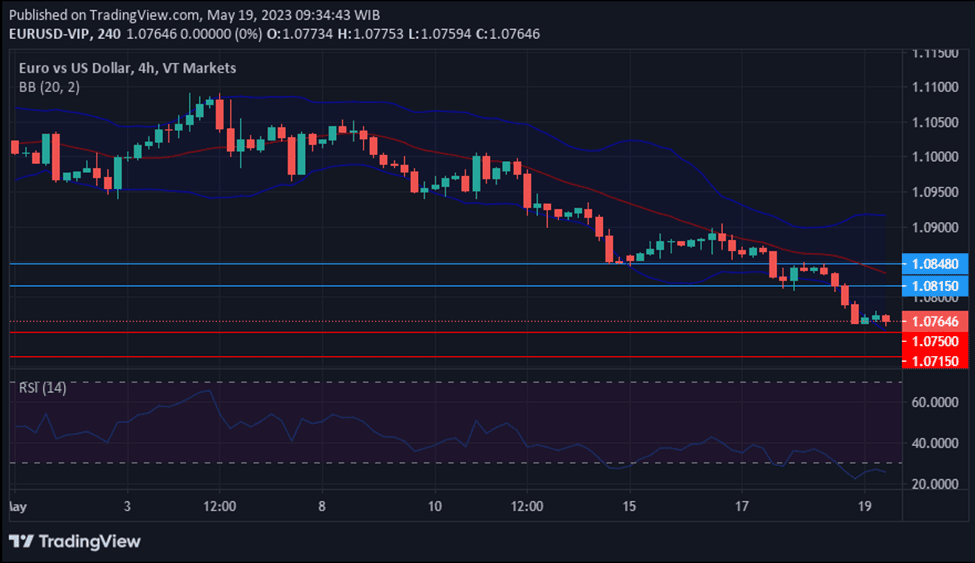
According to technical analysis, the EUR/USD pair is moving lower and creating a push to the lower band of the Bollinger Bands. It is expected that the EUR/USD will make a slight upward move towards the middle band before determining its next direction. The Relative Strength Index (RSI) is currently at 25, indicating an overall bearish trend in the EUR/USD market.
Resistance: 1.0815, 1.0848
Support: 1.0750, 1.0715
XAU/USD (4 Hours)
Gold (XAU/USD) Extends Bearish Route as US Dollar Gains Amid Debt Ceiling Optimism and Hawkish Fed Comments
Spot gold (XAU/USD)continued its downward trend, hitting its lowest level since April 3 at $1,951.92 per troy ounce. Despite optimism in the financial markets regarding the extension of the US debt ceiling, the US dollar remained strong and gained further ground during the American session. House Speaker Kevin McCarthy expressed confidence in reaching a debt limit deal, while Federal Reserve speakers surprised with a hawkish tone, suggesting the possibility of an interest rate hike in June.
Economic data showed better-than-expected initial jobless claims and an improvement in the May Philadelphia Fed Manufacturing Survey, but existing home sales declined in April. US stock indexes traded mixed, with the Nasdaq Composite performing the best, and US Treasury yields rebounded, supporting the strength of the US dollar.

According to technical analysis, XAU/USD continued to fall on Thursday, leading to further downward pressure on the lower band of the Bollinger Bands. There is a possibility that XAU/USD may experience an upward movement towards the middle band of the Bollinger Bands. Currently, the Relative Strength Index (RSI) stands at 23, indicating that XAU/USD is in a bearish trend.
Resistance: $1,974, $1,991
Support: $1,950, $1,934