





Key Points
- The US Dollar Index (DXY) is trading around 102 on 14 October, after retreating from Monday’s 18-month high of 102.37.
- The dollar fell about 0.37% on Tuesday as lower oil prices and shifting Federal Reserve expectations weighed on sentiment.
- US headline CPI is forecast to rise to 3.6% YoY in September, up from 3.4% previously.
- Elevated Treasury yields continue to support the dollar.
- A hotter-than-expected CPI could lift both the dollar and yields, while a softer print may bring renewed selling.
- Gold, EURUSD and USDJPY may see sharper moves as traders reposition after the data.
- Next catalyst will be the US CPI (14 October), followed by US PPI on 15 October.
Market Move
The dollar’s rally to an 18-month high of 102.37 on Monday lost its winning streak on Tuesday. DXY slipped roughly 0.37% as falling oil prices eased some inflation concerns and Federal Reserve expectations shifted.
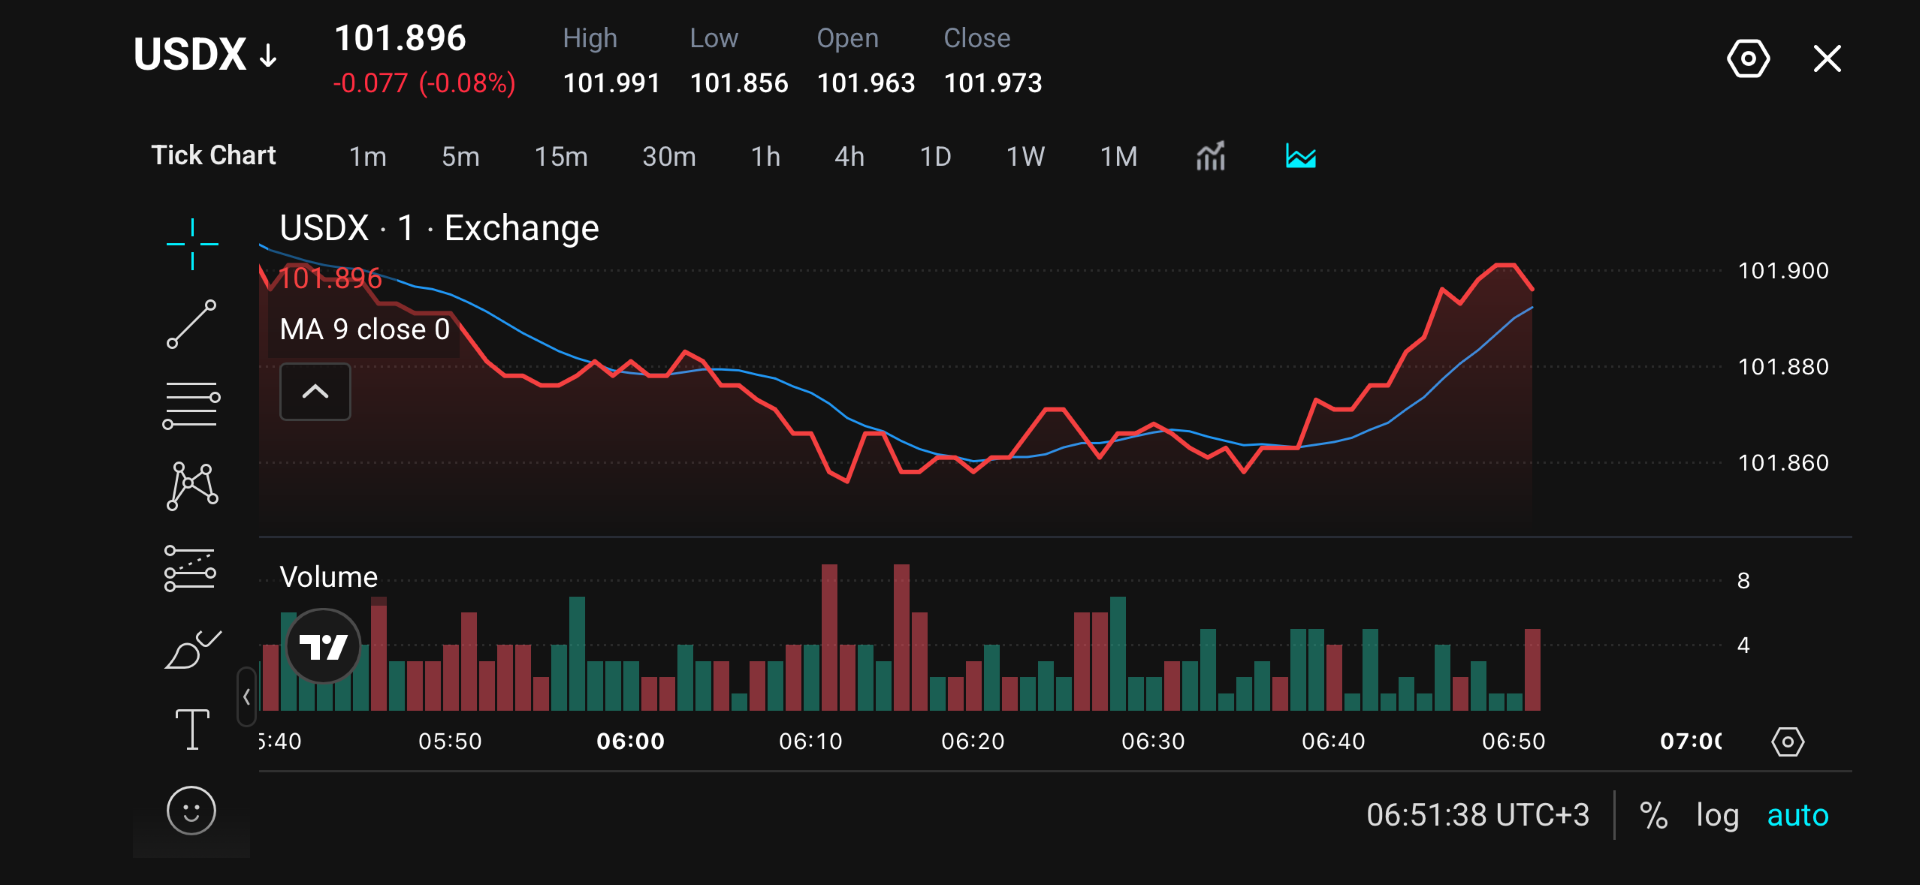
In the latest session, the index is consolidating in a tight range just under the 102 area. The intraday session has been unstable, with the index dipping toward the 101.86 area before recovering towards 101.90, a sign that buyers are still defending the dip ahead of key data release.
Why Traders Are Watching
Market attention shifts to the September CPI report. Headline inflation is expected to climb to 3.6% YoY from 3.4%, which would signal that price pressures remain stubborn. The report will be a key market driver as inflation is the main factor for Fed policy expectations.
Elevated Treasury yields have been a key pillar of dollar strength, so any change in inflation expectations could quickly shift sentiment. PPI on 15 October adds a second test of the inflation narrative, which could extend volatility until Thursday.
Key Trading Levels
| Level | Type | Significance |
| 102.37 | Resistance | Monday’s 18-month high |
| 102 | Pivot / psychological | Key round-number level; reclaiming it favours bulls |
| 101.99 | Intraday resistance | Session high |
| 101.86 | Intraday support | Session low |
The most important level overhead is 102.37, Monday’s 18-month high. Buyers failed to meet this ceiling before the dollar pulled back, so a move back to this area will likely meet selling, and a clean close above it would signal renewed strength. Just below it sits 102.00, which acts as the pivot. With DXY currently around 101.9, reclaiming and holding 102.00 would show buyers regaining control, while repeated rejections here would leave the dollar vulnerable to more downside.
The 101.99 level is the session high and the first resistance. At the bottom of the range, 101.86 is the session low and the nearest support. If it gives way, the next move is likely a deeper pullback.
Bullish and Bearish Setups
| Setup | Trigger | Confirmation |
| Bullish | CPI prints at or above 3.6% YoY, lifting Treasury yields and reinforcing a hawkish Fed | DXY reclaims and holds above 102.00, with a push toward 102.37; a close above 102.37 opens the way to fresh multi-month highs |
| Bearish | CPI prints below 3.6% YoY, easing yields and fading hawkish Fed bets | DXY breaks and holds below 101.86 (session low), with sellers targeting a deeper pullback; gold and EURUSD likely to strengthen |
For a bullish scenario to develop, the index needs to reclaim 102.00 and target a retest of 102.37. A close above 102.37 would open the way to fresh multi-month highs.
For a bearish setup, the DXY would dip below the 101.86 session low, with sellers targeting deeper pullbacks.
Disclaimer
The price levels and market scenarios above reflect the author’s assessment at the time of writing. They do not represent financial advice or an official recommendation from VT Markets. Traders should conduct their own analysis and manage risk carefully.
DXY Prediction: Market Drivers?
The biggest driver in the near term is the US inflation data. A September CPI print at or above 3.6% YoY would reinforce the case for a hawkish Federal Reserve, pushing Treasury yields higher and drawing demand for the dollar. Because DXY is tied closely to yield differentials, anything that lifts US yields relative to other major economies tends to support the index. PPI also adds a second inflation reading, so a strong number there could extend the move.
On the downside, a softer CPI would ease rate-hike expectations, pull yields lower and invite fresh dollar selling. Falling oil prices can also weigh on the dollar, as they did on Tuesday, because lower energy costs reduce inflation pressure and give the Fed less reason to stay aggressive. Shifts in Fed commentary could have a similar effect.
Beyond US data, the dollar also reacts to strength or weakness in the currencies inside the index. Since the euro makes up the largest share of the basket, a stronger eurozone outlook or a more hawkish European Central Bank can pull DXY lower, while weakness in the euro or yen tends to lift it.
Trade DXY with VT Markets
With VT Markets, traders can access currency CFDs alongside major forex pairs, gold, oil, indices, shares, ETFs and other global CFD markets from one platform.
This allows traders to follow broader dollar movements while comparing developments across USDJPY, EURUSD, XAUUSD and energy markets.
Use VT Markets’ charting tools to monitor support, resistance, moving averages and breakout behaviour as the next USDX setup develops.
Start a live account with VT Markets today.
FAQ
What is the US Dollar Index (DXY)?
DXY measures the dollar’s value against a basket of major currencies, including the euro, yen and pound.
Why does CPI move the dollar?
CPI shows how fast prices are rising. Higher inflation raises the odds of tighter Fed policy, which lifts yields and tends to support the dollar.
What happens to gold if CPI is hot?
Gold usually comes under pressure when the dollar and yields rise, and tends to rally if they fall.
Which pairs are most affected?
EURUSD and USDJPY react most directly, along with gold, since all are sensitive to dollar and yield moves.
When is the next data release after CPI?
US PPI is due on 15 October.
Start trading now — click here to create your real VT Markets account.








