





USD/CAD is a major forex currency pair that shows how many Canadian dollars are needed to buy one US dollar. Known as the “loonie pair”, USD/CAD is heavily influenced by two key drivers: the difference between Federal Reserve and Bank of Canada interest rates, and movements in crude oil prices due to Canada’s role as a major energy exporter.
This guide explains how to trade USD/CAD, what factors drive its price movements, how to read economic events from both the US and Canada, calculate pip value and margin requirements, and apply risk management strategies when trading USD/CAD CFDs on platforms such as MetaTrader 4 and MetaTrader 5.
Key Takeaways:
- USD/CAD is a major currency pair, at roughly 5.3% of global FX turnover.
- Oil prices and the Bank of Canada versus Federal Reserve interest rate differential are the two biggest drivers.
- Most of the action lands in New York and Toronto overlap, especially at 8:30am ET.
- Pip value moves with the exchange rate, so position sizing needs recalculating, not guessing.
USD/CAD is one of the most approachable pairs in forex trading, and one of the most misunderstood. Traders are drawn in by their reputation as the “oil pair”, then get caught out when crude rallies and the Canadian dollar refuses to follow.
The truth is that USD/CAD responds to a handful of forces that you can actually track. This guide walks through each one, with the calculations you need to size a trade properly on a CFD trading account.
What Is USD/CAD?
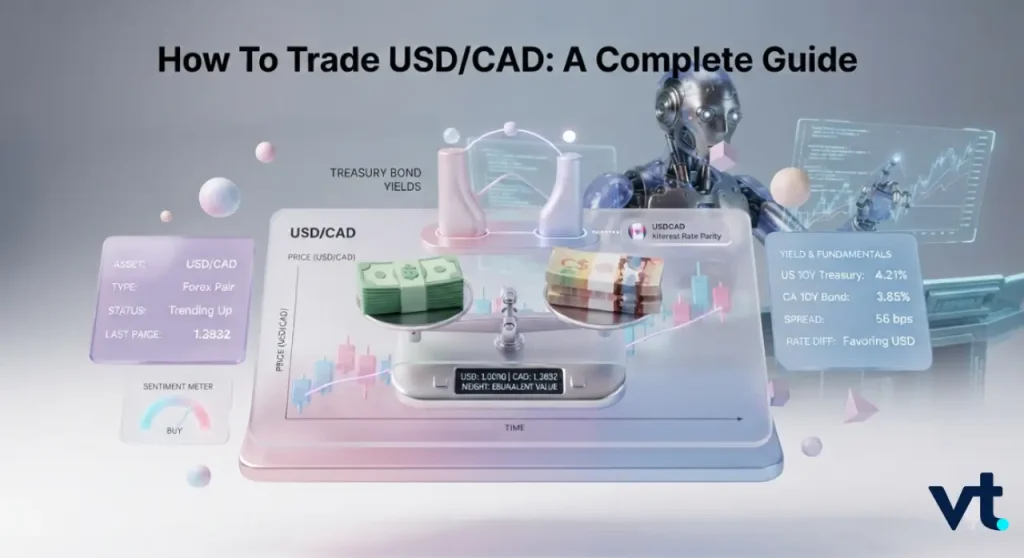
The pair is the exchange rate between the US dollar and the Canadian dollar. If it is quoted at 1.4100, one US dollar buys 1.41 Canadian dollars.
It links two economies that are deeply intertwined. The United States is Canada’s dominant trading partner, and a large slice of Canadian exports is crude oil. That single fact shapes almost everything the pair does.
What Do The Base And Quote Currencies Mean In USD/CAD?
Every quote has two halves:
- Base currency (USD): the currency you are buying or selling. It is always worth one unit.
- Quote currency (CAD): the currency used to price it. It is the number you see moving.
- In practice: buying one lot means buying 100,000 US dollars and selling the CAD equivalent.
Since the US dollar is the base, your notional exposure is already in USD, which makes the margin maths unusually simple.
Is USD/CAD A Major Currency Pair?
Yes. The 2025 BIS Triennial Central Bank Survey data showed average USD/CAD turnover of approximately US$491.6 billion per day in April 2025. This represented about 5.2% of the US$9.51 trillion global foreign-exchange market.
That ranks it among the top five pairs worldwide, which delivers three practical benefits:
- Tight spreads, because market makers compete for the flow.
- Deep liquidity, so large orders fill without moving the price.
- Reliable execution during peak hours, with less slippage on stops.
How Do You Trade USD/CAD?
Trading USD/CAD comes down to four skills. They include reading the quote, choosing a direction, sizing the position correctly, and matching your strategy to how the pair typically behaves.
How To Read A USD/CAD Quote
You will see two prices, for example 1.4100 / 1.4102.
- Bid (1.4100): where you sell.
- Ask (1.4102): where you buy.
- Spread: 2 pips, the difference between them.
Buy at 1.4102, sell at 1.4152, and you have gained 50 pips, worth roughly US$354 on one standard lot. You start every trade behind by exactly the spread, which is why cost per trade matters so much to frequent traders.
How To Take A Long Or Short Position
- Go long if you expect the US dollar to strengthen against the loonie, perhaps on a widening Fed-BoC gap.
- Go short if you expect the Canadian dollar to strengthen, perhaps on a sustained crude rally.
- Attach a stop-loss and take-profit at entry, before emotion gets a vote.
How To Size A USD/CAD Position
This calculation separates disciplined traders from hopeful ones.
Example:
US$5,000 account, 1% risk, 40 pip stop.
- Risk budget: US$5,000 × 1% = US$50
- Risk per standard lot: 40 pips × US$7.09 = US$283.60
- Position size: US$50 ÷ US$283.60 = 0.17 lots
Always round down. Recalculate the pip value whenever the rate moves materially, because the divisor changes. The VT Markets platform shows contract specifications for every instrument, so you can verify tick value rather than working from memory.
Which Approaches Suit The Pair’s Behaviour?
The pair respects structure, which makes USD/CAD technical analysis genuinely useful here.
- Range trading during quiet Asian and European hours.
- Breakout trading at 8:00am ET opens and around scheduled data.
- Trend following when a rate differential is widening consistently.
- Correlation filtering: check WTI and DXY before every entry.
Why Does USD/CAD Move?
Four forces do most of the work. Understanding how they interact matters more than memorising any single one. This is because they often pull in opposite directions. A crude rally that would normally lift the loonie can be offset entirely by a hawkish Federal Reserve the same afternoon.
1. How Do Oil Prices Affect USD/CAD?
Canada exports crude, principally to the United States. Higher oil revenues usually mean more demand for Canadian dollars.
If WTI crude oil rises, the Canadian dollar tends to strengthen, the pair tends to fall. When crude falls, the Canadian dollar tends to weaken, the pair tends to rise.
The relationship is inverse, and it is a tendency, not a rule. The link has loosened since the US became a major producer in its own right.
Treat oil as one input among several, not a signal on its own:
- Check whether crude is moving on supply news or on global demand fears.
- Demand-driven oil selling often strengthens the US dollar at the same time, amplifying the move.
- Supply-driven oil rallies have a cleaner effect on the loonie.
2. How Do Bank Of Canada And Federal Reserve Rate Differentials Drive USD/CAD?
Capital chases yield. When US rates sit above Canadian rates, holding US dollars pays more, and the pair drifts higher.
| Central bank | Policy rate (July 2026) | Direction |
| Federal Reserve | 3.50% to 3.75% | On hold since December 2025 |
| Bank of Canada | 2.25% | Held for six consecutive meetings |
Source: Federal Reserve; Bank of Canada
That gap of roughly 1.4 percentage points is a structural tailwind for the pair. The Bank of Canada itself noted in July 2026 that a widening yield differential had contributed to the Canadian dollar’s depreciation.
Watch the two-year government bond spread, which sat near minus 131 basis points in late July 2026, as your live read on this driver.
3. Why Does US Economic Data Move The Canadian Dollar?
Roughly three-quarters of Canadian exports head south, so US data hits the Canadian dollar twice:
- Once through the US dollar index (DXY), lifting or dropping the dollar broadly.
- Once through the Canadian growth outlook, as US demand feeds Canadian factories and energy.
This is why a soft US payrolls number confuses so many traders. The dollar weakens, but so does the case for Canadian growth.
4. How Does The US Dollar Index Influence USD/CAD?
The DXY tracks the dollar against a basket of currencies. When it trends strongly, most dollar pairs follow, including this one.
Pro tip: Before blaming oil for a move, check DXY. If EUR/USD, GBP/USD and USD/JPY all moved together, the story is the dollar, not the loonie.
Which Economic Events Move USD/CAD?
Volatility in this pair is concentrated. Keep a live economic calendar open and you will know when.
Which Canadian Releases Matter Most?
Statistics Canada publishes at 8:30am ET, and the Bank of Canada announces at 9:45am ET. The heavy hitters are:
- The Canadian CPI, including the CPI-trim and CPI-median core measures the Bank of Canada actually targets.
- The Labour Force Survey, which is Canada’s monthly jobs report.
- Bank of Canada interest rate decision days, plus the quarterly Monetary Policy Report.
- Monthly GDP and retail sales, which are second tier but still move the pair.
Which US Releases Matter Most For USD/CAD?
- Non-farm payrolls, first Friday of the month, 8:30am ET.
- US CPI, 8:30am ET.
- FOMC decisions, 2:00pm ET, with the press conference at 2:30pm ET.
- EIA crude oil inventories, Wednesdays at 10:30am ET, which hit oil and the Canadian dollar together.
Pro tip: Filter your economic calendar to show Canada and the United States only. Then, set alerts 15 minutes ahead of every high-impact item. Reading USD/CAD news after the move has happened is entertainment. Reading the calendar beforehand is preparation.
How Do OPEC Decisions And Crude Inventory Data Feed Through?
OPEC+ meetings set production quotas, shaping the medium-term oil price and Canada’s terms of trade. Inventory data works on a shorter fuse.
A surprise build in US crude stocks signals softer demand, pressuring oil and lifting the pair. On the other hand, a surprise draw does the opposite.
Geopolitical supply shocks, such as the Middle East disruption that pushed Canadian gasoline inflation above 20% year-on-year in June 2026, can overwhelm both.
What Happens When Canadian And US Jobs Reports Land Simultaneously?
Several times a year both jobs reports print at 8:30am ET on the same Friday, the most volatile scheduled moment for the pair. What happens is:
- Spreads widen sharply in the seconds around the release.
- Slippage on market orders becomes far more likely.
- Two data surprises can cancel each other out, producing a violent spike and reversal.
Pro tip: Many experienced traders simply stand aside, then trade the second move once the range is established.
When Is The Best Time To Trade USD/CAD?
Timing matters with USD/CAD. The session you trade decides your liquidity. The releases you watch decide your volatility. Plus, knowing how the pair trades outside North American hours tells you whether your strategy still works.
Which Session Is Most Active For USD/CAD?
Toronto is the home of Canadian dollar liquidity, and it runs on New York hours. The New York session is where the pair lives.
| Window (ET) | Window (GMT, summer) | What to expect |
| 08:00 to 12:00 | 12:00 to 16:00 | Peak liquidity, tightest spreads, most data |
| 12:00 to 17:00 | 16:00 to 21:00 | Thinning volume, trends often stall |
| 19:00 to 03:00 | 23:00 to 07:00 | Asian session, narrow ranges, wider spreads |
If you are based in Asia or Europe, the most tradeable hours fall in your evening. Plan around that, or use pending orders so you are not tied to the screen.
What Time Are The Key USD/CAD Data Releases?
- 8:30am ET: almost all Canadian and US macro data.
- 9:45am ET: Bank of Canada rate announcements.
- 10:30am ET Wednesdays: EIA crude inventories.
- 2:00pm ET: FOMC decisions.
Is USD/CAD Worth Trading Outside North American Hours?
It can be, but the character changes completely:
- Asian hours tend to range rather than trend.
- Spreads are wider and order books thinner.
- Range and mean-reversion strategies can work well.
- Breakout strategies mostly generate false signals in these conditions.
- European hours pick up somewhat, but the real money arrives with New York.
What Does It Cost To Trade USD/CAD?
Below section explains that trading USD/CAD has real costs, and three numbers define them. Pip value tells you what each move is worth. The spread tells you what you pay to enter and exit. In addition, margin tells you what capital you need to hold the position open.
How Is Pip Value Calculated For USD/CAD?
A pip is 0.0001. Since CAD is the quote currency, pip value is denominated in CAD and must be converted back to your account currency, so it changes as the rate moves.
Formula: (0.0001 ÷ current rate) × contract size
Worked example at a rate of 1.4100:
| Lot size | Units | Pip value |
| 1.00 (standard) | 100,000 | US$7.09 |
| 0.10 (mini) | 10,000 | US$0.71 |
| 0.01 (micro) | 1,000 | US$0.07 |
Note US$7.09, not the US$10 you get on EUR/USD. Traders who assume US$10 systematically over-size their positions.
What Is A Typical USD/CAD Spread?
Spreads vary by account type and time of day. As a guide:
- Standard accounts: typically around 1.5 to 2.0 pips during New York hours, with no commission.
- Raw or ECN accounts: from 0.0 pips plus a commission.
- Cost check: a 1.8 pip spread on one standard lot costs about US$12.76 to enter and exit.
- Spreads widen around 8:30am ET releases, the daily rollover and public holidays.
At VT Markets, the pair is available on both Standard STP and Raw ECN accounts, so you can match the pricing model to your holding period.
How Much Margin Does A USD/CAD Position Require?
Due to USD is the base currency, notional value is simply the lot size in US dollars: one standard lot equals US$100,000 of exposure.
| Leverage | Margin for 1 standard lot |
| 30:1 | US$3,333 |
| 100:1 | US$1,000 |
| 500:1 | US$200 |
Leverage is a financing tool, not a position-sizing tool. The US$200 figure tells you what you must post, not what you should risk.
What Is The Average Daily Range Of USD/CAD?
In calm conditions the pair typically covers 60 to 100 pips a day, less volatile than GBP/JPY but livelier than EUR/GBP. During oil shocks or divergent central bank meetings, that can double.
Pro tip: Add the ATR(14) indicator to your daily chart in MetaTrader 4 or MetaTrader 5 and read the live figure rather than relying on a textbook number. Size stops relative to it.
What Are The Risks Of Trading USD/CAD?
This final section describes USD/CAD carrying three key risks. The oil correlation can weaken or flip without warning. Central bank divergence can create trends that punish counter-trend traders, then reverse just as fast. Also, Canadian public holidays create liquidity gaps that catch traders off guard.
1. When Oil Correlation Weakens Or Inverts
The oil link is unstable. It can fade for months, or invert entirely when a supply shock lifts crude and drives safe-haven demand into the US dollar at the same time. Trading the pair as a pure oil proxy is one of the most common ways to lose money in it.
Rolling correlation is a tool, not a constant, so measure it rather than assume it. Canadian heavy crude trades at a discount to WTI. Therefore, the headline oil price is only a proxy for Canadian export revenue. US shale production means a crude rally can now support the US dollar too, muting the effect.
2. How Central Bank Divergence Creates Trend And Reversal Risk
When the Bank of Canada and the Federal Reserve move in opposite directions, the pair can trend for a very long time. Multi-year trends punish counter-trend traders who lack a stop.
This is because:
- Reversals are fast, as divergence trades are crowded.
- Overnight swap costs compound on positions held through long trends.
3. Liquidity Gaps Around Canadian Public Holidays
Canada and the US do not share a holiday calendar. On Canada Day, the August Civic Holiday and Canadian Thanksgiving, US markets trade normally while Canadian liquidity dries up. During these times:
- Spreads widen, sometimes dramatically.
- Stop-loss orders are more likely to slip.
Pro tip: Check both holiday calendars each month and reduce size accordingly.
Frequently Asked Questions (FAQs)
Q1: What is USD/CAD?
It is the currency pair showing how many Canadian dollars one US dollar buys. It is a major pair, accounting for about 5.3% of daily global FX turnover, and is nicknamed the loonie after Canada’s one-dollar coin.
Q2: Why does USD/CAD fall when oil prices rise?
Canada is a major crude exporter, so higher oil prices generally increase demand for Canadian dollars, strengthening the loonie and pushing the rate lower. It is a tendency rather than a guarantee, and it weakens when the US dollar is moving strongly for its own reasons.
Q3: How is pip value calculated for USD/CAD?
Divide 0.0001 by the current rate, then multiply by your contract size. At 1.4100, one standard lot gives (0.0001 ÷ 1.4100) × 100,000 = US$7.09 per pip. Recalculate as the rate moves.
Q4: What is the best time to trade USD/CAD?
The 8:00am to 12:00pm ET window, when Toronto and New York are both active. Most Canadian and US data lands at 8:30am ET, and spreads are tightest through this period.
Q5: Which economic data moves USD/CAD?
Canadian CPI, the Labour Force Survey and Bank of Canada decisions on the Canadian side. Non-farm payrolls, US CPI and FOMC decisions on the US side. EIA crude inventories matter through the oil channel.
Start Online CFD Trading with VT Markets Today
If you are ready to explore online trading, VT Markets provides access to tools and platforms to help you get started. Trade on powerful platforms like MetaTrader 4 (MT4) and MetaTrader 5 (MT5), designed for speed, reliability, and advanced trading features.
New to trading? You can practise risk-free with a VT Markets demo account before moving to a live CFD account. For ongoing support, our Help Centre offers educational resources and platform guidance to help you build confidence as you learn.
Open your account with VT Markets today and access secure, transparent, and competitive CFD trading across some of the world’s most popular markets.








