






Key Points
- The Nasdaq Composite fell roughly 2% on Wednesday, with technology and AI-related stocks facing widespread selling pressure.
- September headline CPI rose to 3.7% year-on-year, while core CPI reached 2.6%, reinforcing concerns about persistent inflation.
- The US 10-year Treasury yield rose above 5.3%, increasing pressure on equities.
- Nvidia, AMD, Broadcom and Oracle were among the companies affected by renewed selling.
- The US Producer Price Index (PPI) report on 15 October is the next major catalyst, influencing Federal Reserve interest rate expectations and determining whether technology stocks can extend their decline or begin a recovery.
Market Move
The Nasdaq Composite declined approximately 2% towards 29,900, underperforming the S&P 500, which lost around 1.1%.
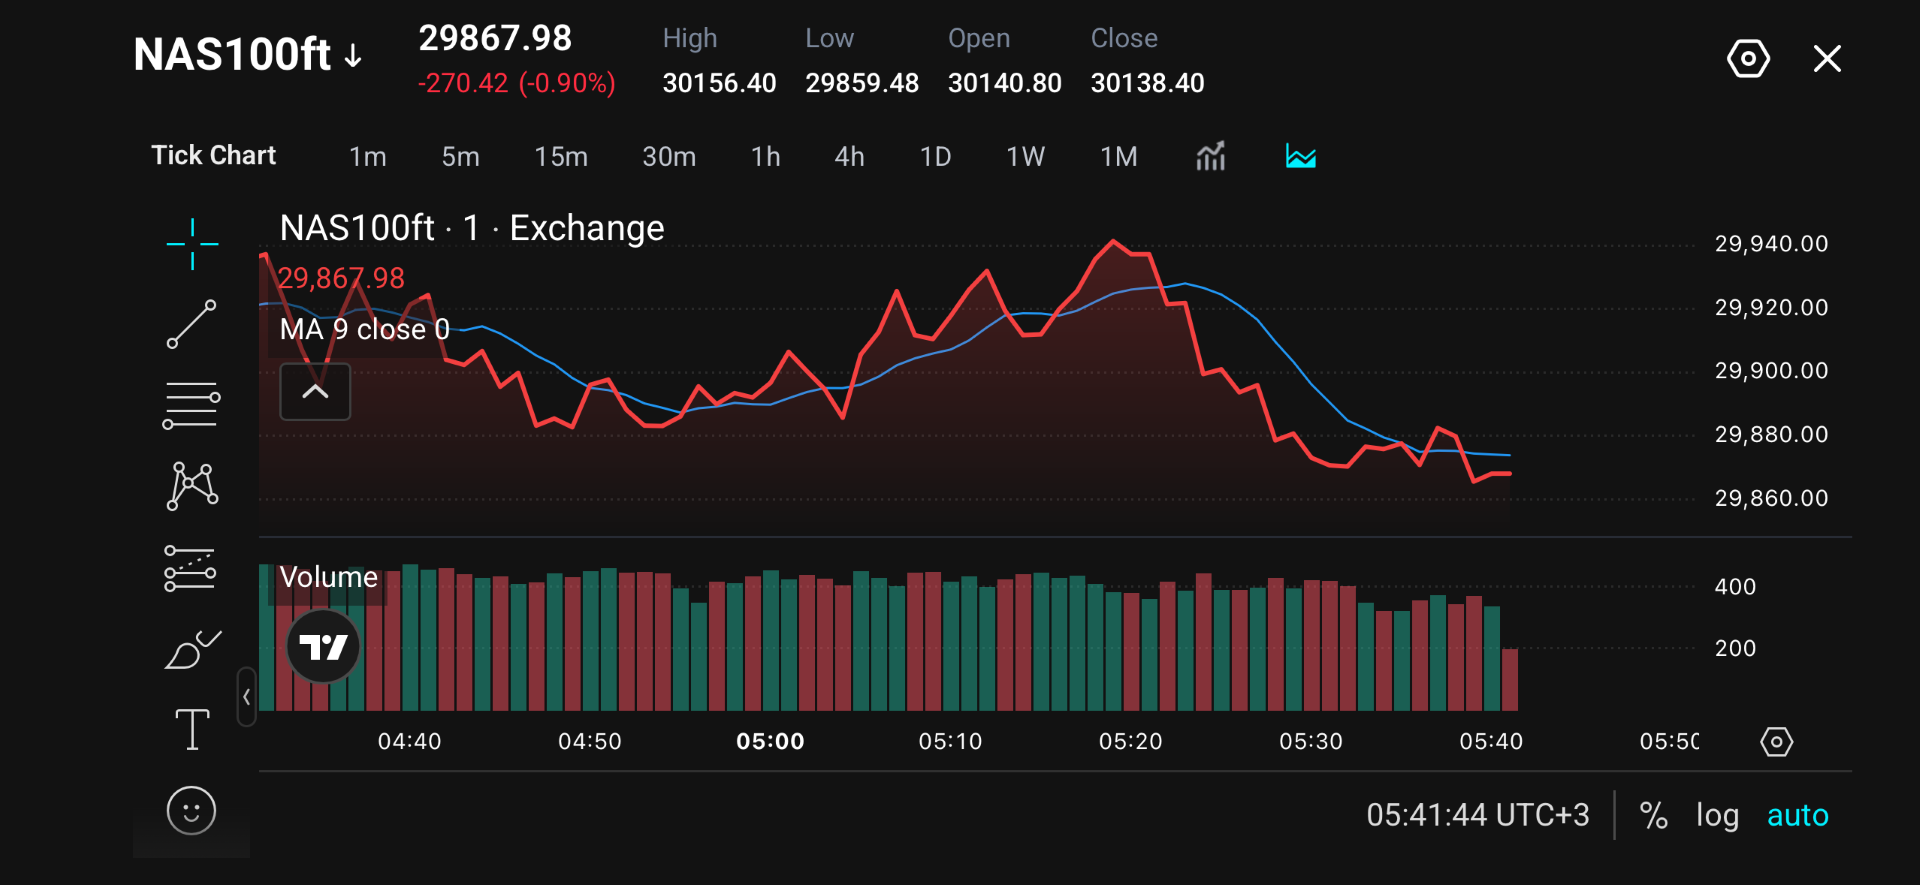
In the latest session, NASDAQ100ft prices also retreated from an intraday recovery near 29,940 towards 29,868. The nine-period moving average has also turned lower, with the latest price trading below it, indicating weakening short-term momentum.
Recent market weakness can be attributed to inflation-driven equity sell-offs. However, the immediate technical picture suggests that sellers remain in control unless prices recover above nearby resistance levels.
Why Traders Are Watching
The Nasdaq came under significant selling pressure on Wednesday, 14 October, as hot US inflation data triggered a broad retreat from technology stocks. This came after the release of September’s US Consumer Price Index (CPI), which showed headline inflation accelerating to 3.7% annually, above the anticipated 3.6%. Core CPI also came in higher than expected at 2.6%, adding to concerns that inflationary pressures remain persistent.
Higher inflation expectations pushed US Treasury yields upwards, with the benchmark 10-year yield reportedly moving above 5.3%. The Nasdaq’s latest decline highlights the sensitivity of technology stocks to changing inflation expectations and US monetary policy. Higher yields increase the attractiveness of fixed-income investments while decreasing the current value of companies’ expected future cash flows.
Thus, technology companies are particularly vulnerable when yields rise. This creates additional challenges for major AI and semiconductor companies, including Nvidia, AMD and Broadcom, whose valuations reflect expectations of revenue growth and continued investment in artificial intelligence infrastructure.
Key Trading Levels
| Level | Price | Technical significance |
| Resistance 3 | 29,940 | Recent intraday peak and strongest visible overhead resistance |
| Resistance 2 | 29,920 | Previous recovery zone with multiple price reactions |
| Resistance 1 | 29,880–29,900 | Immediate resistance and potential recovery area |
| Current price | 29,867.98 | Latest quoted NASDAQ100ft price |
| Support 1 | 29,860 | Immediate support near the lower boundary of the visible chart |
| Support 2 | Below 29,860 | Potential bearish continuation; no lower support is confirmed by the chart |
NASDAQ100ft is trading near 29,868 after failing to sustain its recovery towards 29,940. The 29,880–29,900 zone represents the first important resistance area, where the market recently experienced repeated price fluctuations. A sustained recovery above this zone could open the way towards 29,920 and potentially 29,940.
On the downside, 29,860 is the nearest visible support. A decisive break below this level could indicate further selling pressure.
Bullish and Bearish Setup
| Scenario | Trigger | Potential target | Market implication |
| Bullish recovery | Price breaks and holds above 29,880 | 29,900 | Initial recovery as selling pressure eases |
| Bullish breakout | Sustained move above 29,900 | 29,920–29,940 | Stronger buying momentum towards previous highs |
| Bearish rejection | Price fails to reclaim 29,880–29,900 | 29,860 | Continued weakness beneath nearby resistance |
| Bearish breakdown | Price breaks below 29,860 | Further downside, target unconfirmed | Potential continuation of the short-term downtrend |
The bullish scenario could develop if NASDAQ100ft breaks and holds above 29,880, potentially triggering a recovery towards 29,900 as selling pressure eases. A sustained breakout above 29,900 could strengthen buying momentum and push prices towards the next resistance zone at 29,920–29,940.
Conversely, if NASDAQ100ft fails to reclaim the 29,880–29,900 resistance area, bearish pressure could persist, bringing the immediate support at 29,860 back into focus.
Disclaimer
The price levels and market scenarios above reflect the author’s assessment at the time of writing. They do not represent financial advice or an official recommendation from VT Markets. Traders should conduct their own analysis and manage risk carefully.
NASDAQ100FT Prediction: Next Market Drivers
The short-term outlook for NASDAQ100ft remains cautious as persistent US inflation, elevated Treasury yields and renewed expectations of Federal Reserve tightening continue to weigh on technology stocks. The next major catalyst is the US PPI report on 15 October, which could determine whether the Nasdaq extends its decline or attracts renewed buying interest.
A softer-than-expected PPI reading could ease inflation concerns and reduce expectations of further Federal Reserve interest rate increases. If Treasury yields retreat, technology and AI-related stocks could benefit from improved market sentiment. Otherwise, another inflation surprise could reinforce expectations that the Federal Reserve will raise interest rates further, and higher yields would continue to pressure technology stocks.
Trade NASDAQ100ft with VT Markets
Market volatility following major economic releases can create opportunities for traders looking to respond to movements in US technology stocks.
With VT Markets, traders can discover Nasdaq-related index CFDs and other assets through a range of trading platforms. VT Markets provides access to global markets, advanced charting tools, educational content and more.
Start a live trading account and explore trading opportunities at VT Markets.
Frequently Asked Questions
Why did the Nasdaq fall nearly 2%?
The Nasdaq declined approximately 1.9% on 14 October 2026 after hotter-than-expected US inflation data increased concerns about additional Federal Reserve interest rate hikes. Rising Treasury yields placed pressure on technology and growth-oriented stocks.
What are the key NASDAQ100ft support and resistance levels?
Immediate support is located around 29,860, while the nearest resistance zone sits between 29,880 and 29,900. A sustained recovery above this area could bring 29,920 and 29,940 into focus.
How does higher inflation affect the Nasdaq?
Higher inflation can increase expectations of tighter monetary policy and push Treasury yields higher. This may reduce the present value of technology companies’ future earnings, placing downward pressure on stock valuations.
Could NASDAQ100ft recover after the PPI report?
A recovery is possible if PPI comes in below expectations, easing inflation concerns and reducing Treasury yields. In this scenario, NASDAQ100ft could attempt to reclaim 29,900 before targeting 29,920–29,940.
When is the next major economic event for Nasdaq traders?
The next major scheduled catalyst is the US September PPI report on 15 October 2026 at 8:30 a.m. Eastern Time. The data could influence Federal Reserve rate expectations, Treasury yields and technology-sector sentiment.
Start trading now — click here to create your real VT Markets account.








