






Key Points
- Gold held above $4,300 an ounce on Monday after gaining more than 7% last week and reaching a seven-week high.
- Weak US labour-market data reduced expectations for a September Federal Reserve rate hike, supporting gold.
- US nonfarm payrolls unexpectedly fell by 23,000 in July, while previous months were revised lower.
- Markets are focused on upcoming US CPI and PPI data for further clues on the Fed’s interest-rate path.
- Uncertainty surrounding the Strait of Hormuz remains an additional factor for oil prices, inflation expectations and broader market sentiment.
Gold held above the $4,300 an ounce area on Monday after gaining more than 7% last week, as weaker US labour-market data reduced expectations for a near-term Federal Reserve rate hike.
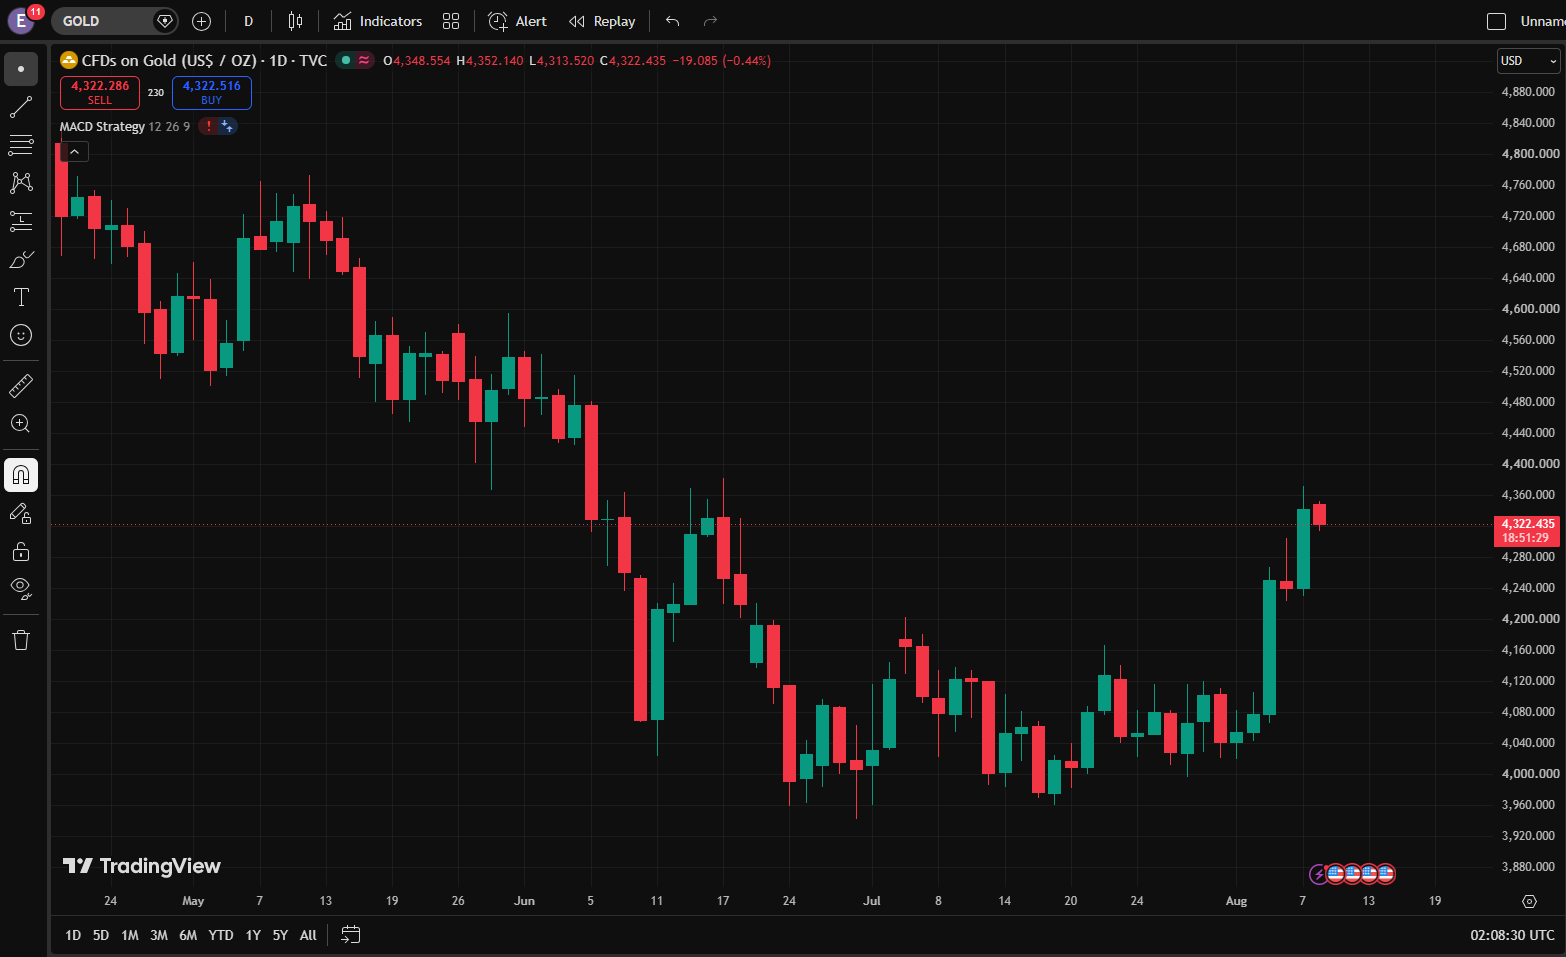
Spot gold was around $4,322 an ounce in early trading after reaching its highest level since June 17 on Friday. The move followed US employment data showing an unexpected decline in jobs, prompting markets to reassess the outlook for interest rates.
Gold has since eased slightly from Friday’s peak but remains above $4,300 as traders await US inflation data for further clues on the Fed’s next policy move.
The latest price action reflects the market’s reassessment of interest-rate expectations following the weaker employment picture.
Why Traders Are Watching Gold
The recent move in gold has been closely linked to changing expectations for US monetary policy.
The US economy unexpectedly shed 23,000 nonfarm jobs in July, while June payroll growth was revised down to 20,000. The weaker employment picture reduced expectations for a September rate hike, with markets now pricing roughly a 44% probability of a 25-basis-point increase.
Lower interest-rate expectations can support gold because bullion does not generate interest income. When expected rates and yields decline, the opportunity cost of holding gold can become less restrictive.
The focus now shifts to US CPI and PPI data due later this week. Stronger-than-expected inflation could limit expectations for easier monetary policy, while softer readings could reinforce the recent shift in rate expectations.
Geopolitical developments are another factor for gold and broader markets. Iran said it was nearing an agreement with Oman to define new shipping lanes through the Strait of Hormuz, although reopening the waterway remains subject to further conditions.
Any continued uncertainty around the strategic waterway could affect oil prices and inflation expectations, giving markets another factor to consider alongside US monetary policy.
Key Trading Levels
| Price Level | What Traders Are Watching |
| $4,360 | Resistance area above the recent high |
| $4,340 | Immediate resistance following the latest rally |
| $4,320 | Current trading area and near-term price reference |
| $4,280 | First support if the latest rally loses momentum |
| $4,240 | Key support around the recent breakout area |
| $4,200 | Wider support if the correction deepens |
Gold is trading around the $4,320 area after its strong move higher last week.
A move above $4,340 could strengthen short-term momentum and bring the $4,360 area into focus.
On the downside, a break below $4,280 could signal a deeper pullback towards $4,240, while further weakness could expose the $4,200 support zone.
Bullish and Bearish Setups
| Setup | Trigger | Potential Market Reaction |
| Recovery Continuation | Hold above $4,320 | Gold may attempt to retest the $4,340 resistance area |
| Bullish Breakout | Break above $4,360 | Momentum could strengthen and extend the recent advance |
| Range Consolidation | Hold between $4,280 and $4,360 | Gold may consolidate as markets await inflation data |
| Bearish Pullback | Break below $4,280 | Selling pressure could increase towards $4,240 |
| Deeper Correction | Fall below $4,240 | Gold may move towards the $4,200 support zone |
The bullish scenario depends on gold holding above the $4,320 area and moving through the $4,340 to $4,360 resistance zone. A sustained break above $4,360 could indicate that buyers remain in control following last week’s advance.
The bearish scenario becomes more relevant if gold falls below $4,280. A break of this level could lead to a deeper retracement towards $4,240, with $4,200 becoming the next area to monitor.
Disclaimer
The price levels and market scenarios above reflect the author’s view at the time of writing and do not represent financial advice or an official recommendation from VT Markets. Traders should conduct their own analysis and manage risk carefully.
Explore Gold Trading with VT Markets
VT Markets also provides access to gold CFDs through MetaTrader 4, MetaTrader 5 and the VT Markets app, allowing traders to speculate on rising or falling gold prices without owning physical bullion.
Discover a more flexible way to trade gold with XAUUSD247, offering 24/7 access to gold markets beyond traditional trading hours through VT Markets.

Start trading gold with VT Markets today.
What to Watch Next
Gold’s next direction will depend largely on how upcoming US economic data affects Federal Reserve expectations.
Key factors include:
- US CPI Data: Signs of further inflation moderation or renewed price pressures.
- US PPI Data: Producer-price trends that could provide additional clues on future inflation.
- Fed Rate Expectations: Changes in market pricing for a September rate hike.
- Treasury Yields: Movements in US yields as interest-rate expectations adjust.
- Strait of Hormuz: Developments involving Iran and Oman that could affect oil prices and broader geopolitical risk.
From a technical perspective, traders are watching $4,340 as the next resistance level, while $4,280 remains the key short-term support.
Frequently Asked Questions
Why did gold rise after the US jobs report?
Gold gained after US employment data showed an unexpected decline in July payrolls and downward revisions to previous months. The weaker labour-market picture reduced expectations for a near-term Fed rate hike, supporting gold.
What is supporting gold above $4,300?
Lower expectations for a September Fed rate hike, weaker US labour-market data and continued geopolitical uncertainty have helped gold remain above $4,300.
What US data could move gold next?
US CPI and PPI are the main upcoming inflation indicators to watch. Their results could influence expectations for the Fed’s future interest-rate decisions.
How do interest rates affect gold?
Gold does not generate interest income. Therefore, lower interest-rate expectations can reduce the opportunity cost of holding bullion, while higher rates can make yield-generating assets relatively more attractive.
What are the key gold levels to watch?
The main resistance levels are $4,340 and $4,360, while $4,280 is the first key support. Further downside could bring $4,240 and $4,200 into focus.
What could support gold further?
Further weakness in US economic data, lower Fed rate expectations, softer Treasury yields or renewed geopolitical uncertainty could support gold demand. Conversely, stronger inflation data or a renewed rise in rate expectations could put pressure on prices.
Start trading now — click here to create your real VT Markets account.








