







Key Points
- Escalating Middle East tensions have decreased investor appetite for risk-sensitive assets, including cryptocurrencies.
- Prices recovered from around $79,400, but remain below the psychological $80,000 level.
- US spot Bitcoin ETFs recorded approximately $301 million in net inflows during the week ended 23 October, despite withdrawals late in the week.
- Immediate chart resistance sits near $79,800, while $81,500–$82,500 remains a broader recovery zone.
- The Fed’s 28 October decision and developments in the Middle East are key upcoming catalysts.
Market Move
Bitcoin remains under pressure after falling below $80,000 over the weekend. The decline came after renewed concerns about Middle East tensions and reports of US evacuations in the region, adding uncertainty across markets.
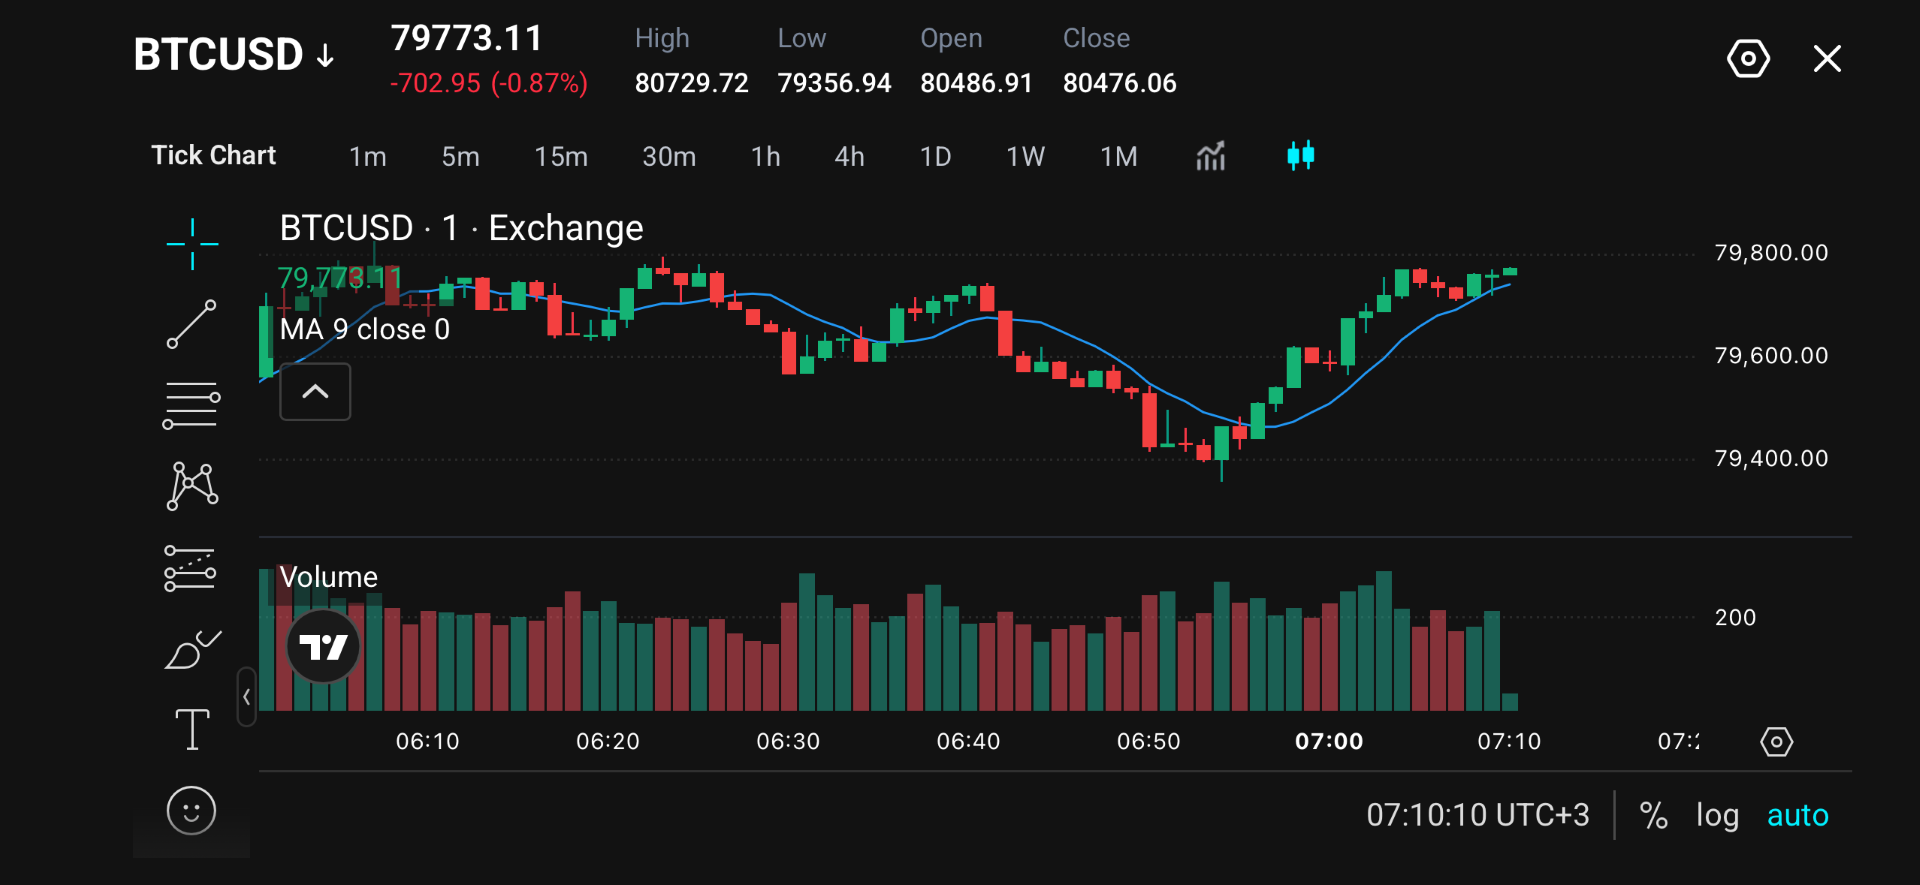
In the latest session, BTCUSD is trading at $79,773.11, following a rebound from around $79,400. Price has moved above its nine-period moving average and is approaching $79,800, where earlier advances stalled. Bitcoin needs to regain $80,000 before attention shifts towards higher resistance.
Why Traders Are Watching
Recent geopolitical developments in the Middle East have pressured cryptocurrencies alongside other risk-sensitive assets. Higher energy prices could also complicate the outlook. If they strengthen inflation concerns, investors may expect interest rates to remain elevated for longer, creating another potential headwind for Bitcoin.
Even so, demand for bitcoin is still rampant. US spot Bitcoin ETFs attracted approximately $301 million in net inflows during the week ended 23 October, ending two consecutive weeks of net withdrawals. However, the weekly gain included outflows of approximately $635.6 million on Thursday and $137.9 million on Friday. Traders are now watching whether inflows resume consistently.
Key Trading Levels
| Level | Role | Significance |
| $84,000 | Broader resistance | Upper barrier in the wider recovery framework. |
| $81,500–$82,500 | Broader resistance zone | Area to assess whether a recovery is gaining strength. |
| $80,700–$80,730 | Session reference | Includes the displayed high of $80,729.72. |
| $80,000 | Psychological pivot | Former support that price now needs to reclaim. |
| $79,800 | Immediate resistance | Near the repeated highs visible on the one-minute chart. |
| $79,600 | Initial support | Short-term consolidation area within the latest rebound. |
| $79,350–$79,400 | Local support zone | Includes the displayed low of $79,356.94. |
| $78,000 | Broader downside reference | Lower level to monitor beyond the chart’s visible range. |
Bitcoin’s nearest resistance sits around $79,800, where several advances stalled. The psychological $80,000 level remains an important reference after previously acting as support. Above that, $80,700–$80,730 marks the area surrounding the session high of $80,729.72.
The broader resistance zone lies at $81,500–$82,500, while $84,000 represents a higher barrier in the wider market outlook. Initial support sits near $79,600, a consolidation area within the latest rebound. The $79,350–$79,400 zone contains the displayed low of $79,356.94, marking the level of the recent recovery. Further below, $78,000 serves as a broader downside reference.
Bullish and Bearish Setups
| Scenario | Confirmation | Levels to Watch |
| Bullish recovery | Sustained move above $80,000, followed by a successful retest | $80,700–$80,730, then $81,500–$82,500 |
| Broader bullish extension | Break above $82,500 that holds on a higher timeframe | $84,000 |
| Bearish continuation | Rejection below $80,000, followed by a sustained break beneath $79,350 | $78,000 |
The bullish case requires buyers to turn the initial rebound into a sustained recovery. Holding above $80,000 would strengthen that case, particularly if buying continues.
The bearish case strengthens if the recovery stalls and sellers break the intraday low. Because Bitcoin is already below $80,000, continued trading beneath that level alone would offer less confirmation than a fresh breakdown through support.
Disclaimer
The price levels and market scenarios above reflect the author’s assessment at the time of writing. They do not represent financial advice or an official recommendation from VT Markets. Traders should conduct their own analysis and manage risk carefully.
Bitcoin Prediction: What’s Next?
Easing Middle East tensions, sustained ETF inflows and a less restrictive Fed outlook could support a recovery for Bitcoin. Whereas further geopolitical escalation, renewed ETF withdrawals or rising Treasury yields could keep pressure on prices.
The next market catalyst will be the Federal Reserve’s meeting on 27–28 October, with its policy decision due on Wednesday. For Bitcoin, the market’s reaction may depend on the Fed’s guidance as much as the rate decision itself as a softer policy outlook and declining Treasury yields could support risk appetite. Traders should assess whether the first price reaction holds once the market has absorbed the announcement.
Trade Bitcoin with VT Markets
Bitcoin’s sensitivity to headlines and interest rate expectations creates opportunities for traders to assess both bullish and bearish market scenarios.
With VT Markets, traders can access BTCUSD through cryptocurrency CFDs, allowing them to take positions on both rising and falling prices without owning the underlying Bitcoin. The VT Markets trading platforms provide access to real-time charts, technical indicators and order management tools to help traders monitor market movements and manage their exposure.
Explore Bitcoin CFD trading with VT Markets.
FAQ
Why is Bitcoin trading below $80,000?
The weekend decline coincided with renewed Middle East concerns and weaker appetite for risk-sensitive assets. Late-week ETF withdrawals also pointed to cautious investor positioning.
What are Bitcoin’s immediate support and resistance levels?
The initial support sits around $79,600, followed by $79,350–$79,400. Immediate resistance is near $79,800, then $80,000.
Could Bitcoin recover towards $84,000?
A recovery towards $84,000 is possible, but Bitcoin would first need to regain $80,000 and overcome the broader $81,500–$82,500 resistance zone.
What is Bitcoin’s next major catalyst?
The Federal Reserve’s 28 October policy decision is the next scheduled catalyst, alongside ongoing developments in the Middle East.
Start trading now — click here to create your real VT Markets account.



