







Key Points
- Bitcoin trades near $82,621.57, up 2.05%, after recovering from an intraday low of $80,902.68.
- US headline CPI rose 3.7% year-on-year, while core inflation reached 2.6%, reinforcing concerns over persistent price pressures.
- Uneven spot Bitcoin ETF flows and elevated Treasury yields continue to influence demand.
- Traders are monitoring upcoming US economic releases, changes in Treasury yields and dollar strength, and whether institutional buying can sustain Bitcoin’s recovery.
- The Federal Reserve’s 27–28 October meeting remains the next major policy event
Market Move
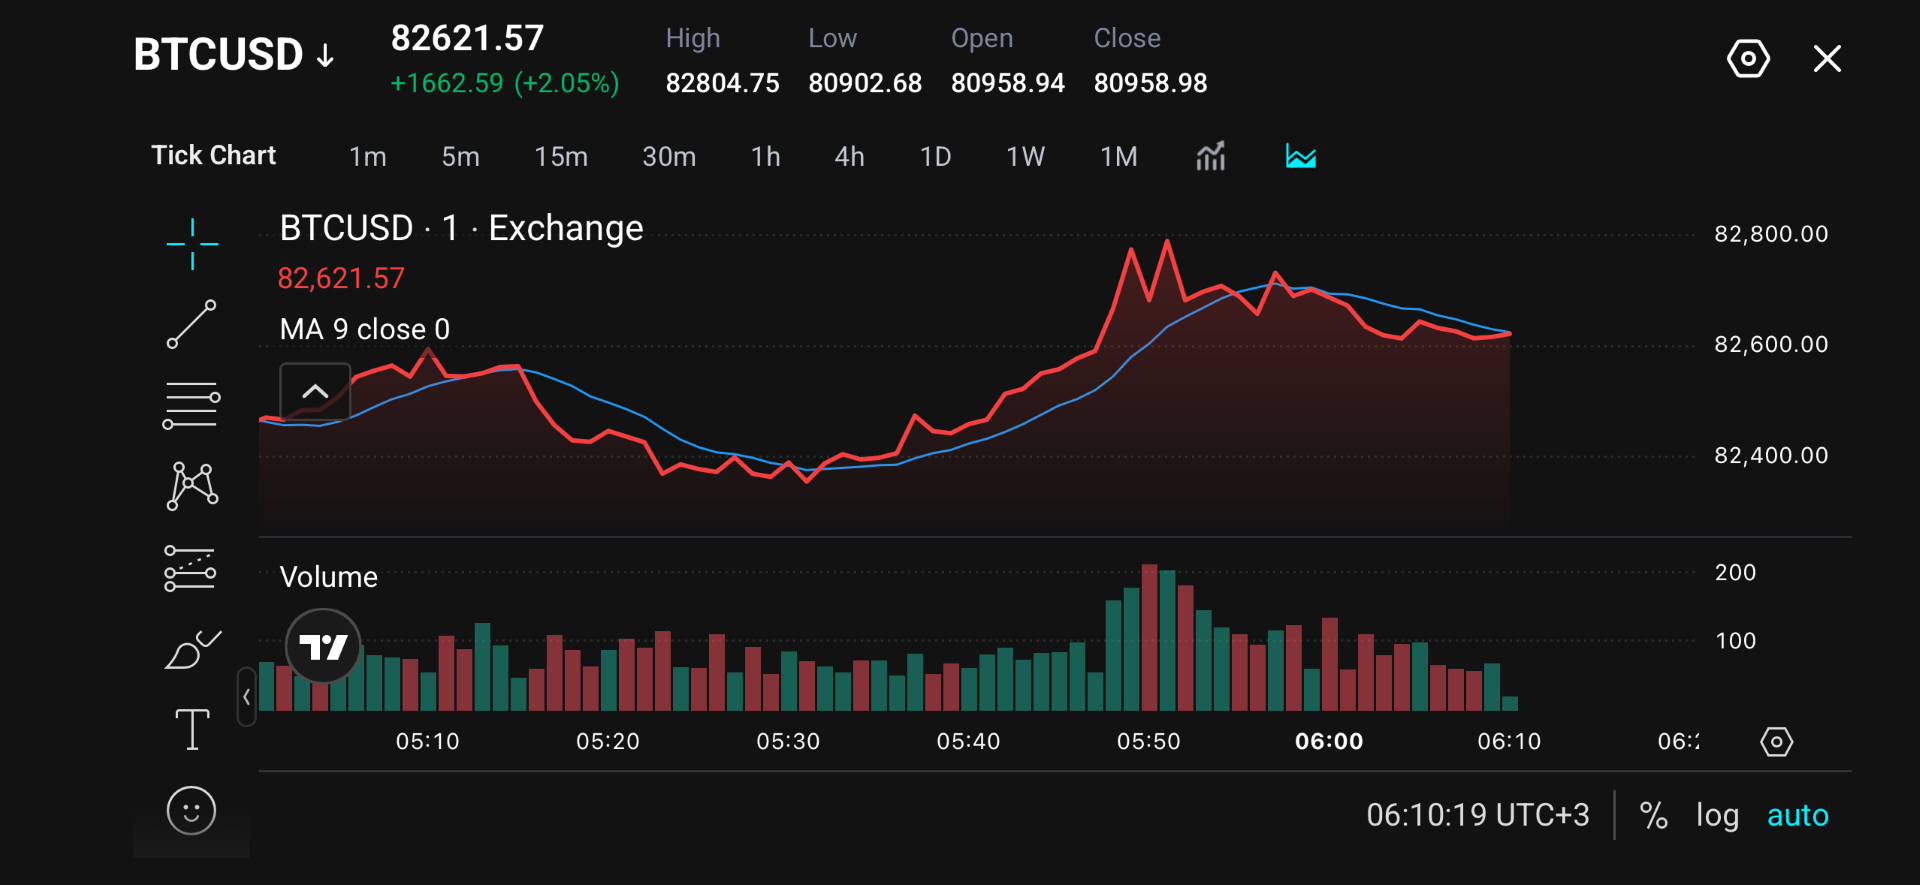
Bitcoin (BTCUSD) recovered above $82,000 as traders reassessed the Federal Reserve’s interest rate outlook following stronger-than-expected US inflation data. In the latest session, Bitcoin traded at $82,621.57, from an intraday low of $80,902.68 and a high of $82,804.75.
Bitcoin’s recovery suggests that buyers remain active despite macroeconomic pressure, although it has yet to establish a sustained breakout above its recent intraday high.
Why Traders Are Watching
September headline CPI reached 3.7% year-on-year, above the 3.6% forecast, while core inflation climbed to 2.6%. These figures initially strengthened expectations of further monetary tightening. However, more recent comments from Fed Chair Kevin Warsh have reduced expectations of an October rate hike. A decision to leave rates unchanged could ease upward pressure on Treasury yields and support renewed demand for cryptocurrencies.
Institutional positioning adds more uncertainty. Uneven flows into US spot Bitcoin ETFs, including BlackRock’s iShares Bitcoin Trust, suggest that institutional demand has not been consistently strong enough to offset broader market pressure. Traders are now closely monitoring upcoming US economic releases, changes in Treasury yields and dollar strength, and whether institutional buying can sustain Bitcoin’s recovery.
Key Trading Levels
| Level | Price (USD) | Technical significance |
| Resistance 2 | 82,804.75 | Displayed intraday high and breakout reference |
| Resistance 1 | 82,700–82,750 | Recent rally peaks and selling pressure |
| Pivot zone | 82,600–82,625 | Immediate consolidation area |
| Support 1 | 82,400 | Earlier intraday support |
| Support 2 | 82,350–82,375 | Local recovery base |
| Support 3 | 82,000 | Psychological support |
| Lower reference | 80,902.68 | Displayed session low |
Bitcoin recovered from approximately $82,350 towards $82,800 before easing back to $82,621.57. Bitcoin’s immediate resistance sits between $82,700 and $82,750, where recent advances encountered selling pressure. A sustained move through this region could encourage another test of $82,804.75.
On the downside, $82,600 serves as the nearest pivot. A decline below this level could bring $82,400 into focus, followed by the earlier consolidation area near $82,350.
The broader $82,000 level remains an important psychological reference. The session low of $80,902.68 provides a wider downside reference rather than an immediately tested support level.
Bullish and Bearish Setups
| Scenario | Trigger | Potential target | Market implication |
| Bullish recovery | Holds above $82,600 | $82,700 | Buyers regain short-term control |
| Bullish breakout | Sustained move above $82,750 | $82,804.75 | Retest of the displayed session high |
| Bearish rejection | Fails to reclaim $82,700 | $82,600 | Recovery momentum weakens |
| Bearish breakdown | Breaks below $82,600 | $82,400–$82,350 | Earlier support zones return into focus |
The bullish scenario depends on Bitcoin maintaining support around $82,600 and reclaiming the $82,700 resistance area. A move above $82,750, accompanied by stronger volume, could open the way towards $82,804.75.
If Bitcoin repeatedly fails to recover above $82,700, a bearish scenario would develop. Sellers could push prices back towards $82,600. A confirmed breakdown would shift attention to $82,400 and the earlier consolidation range around $82,350.
Disclaimer
The price levels and market scenarios above reflect the author’s assessment at the time of writing. They do not represent financial advice or an official recommendation from VT Markets. Traders should conduct their own analysis and manage risk carefully.
Bitcoin Prediction: What’s Next?
Bitcoin’s near-term direction will depend on whether easing expectations for a Federal Reserve rate hike can offset inflation concerns.
This shift could provide Bitcoin with some support if Treasury yields stabilise and the dollar weakens. Improved institutional demand and a recovery in spot Bitcoin ETF inflows could reinforce bullish momentum. Conversely, stronger economic data or renewed inflation pressure could push yields higher and weaken appetite for cryptocurrencies. Continued ETF outflows could also limit Bitcoin’s ability to sustain a recovery.
The Federal Reserve’s 27–28 October meeting remains the next major policy event, with markets increasingly weighing the possibility of a pause before further tightening later in the year.
Trade Bitcoin with VT Markets
Bitcoin’s sensitivity to inflation data, interest rate expectations and institutional flows creates opportunities for traders to assess both bullish and bearish market scenarios.
With VT Markets, traders can access BTCUSD through cryptocurrency CFDs, allowing them to take positions on both rising and falling prices without owning the underlying Bitcoin. The VT Markets trading platforms provide access to real-time charts, technical indicators and order management tools to help traders monitor market movements and manage their exposure.
Explore Bitcoin CFD trading with VT Markets.
Frequently Asked Questions
Why is Bitcoin rising despite higher US inflation?
Bitcoin’s recovery reflects changing expectations for Federal Reserve policy. Although higher inflation initially increased rate hike concerns, cautious comments from Fed officials have reduced expectations of immediate tightening, offering some support to risk-sensitive assets.
How do Federal Reserve interest rates affect Bitcoin?
Higher interest rates can increase Treasury yields and strengthen the US dollar, making risk-sensitive assets such as Bitcoin less attractive. Lower rate expectations may support cryptocurrency demand, although the relationship is not always consistent.
What is Bitcoin’s immediate resistance level?
The resistance level is between $82,700 and $82,750. A sustained breakout could bring the intraday high of $82,804.75 into focus.
What are Bitcoin’s key support levels?
Immediate support lies near $82,600, followed by $82,400 and $82,350. The psychological $82,000 level provides a broader downside reference if selling pressure increases.
Can Bitcoin reach $83,000 next?
Bitcoin could approach $83,000 if buying momentum strengthens and price breaks above $82,804.75.
What should Bitcoin traders watch next?
Traders can monitor US inflation releases, Federal Reserve communications, Treasury yields, dollar movements and spot Bitcoin ETF flows. These factors could influence Bitcoin’s direction ahead of the October policy decision.
Start trading now — click here to create your real VT Markets account.



