






Key Takeaways
- Fibonacci retracement levels are horizontal lines that mark where a price pullback might pause or reverse before the trend continues.
- The core levels are 23.6%, 38.2%, 50%, 61.8% and 78.6%, with 61.8% (the golden ratio) watched most closely.
- You draw them from a swing low to a swing high in an uptrend, and from a swing high to a swing low in a downtrend.
- At VT Markets, you can apply these levels on both MT4 and MT5, and they work best alongside support, resistance and moving averages.
Fibonacci retracement levels are one of the most widely used tools in technical analysis, and for good reason. Markets rarely move in a straight line.
After a strong push higher or lower, price tends to pause and pull back before continuing. Fibonacci retracement levels help you map where that pullback is likely to run out of steam. Therefore, you can plan an entry instead of guessing.
This practical guide breaks down the maths, the drawing method and the trading application. By the end, you will know how to add Fibonacci retracement levels to any chart, how to read each ratio, and how to build a simple, repeatable routine around them.
Whether you trade forex, gold or indices, these levels can sharpen your entries and tighten your risk.
What Are Fibonacci Retracement Levels
Fibonacci retracement levels are horizontal support and resistance lines. They are based on a sequence of numbers first described centuries ago.
Traders plot them between two price points: a significant high and a significant low. The tool then divides that range using set percentages. Each percentage marks a level where a pullback could stall before the trend resumes.
The Fibonacci Sequence Behind the Ratios
The Fibonacci sequence starts at 0 and 1. Every number after that is the sum of the two before it. So the run reads 0, 1, 1, 2, 3, 5, 8, 13, 21, 34, 55, 89, 144, and onwards. The key ratios are not chosen at random. They come from dividing these numbers by their neighbours:
- Divide a number by the one immediately after it and you approach 0.618, for example 55 ÷ 89 = 0.618.
- Divide it by the number two places ahead and you approach 0.382, such as 55 ÷ 144 = 0.382.
- Divide it by the number three places ahead and you approach 0.236, such as 34 ÷ 144 = 0.236.
The Key Retracement Percentages: 23.6%, 38.2%, 50%, 61.8% and 78.6%
What are the key levels of Fibonacci retracement? The tool plots five main lines. Each one shows how much of the prior move has been given back, and each carries a slightly different message about trend strength.
| Level | What it represents | Typical read |
| 23.6% | A shallow pullback | Strong trend, brief pause |
| 38.2% | A modest pullback | Healthy continuation zone |
| 50% | Half the move is given back | Popular midpoint, not Fibonacci ratio |
| 61.8% | The golden ratio | Most watched reversal zone |
| 78.6% | A deep pullback | The last line before the trend is in doubt |
Why 50% Is Included Even Though It Is Not a True Fibonacci Ratio
The 50% level does not come from the Fibonacci sequence. It survives because markets often retrace about half of a prior move, an idea rooted in Dow Theory.
Traders kept it because it works often enough to be useful. Most charting tools display it by default, sitting neatly between the 38.2% and 61.8% levels.
How Fibonacci Retracement Levels Are Calculated
How to calculate Fibonacci retracement level? The maths behind Fibonacci retracement levels is simpler than it looks. You take the size of a price move, multiply it by each ratio, then subtract or add the result from the extreme. Your platform does this instantly, but understanding the steps helps you trust the levels.
For example:
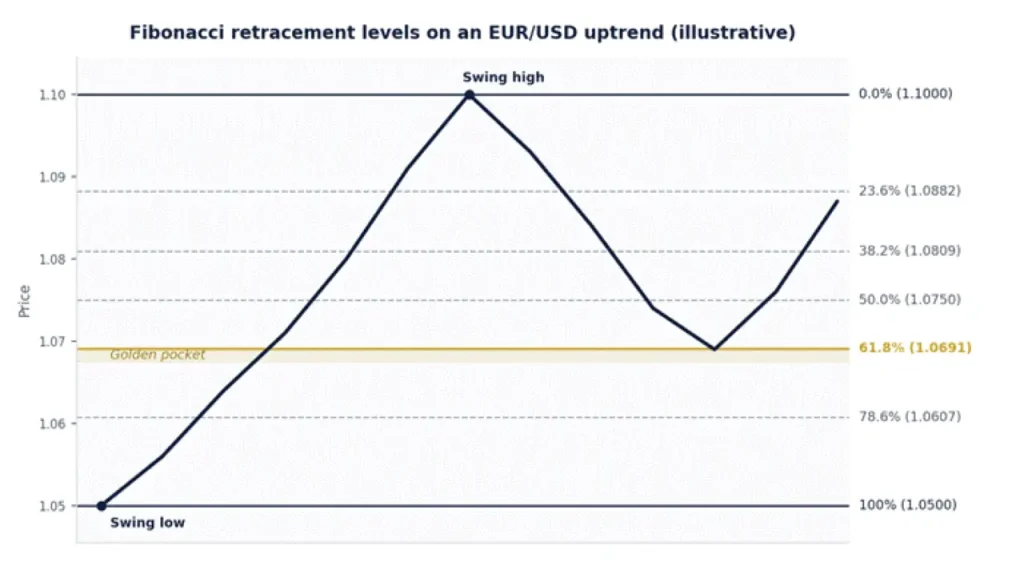
Say EUR/USD rises from a swing low of 1.0500 to a swing high of 1.1000. The move is 0.0500, or 500 pips. To find each retracement level, subtract the ratio of that range from the high:
| Level | Calculation | Price level |
| 23.6% | 1.1000 − (0.0500 × 0.236) | 1.0882 |
| 38.2% | 1.1000 − (0.0500 × 0.382) | 1.0809 |
| 50% | 1.1000 − (0.0500 × 0.500) | 1.0750 |
| 61.8% | 1.1000 − (0.0500 × 0.618) | 1.0691 |
| 78.6% | 1.1000 − (0.0500 × 0.786) | 1.0607 |
The chart below shows the same example. Notice how price pulls back into the golden pocket near 61.8% before the uptrend resumes.
Deriving 61.8%, 38.2% and 23.6% From the Sequence
- 61.8% comes from dividing a number by the next one along, such as 89 ÷ 144.
- 38.2% comes from dividing a number by valuing two places higher, such as 55 ÷ 144.
- 23.6% comes from dividing a number by the value three places higher, such as 34 ÷ 144.
- 78.6% is simply the square root of 0.618.
These relationships hold no matter how far along the sequence you go. That consistency is why the same percentages appear on every platform.
The Golden Ratio and Why 61.8% Carries the Most Weight
The golden ratio is 1.618, often written as the Greek letter phi. Its inverse, 0.618, gives the 61.8% retracement. This ratio appears throughout nature, art and architecture, which is part of its appeal.
In trading, the 61.8% level is the one most eyes are on. A pullback that holds here often signals the trend is still intact, which makes it a natural place to look for an entry.
How to Draw Fibonacci Retracement on a Chart
Drawing Fibonacci retracement levels comes down to picking two points correctly: a clear swing low and a clear swing high. Get those right and the levels line up with real market structure. Get them wrong and the tool loses its edge.
Drawing From Swing Low to Swing High in an Uptrend
In an uptrend, you measure the impulse moving from its base to its peak. Then you wait for the pullback:
- Identify the most recent significant swing low, where the up move began.
- Identify the swing high, the peak reached before the pullback started.
- Select the Fibonacci tool, click the swing low, then drag to the swing high.
- The retracement levels appear between the two points, ready to guide your entry.
Drawing From Swing High to Swing Low in a Downtrend
In a downtrend you flip the method. You measure from the top of the drop to the bottom, then watch for a bounce:
- Anchor at the swing high where the down move began.
- Drag to the swing low that ended it.
- Watch for price to rally to a level, then look for signs of fresh selling.
Adding Fibonacci Retracement on TradingView, MT4 and MT5
Every major platform includes the tool, and the steps differ only slightly:
- TradingView: choose the Fib Retracement tool from the drawing toolbar, then click your two swing points.
- MT4: go to Insert, then Fibonacci, then Retracement, and drag across the move.
- MT5: open Insert, then Objects, then Fibonacci, then Retracement.
VT Markets clients can draw Fibonacci retracement levels on both MetaTrader 4 and MetaTrader 5. That means you can keep exactly the same method across desktop and mobile without relearning the process.
How to Read Each Retracement Level
What are the best Fibonacci retracement levels? In practice, the 38.2%, 50% and 61.8% lines attract the most attention. Shallower and deeper levels still matter, but these three sit in the sweet spot where trends most often resume.
1. Shallow Pullbacks at 23.6% and 38.2%
A pullback that stops at 23.6% or 38.2% points to a strong trend. Buyers or sellers are eager and barely let the price breathe:
- 23.6% suggests momentum is powerful and the pause is brief.
- 38.2% is a common continuation zone in trending markets.
- Both levels favour traders who like to join a move early.
2. The 50% Midpoint
The 50% level is a natural balance point, because price has given back half of its move. Many reversals begin here, which makes it a favourite for patient traders waiting for better value before committing.
3. The Golden Pocket Between 61.8% and 65%
The zone between 61.8% and 65% is known as the golden pocket. It is one of the most watched areas on any chart. A trend that dips into this pocket, then turns, offers an attractive risk-to-reward entry, because your stop can sit just beyond it while your target sits far above.
4. Deep Retracements at 78.6%
A move to 78.6% is a deep retracement. Price has given back most of its gain, so this is the final level before the original trend comes into question. Entries here carry more risk. However, if the trend holds, since you are buying close to the base of the move.
How to Trade With Fibonacci Retracement Levels
Fibonacci retracement levels are most powerful as part of a plan, not a signal on their own. The aim is simple: buy pullbacks in an uptrend and sell rallies in a downtrend, using the levels to time your entry and place your stop.
1. Entering on a Pullback to a Fibonacci Level
- Wait for the price to reach a level rather than predicting it in advance.
- Look for confirmation, such as a bullish candle or a clear bounce, before entering.
- Favour levels that line up with other signals for higher-probability trades.
Confirmation is very important. A level on its own is a zone of interest, not a green light to trade.
2. Placing Stop Losses Around Fibonacci Levels
Stops belong just beyond the next level, or past the swing point itself. That way a normal wobble will not close you out, but a genuine breakdown will:
- Buying at 61.8%? Place the stop below the 78.6% level.
- Selling at 38.2%? Place the stop above the 23.6% level or the swing high.
- Size your position so the distance to your stop fits your risk limit, typically one to two percent of your account.
3. Combining Fibonacci With Support, Resistance and Moving Averages
Confluence is the real edge. When a Fibonacci level lines up with prior support and resistance, a round number or a moving average, it carries far more weight:
- A 61.8% level that meets a rising 200-day moving average is a strong zone.
- A 50% level sitting on old support adds conviction to a long.
- The more independent signals that agree, the better the setup.
4. Choosing a Timeframe
Higher timeframes produce cleaner, more reliable levels. It is because daily and four-hour charts filter out noise. A Fibonacci retracement strategy for intraday trading uses lower timeframes such as the 15-minute or one-hour chart.
This is where levels appear more often but hold less firmly. The rule of thumb is to match the timeframe to your style and then stay consistent.
Fibonacci Retracement Compared With Related Tools
Fibonacci retracement levels sit within a wider family of tools. Knowing how they differ helps you reach for the right one at the right moment.
Retracement Versus Extension
Retracement measures how far a pullback might travel inside a prior move. Fibonacci extension projects targets beyond it. In short, retracement finds your entry and extension sets your profit goal:
| Feature | Retracement | Extension |
| Purpose | Find pullback entries | Set profit targets |
| Common levels | 23.6% to 78.6% | 127.2%, 161.8%, 200% |
| Sits | Inside the prior move | Beyond the prior move |
Fibonacci Levels Versus Traditional Support and Resistance
Traditional support and resistance come from visible history, the prior highs and lows where price reacted. Fibonacci levels are calculated from a measured move.
Hence, they can flag a zone before price even arrives. The two work best side by side. When a Fibonacci level lands on a historical level, it deserves extra attention.
Reliability and Common Mistakes
Fibonacci retracement levels are not hocus pocus. Part of their power is self-fulfilling, because so many traders watch the same lines that price often reacts around them. No tool wins every time.
Used with a clear plan and firm risk control, Fibonacci retracement levels can improve your timing and bring order to otherwise messy pullbacks.
Common Mistakes When Applying Fibonacci Levels
- Choosing unclear swing points, which shifts every level and weakens the read.
- Using Fibonacci alone, with no confirmation or confluence.
- Forcing the tool onto choppy, range-bound markets where trends are weak.
- Trading against the main trend instead of with it.
- Redrawing your levels to justify a trade you already wanted to take.
Avoid these traps and the tool becomes far more consistent, session after session.
Is technical analysis still relevant in algorithm-driven markets?
Technical analysis remains relevant. It is because algorithmic systems also respond to price, volume, momentum and liquidity. Widely monitored areas such as Fibonacci retracement levels, moving averages and historical support or resistance can therefore continue to influence market behaviour.
However, algorithms can accelerate price movements and create false breakouts. Fibonacci levels should be treated as potential reaction zones rather than guaranteed turning points. It should be supported by confirmation, broader market context and disciplined risk management.
Frequently Asked Questions (FAQs)
Q1: What are the Fibonacci retracement levels?
The main Fibonacci retracement levels are 23.6%, 38.2%, 50%, 61.8% and 78.6%. Each one marks a point where a pullback might pause before the trend continues.
Q2: Is 50% a Fibonacci retracement level?
Not strictly. 50% does not come from the Fibonacci sequence. It is included because markets often retrace about half of a move, and most tools display it by default.
Q3: Do you draw Fibonacci from high to low or low to high?
It depends on the trend. In an uptrend, draw from the swing low to the swing high. In a downtrend, draw from the swing high to the swing low.
Q4: What is the golden pocket in Fibonacci retracement?
The golden pocket is the zone between the 61.8% and 65% levels. It is one of the most watched reversal areas, prized for its favourable risk-to-reward entries.
Q5: What is the best timeframe for Fibonacci retracement?
Higher timeframes such as the daily and four-hour charts tend to give more reliable levels. Intraday traders use lower timeframes, accepting more frequent but less dependable signals.
Place Fibonacci Retracement Levels to Work With VT Markets
Fibonacci retracement levels reward traders who practise, not those who chase perfection. Start by drawing them on past charts. Watch how price behaves around each ratio. Then test your approach on a demo account before you risk real capital.
With VT Markets, you can apply Fibonacci retracement levels on both MetaTrader 4 and MetaTrader 5, with fast execution and competitive spreads across forex, gold and indices.
Open an account, load your chart, and let the levels guide your next trade with more clarity and confidence.








