






Overview
- US Treasury will double long-end bond buybacks to at least $4 billion per operation from 9 September, offering short-term support to long-duration bonds and risk assets.
- US Core PCE and preliminary GDP on 26 August could shift expectations for inflation, growth and Federal Reserve policy.
- Gold remains supported above the 4,490 monitored area, while the S&P 500 could extend higher if Treasury yields ease.
- Traders should monitor USDX around 98.40, EURUSD around 1.1710 and Bitcoin after its move through 73,460 towards 80,000.
Treasury steps in as long-term yields rise
The US Treasury has moved to provide greater liquidity support to the long end of the Treasury market. From 9 September, buyback operations covering the 10-to-20-year and 20-to-30-year sectors will increase from a maximum of $2 billion to at least $4 billion per operation. The programme will run through 4 November 2026.
The announcement came after a sharp rise in long-term yields. Reuters reported that the 30-year Treasury yield reached its highest level since 2007 before falling after the buyback announcement. The 30-year yield had reached 5.34%, while the move lower following the announcement showed how sensitive the market has become to official liquidity measures.
The mechanism is straightforward. Treasury buys older long-dated bonds, increasing demand for those securities. Higher bond prices then translate into lower yields. Understanding how to analyse Treasury yield breakouts can help traders navigate these sudden shifts. The report also highlights the possibility of additional buying pressure if investors holding short positions in Treasuries close those positions after yields reverse.
However, the buyback programme does not reduce the US government’s overall debt. Treasury is effectively rearranging the maturity profile of its borrowing by buying older long-term debt while continuing to issue debt elsewhere.
The biggest issue is the supply of capital
The rise in long-term yields has not been driven solely by Federal Reserve policy or inflation expectations. The US government continues to run large deficits and needs to issue substantial amounts of debt, while private companies are also seeking capital for AI data centres, power infrastructure, semiconductor capacity and other investments.
This creates competition for available capital. Investors can demand higher returns when more borrowers compete for funding, while investors holding longer-dated bonds may also demand additional compensation for locking money away for 20 or 30 years.
This is why Treasury’s intervention may ease market pressure without removing the underlying force behind elevated yields. The report states that large government financing needs and strong private-sector demand for capital could continue to keep borrowing costs high. Traders managing multi-asset portfolios should learn how to conduct scenario analysis in CFD trading to account for prolonged yield elevation.
Recent market action supports this caution. After the initial decline following Treasury’s announcement, long-term yields moved higher again, with the 10-year yield returning towards 4.70% and the 30-year yield moving back above 5.25%. Learning how to read the 10-year Treasury yield chart provides essential context for these technical moves.
Why Yields Matter for Equities and Gold
Lower Treasury yields can ease mortgage and corporate borrowing costs while supporting equity valuations. Growth and technology stocks can be particularly sensitive because a larger portion of their expected earnings lies further in the future. When discount rates fall, the present value of those future earnings rises. Investors tracking this space can explore technology ETFs: how they work, benefits, and risks for sector-wide exposure.
The relationship also extends into commodities and currencies. A fall in US yields can reduce support for the dollar. Exploring why DXY rises in uncertain markets and how to manage risk when trading DXY CFDs can help traders structure currency trades effectively. Meanwhile, lower real yields can improve the appeal of gold. Understanding US Treasury yields and gold: why traders watch real rates clarifies why these assets move inversely.
Gold reacted strongly to the Treasury announcement, with market reports showing a sharp move above $4,500 as Treasury yields and the dollar weakened. For long-term insights, see our beginner’s guide on whether it is safe to invest in gold and our breakdown on gold and inflation: is gold really an inflation hedge?
The key question for this week is whether lower yields can hold. If Treasury yields continue to rise despite expectations for larger buybacks, markets may interpret the move as a temporary liquidity measure rather than a change in the underlying bond-market trend.
US Inflation and Growth Take Centre Stage
Wednesday brings the week’s main US macro releases. July Core PCE is forecast at 0.2% month on month, up from 0.1% previously, while preliminary Q2 GDP is forecast at 1.5%, unchanged from the previous estimate.
Core PCE remains especially important because it is closely watched by the Federal Reserve when assessing underlying inflation. The latest available June annual core PCE reading was 3.3%, well above the Fed’s 2% target.
A stronger-than-expected Core PCE reading could push Treasury yields and the dollar higher as traders reassess the path for monetary policy. Learn how to trade interest rate expectations to capitalise on these shifts. A softer reading could have the opposite effect, particularly if growth data also points towards a slower US economy.
The combination of inflation and growth will therefore be more important than either figure in isolation. When macro data conflicts, check our guide on mixed economic signals: how investors should respond. Sticky inflation with steady growth would keep pressure on long-term yields, while softer inflation alongside weaker growth could support bonds, equities, and gold.
Australia and Japan Add Regional Rate Signals
Australia’s July CPI is also due on 26 August. The market forecast is for annual inflation to slow to 3.3% from 3.8%.
The previous June CPI reading was 3.8%, while trimmed mean inflation stood at 3.6%. The Reserve Bank of Australia currently has its cash rate target at 4.35%, with the next policy update scheduled for 29 September.
A larger-than-expected fall in inflation could reduce expectations for further RBA tightening and weigh on the Australian dollar. A smaller decline would keep inflation concerns alive and could support AUDUSD.
Japan’s Tokyo Core CPI is scheduled for 28 August, with a forecast of 1.8% year on year versus 1.9% previously in the report’s calendar. Recent Japanese data showed July national core CPI at 1.8%, while core-core inflation rose to 1.9%.
The inflation data will feed into expectations around the Bank of Japan’s next policy move, keeping USDJPY sensitive to any change in rate expectations. Regional equities may also see spillovers; traders can read how to trade Hang Seng Index CFDs or how to trade China A50 Index Cash for broader Asian market exposure.
Fed Chair Warsh Could Shape the Dollar and Bond Market
Federal Reserve Chair Kevin Warsh is scheduled to speak on 28 August. The report specifically calls for traders to monitor the speech for rate-related comments.
Warsh’s comments arrive as the Treasury and Federal Reserve face different policy priorities. Treasury wants to support bond-market liquidity and keep government financing costs manageable, while the Fed needs financial conditions to remain consistent with its inflation objectives.
A message that reinforces a restrictive stance could lift the dollar and Treasury yields. Currency traders should review how to trade the USDCHF when setting up dollar-based positions. A softer signal on inflation or rates could increase pressure on yields and support gold and equities.
The market reaction may therefore extend beyond USD pairs. A shift in Treasury yields can flow through to gold, indices, and other risk-sensitive assets within minutes of the speech. Incorporating a top-down analysis in trading: a CFD trader’s guide or comparing top-down vs bottom-up fundamental analysis can assist in framing these major central bank events.
Key Symbols to Watch
USDX | EURUSD | SP500 | XAUUSD | BTCUSD
Upcoming Events
| Date | Currency | Event | Forecast | Previous | Analyst Remarks |
| 26 Aug | AUD | CPI y/y | 3.30% | 3.80% | A sharper fall in inflation could weigh on AUD as expectations for further RBA tightening ease. |
| 26 Aug | USD | Core PCE Price Index m/m | 0.20% | 0.10% | A reading above forecast could support USD and Treasury yields, while a softer figure may support gold and equities. |
| 26 Aug | USD | Prelim GDP q/q | 1.50% | 1.50% | Watch the growth signal alongside PCE. A weaker result could reinforce demand for lower yields. |
| 28 Aug | CAD | GDP m/m | 0.20% | 0.30% | A stronger reading could support CAD, while a softer figure may weigh on the currency and support USD/CAD. |
| 28 Aug | USD | Fed Chair Warsh Speaks | – | – | Focus on comments around inflation, interest rates and financial conditions. |
For a full view of upcoming economic events, check out VT Markets’ Economic Calendar.
Key Movements of The Week
USDX
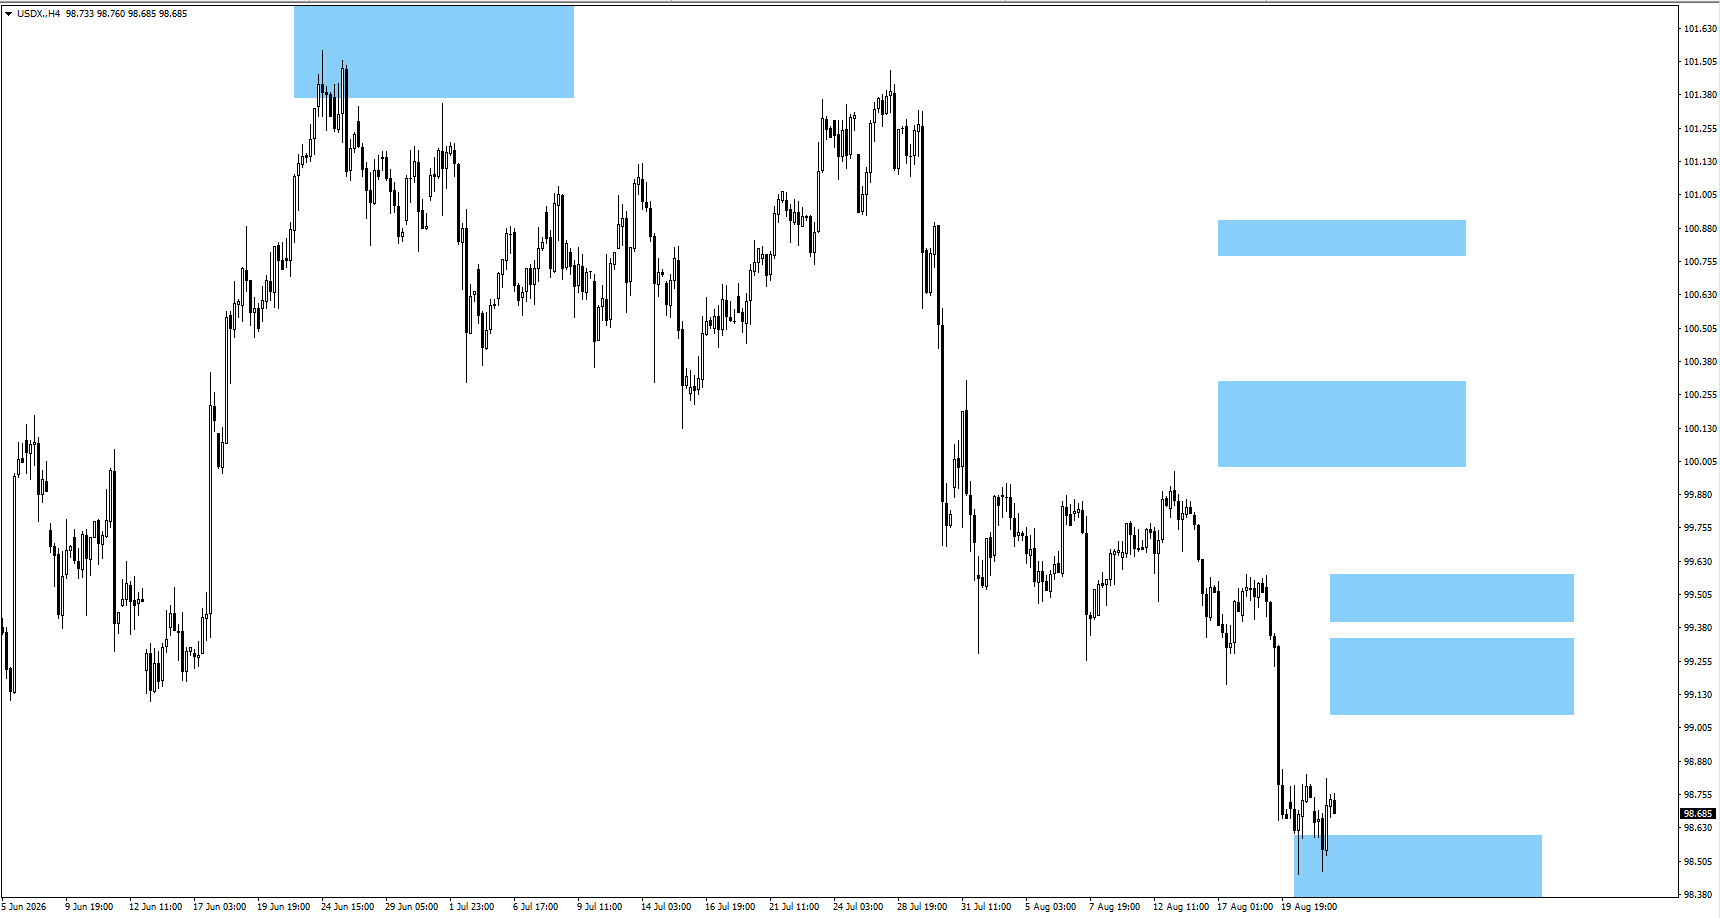
- USDX found support around the 98.40 monitored area, with the report identifying this as the key zone for price action.
- A higher move could bring 99.25 and 99.50 into focus, while a lower break would put 97.80 on watch.
EURUSD
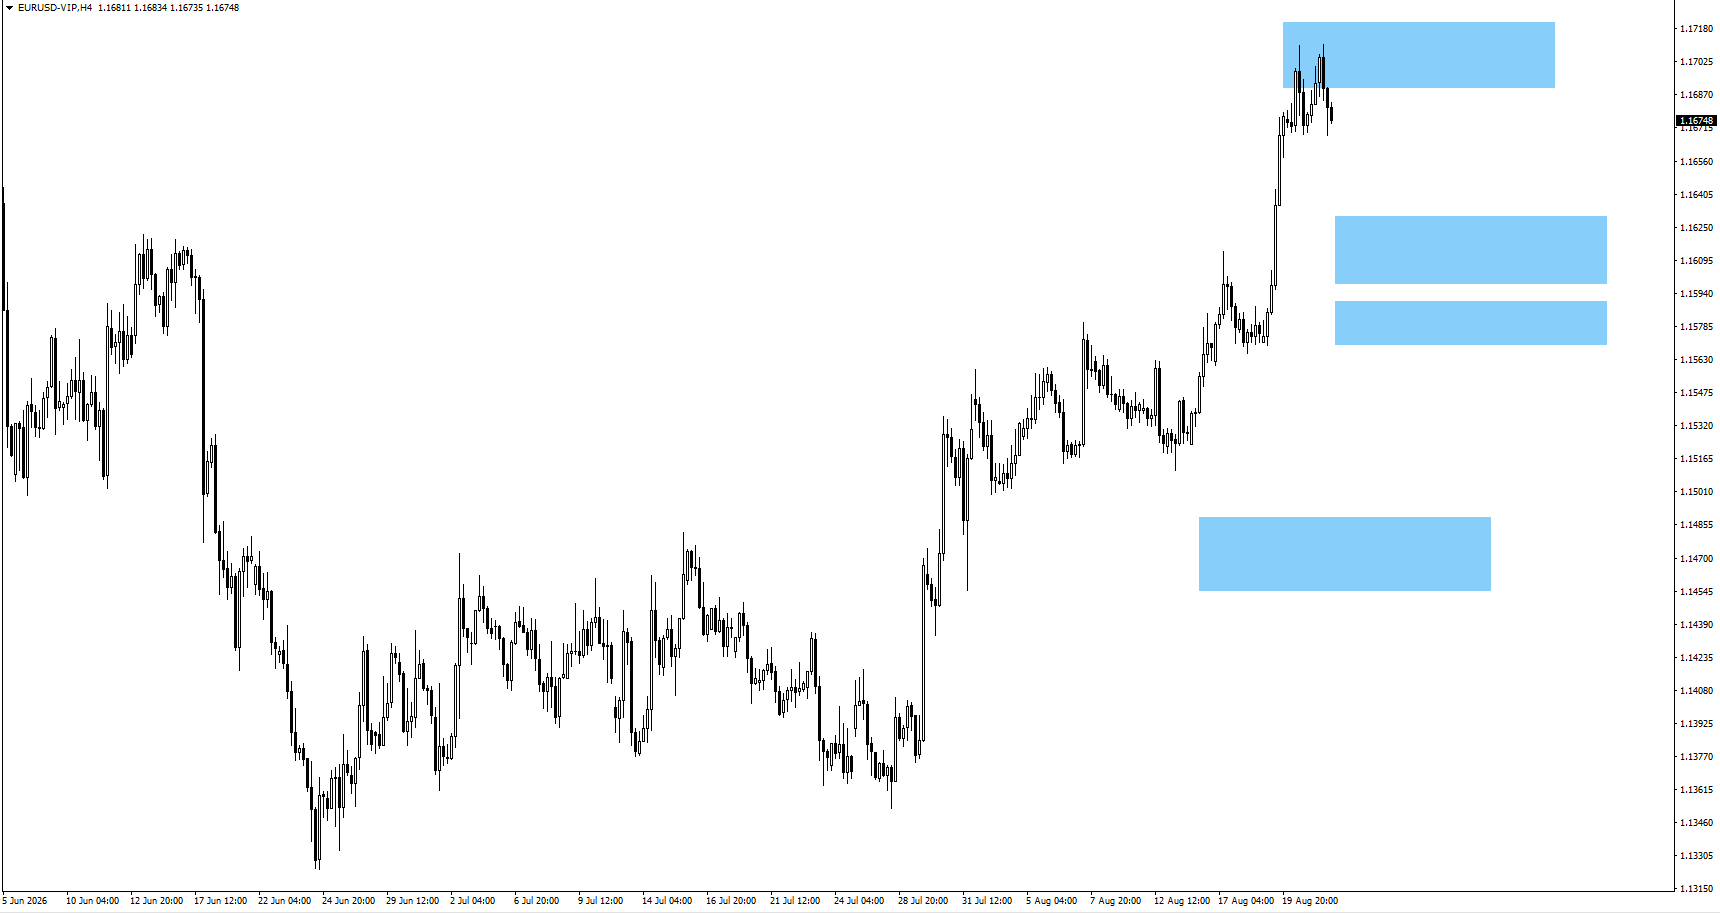
- EURUSD encountered resistance around 1.1710.
- If price moves lower, bullish price action around 1.1610 or 1.1580 could become relevant. A break higher would shift focus towards 1.1775.
GBPUSD
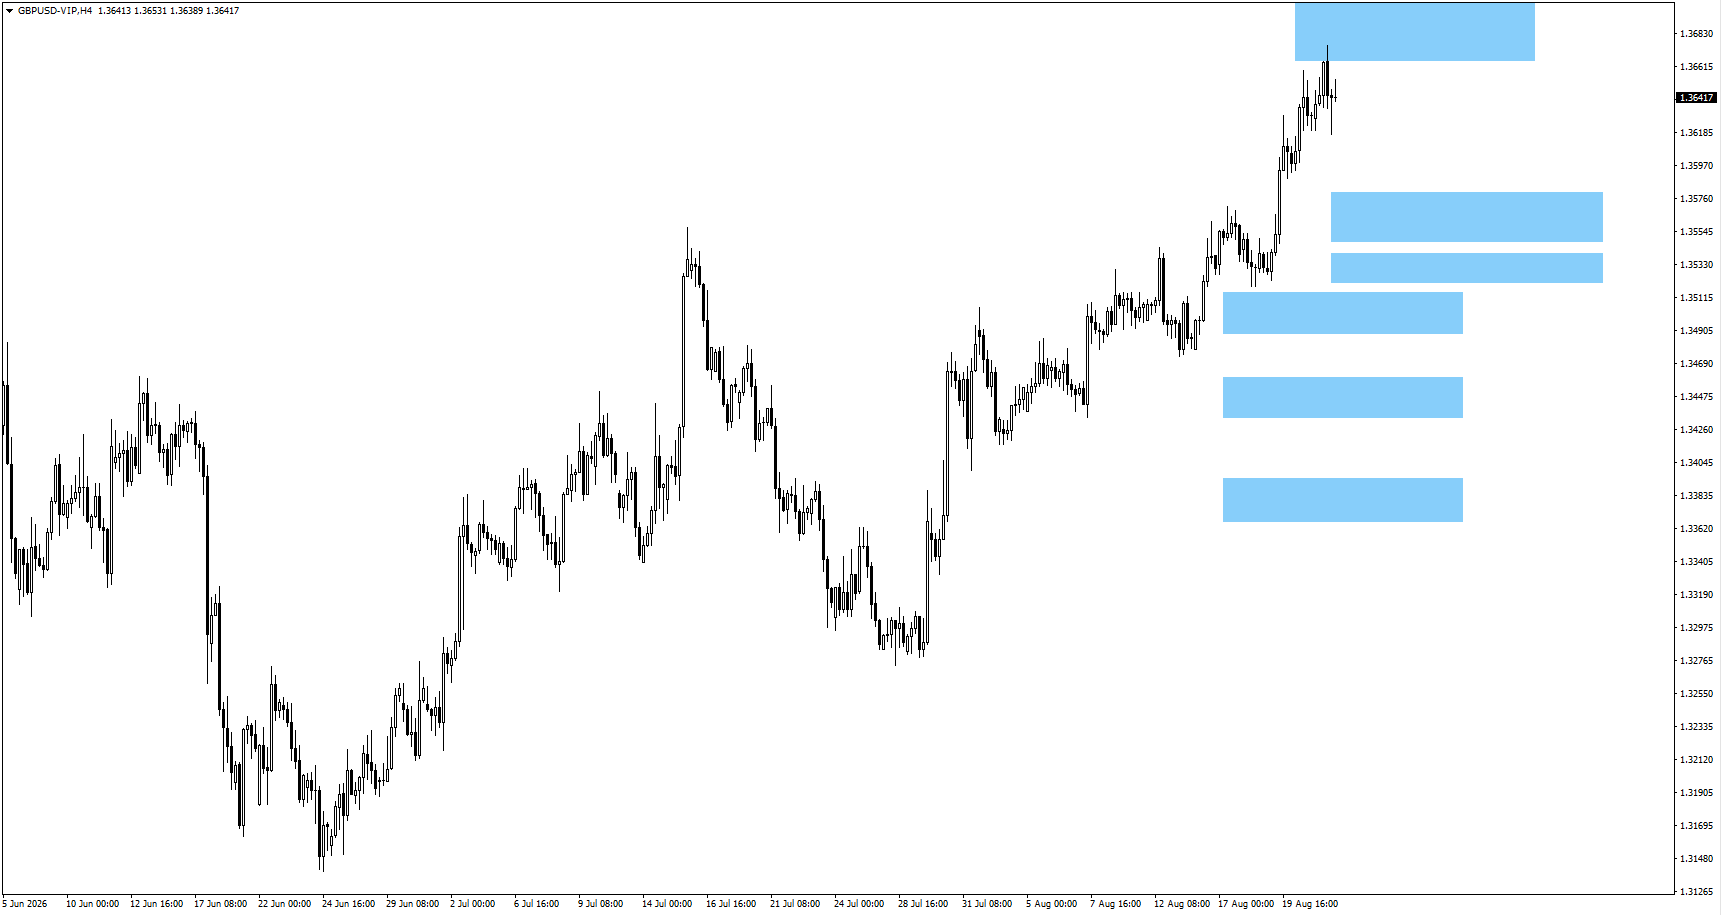
- Monitor 1.3495 for bullish price action if GBPUSD consolidates.
- A sustained move higher could open the way for further upside.
USDJPY
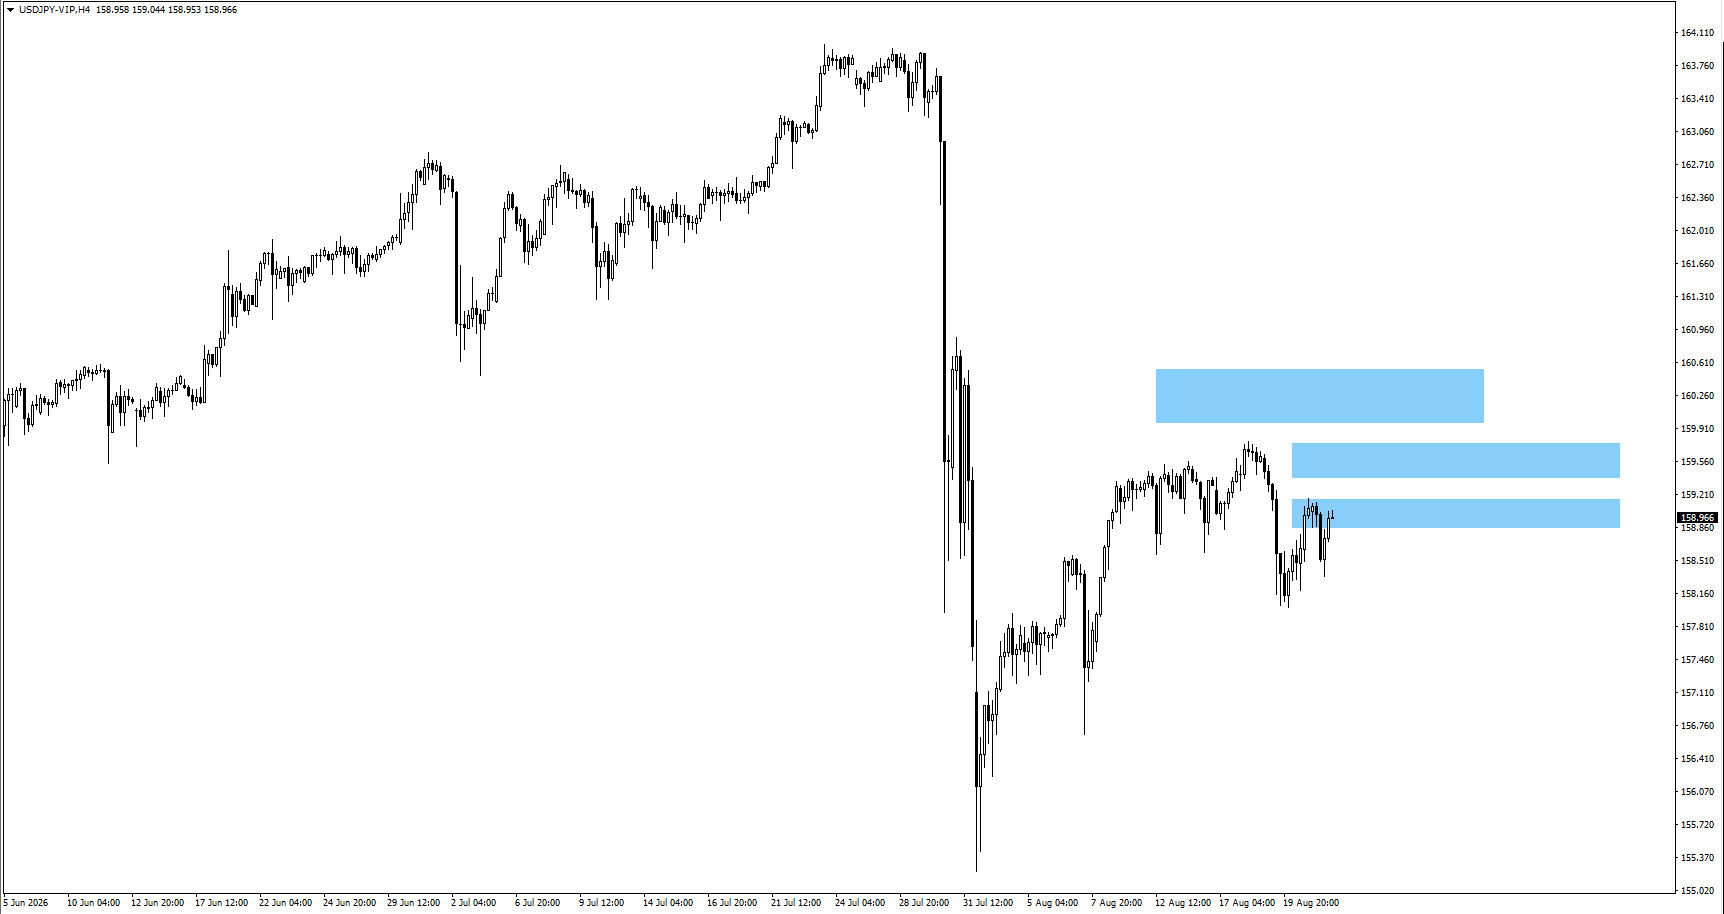
- Monitor 160.15 if USDJPY continues to rise.
- A sharp reversal from this area could increase the risk of yen strengthening and carry-trade unwinding.
XAUUSD (Gold)
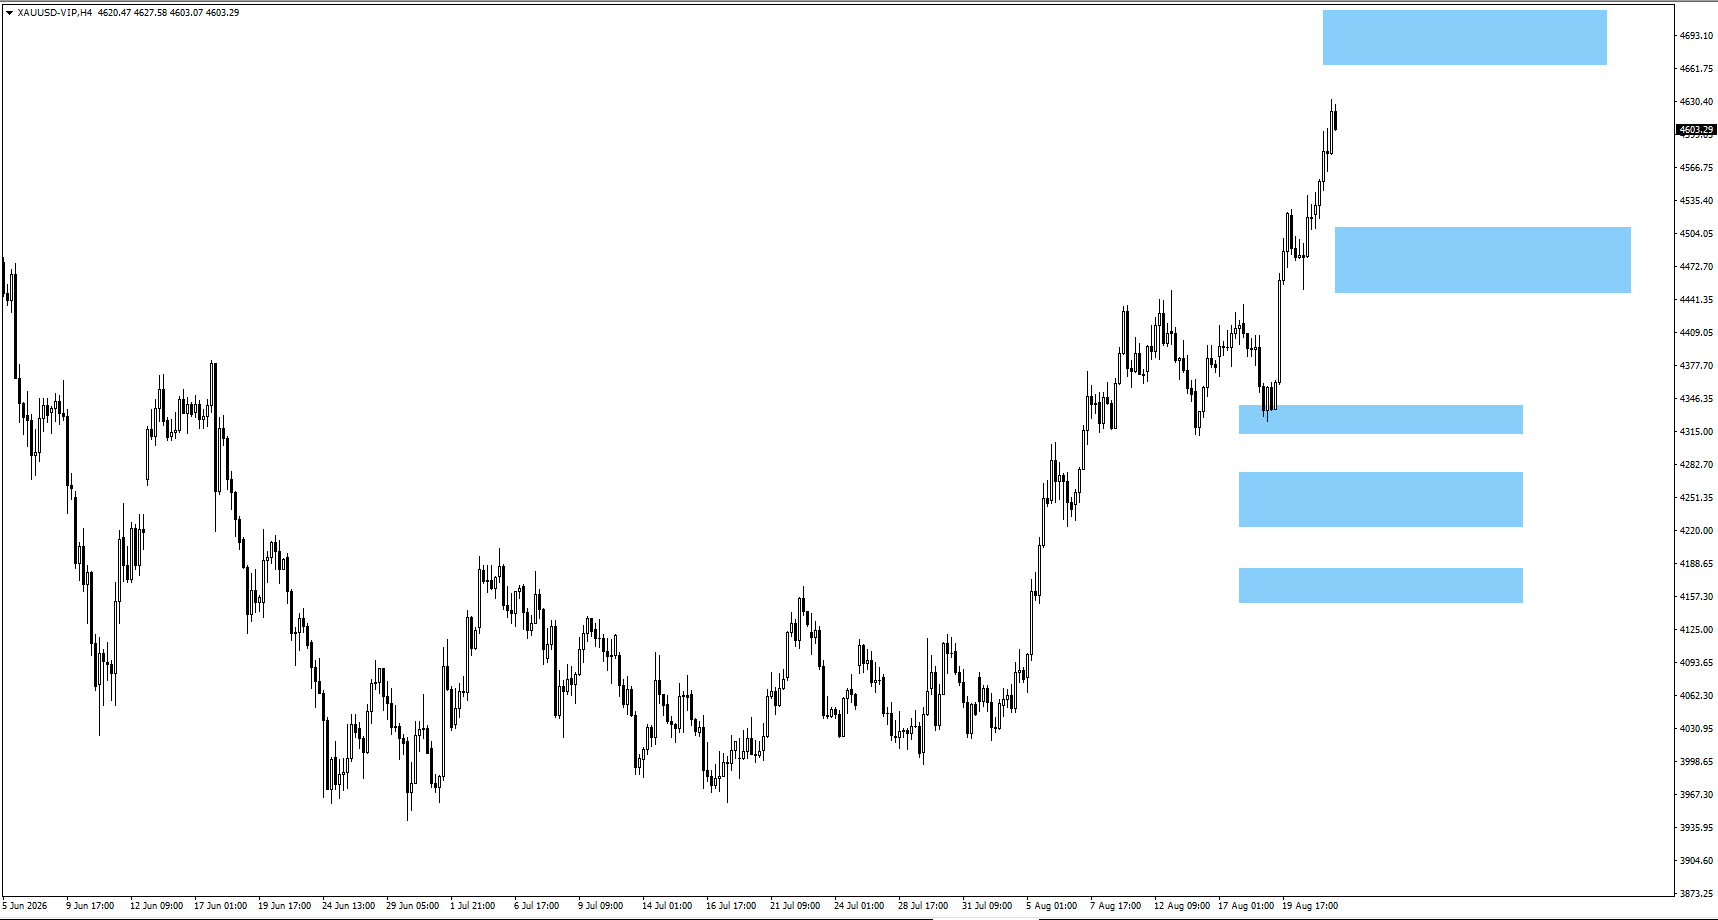
- Gold continued its upward momentum, with market reports showing a sharp rally above $4,500 after Treasury announced larger long-end buybacks.
- The 4,490 level is the bullish price-action area and 4,670 is the next level to monitor if gold continues higher.
SP500
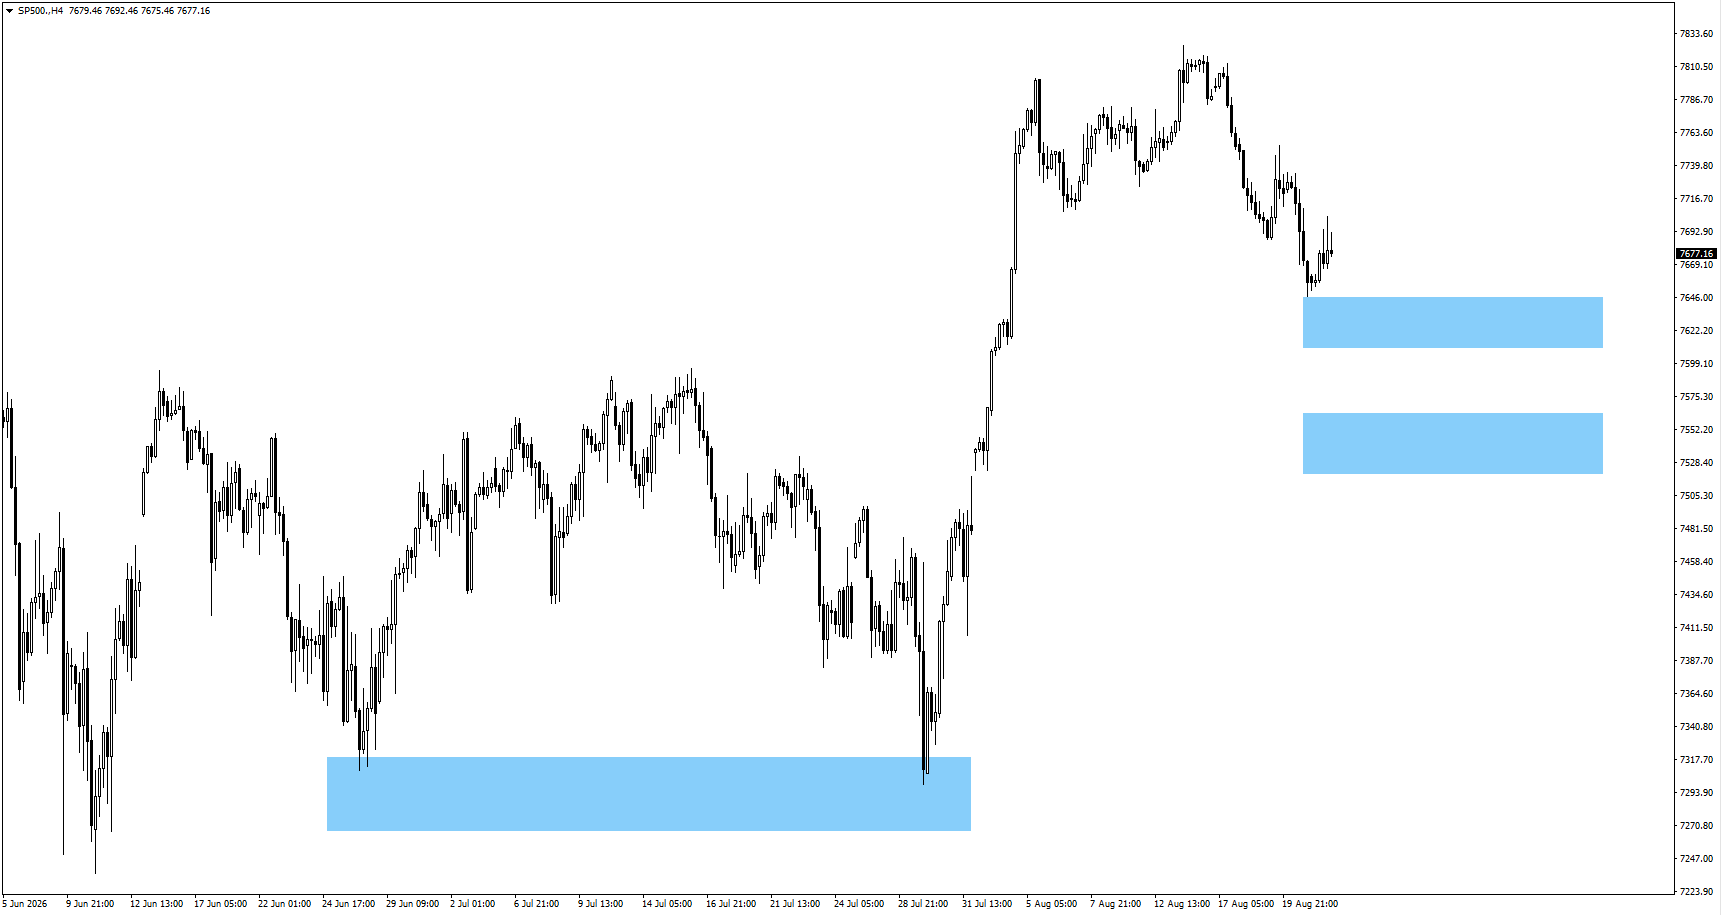
- The S&P 500 retained a constructive technical bias, with the report indicating that the index could rise from its current area.
- If the index pulls back, 7,625 and 7,565 are the key bullish price-action areas.
BTCUSD
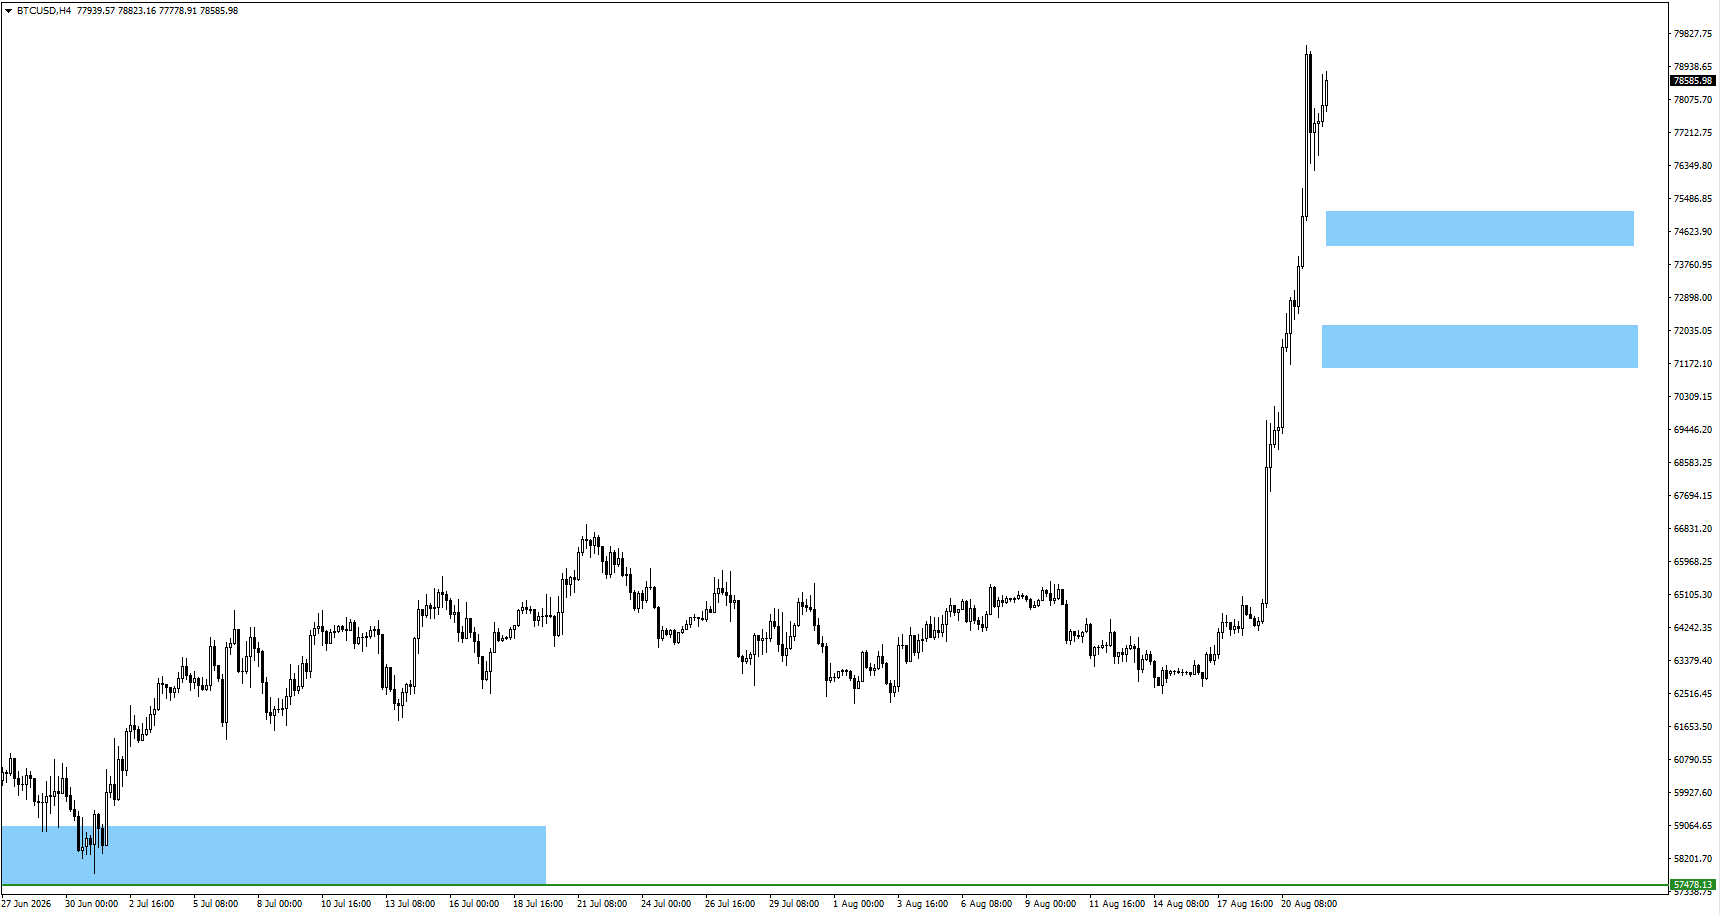
- Bitcoin traded above 73,460 and moved close to 80,000.
- If Bitcoin consolidates, bullish price action around 75,170 or 72,120 could provide areas to monitor.
Bottom Line
Markets enter the week with the Treasury bond market at the centre of the macro story. The planned increase in long-end buybacks can ease liquidity pressure, but rising government financing needs and strong private-sector demand for capital remain structural forces behind elevated yields. Traders should focus on US Core PCE and preliminary GDP on 26 August, followed by Tokyo Core CPI and Fed Chair Warsh’s speech on 28 August.
Create a live VT Markets account today to access our platform features, including market insights and educational content.
FAQs
Q: Why is the US Treasury increasing bond buybacks?
The US Treasury is doubling its long-end bond buybacks to at least $4 billion per operation starting 9 September to support market liquidity and ease pressure after long-term yields spiked.
Q: Will Treasury buybacks permanently lower long-term interest rates?
No, because buybacks rearrange borrowing maturities rather than reduce overall government debt, while high deficits and private sector capital demand continue to keep structural pressure on yields.
Q: How do changing Treasury yields affect equities and gold?
Lower yields reduce corporate borrowing costs and boost valuations for tech stocks, while lower real yields enhance the appeal of gold and weaken the US Dollar.
Q: What are the main economic releases and events to watch this week?
Traders are watching US Core PCE inflation and preliminary Q2 GDP on 26 August, followed by Tokyo Core CPI and a scheduled speech by Federal Reserve Chair Kevin Warsh on 28 August.
Q: What key technical price levels are in focus for major markets?
USDX is watching support at 98.40, Gold remains supported above 4,490 with upside focus on 4,670, S&P 500 has support around 7,625, and Bitcoin is monitoring key areas near 75,170 after approaching 80,000.
Start trading now — click here to create your real VT Markets account.








