





Technology ETFs let you invest in a basket of tech companies: software, semiconductors, cloud computing and digital services, through a single fund, instead of picking individual stocks. This guide covers how tech ETFs work, market-cap weighting, ETF units vs. ETF CFDs, key benefits and risks, and how diversification, leverage and risk management apply when trading them on MT4 and MT5.
Key Takeaways:
- Technology ETFs are exchange-traded funds that hold a basket of tech-sector shares in a single instrument.
- They spread risk across many companies, but most remain heavily weighted towards a small group of mega-cap names.
- Traders can gain exposure either by owning the fund or by trading its price movement as a CFD.
- Risk control matters more than fund selection, especially when leverage is involved.
Technology ETFs have become one of the most widely watched instruments in global markets. They give traders a single, liquid way to follow an entire sector instead of picking one company and hoping for the best.
This guide explains what technology ETFs are and how they are built, how they work in a live trading account, the main categories available, and the benefits and risks attached to them.
Each section breaks into practical sub-topics: fund construction and the “Big 6” question, a worked pricing example and the investing-versus-trading distinction, a simplified category list, the income and long-term angles, then concentration and leverage risk, followed by a step-by-step risk framework.
What Are Technology ETFs?
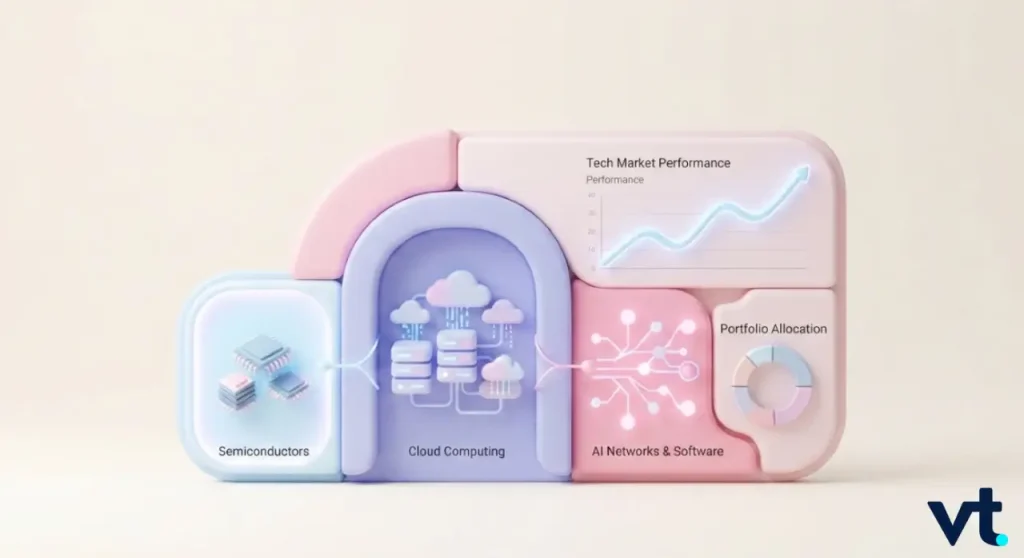
A technology ETF is a fund that holds shares in many technology companies at once. It trades on an exchange, just like an ordinary share. Buy one unit, and you gain proportional exposure to every company inside it.
The sector coverage is broad. Most funds in this space include software, semiconductors, hardware, cloud computing and IT services businesses. Some also reach into internet platforms and digital payments, depending on how the index defines “technology”.
The appeal is simple. Instead of researching thirty companies, you research one fund. Instead of one company’s earnings miss wiping out your position, the damage is diluted across the basket.
How Technology ETFs Are Built
Fund construction is where most traders stop paying attention, and it is exactly where the differences live.
The majority are market-cap weighted. That means the biggest companies get the biggest slice. A few equal-weighted alternatives exist, which give smaller firms a more meaningful voice in the portfolio.
Key structural choices to check before you trade:
- Weighting method: market-cap weighted versus equal weighted
- Management style: passive index tracking versus actively managed
- Geographic scope: US-only versus global technology exposure
- Index definition: sub-industries which are the provider counts as “technology”
- Expense ratio: the annual cost of holding the fund
Two funds with near-identical names can behave quite differently once these settings diverge.
What Is The Big 6 Tech ETF?
What is the Big 6 tech ETF? This is a common search, and the honest answer is that no single official fund carries that name. The phrase is shorthand. It describes any fund concentrated in the handful of mega-cap US technology giants that dominate the sector.
There is a related, real example worth knowing. Roundhill launched the Roundhill BIG Tech ETF (ticker BIGT) on 10 April 2023. It provides targeted exposure to a concentrated group of large technology companies.
In November 2023, the fund was renamed the Roundhill Magnificent Seven ETF (ticker MAGS) and repositioned to focus on the seven mega-cap companies commonly known as the “Magnificent Seven”: Alphabet, Amazon, Apple, Meta, Microsoft, Nvidia and Tesla.
Hence, when a trader asks about the “Big 6”, they usually mean concentrated mega-cap exposure. That distinction is crucial as concentrated funds behave very differently from broad ones.
How Technology ETFs Work In Practice
An ETF unit has a price that moves through the trading day. That price tracks the combined value of the underlying holdings, adjusted for fees and fund mechanics.
You do not need to understand index mathematics to trade one. You do need to understand what a price move is worth to your account.
A Simple Illustrative Calculation
All figures below are hypothetical and used only to show the mechanics.
Suppose a fund is priced at $250 per unit. You take a position in 20 units.
- Notional position value: 20 × $250 = $5,000
- Price rises to $255, a $5 move per unit
- Position result: 20 × $5 = $100
Now assume the same position is opened as a CFD with 5:1 leverage:
- Margin required: $5,000 ÷ 5 = $1,000
- The same $100 gain now sits against $1,000 of committed capital
- A $5 adverse move produces the same $100 loss
Leverage does not change the market. It changes what the market is worth to you. That works in both directions.
Investing In Versus Trading Technology ETFs
There are two routes to exposure, and they suit different objectives.
| Illustrative comparison | Owning ETF units | Trading ETF CFDs |
| Ownership | You own fund units | You trade price movement only |
| Direction | Long only, in most cases | Long or short |
| Capital required | Full position value | Margin only |
| Dividends | Paid by the fund | Adjustment may apply |
| Holding cost | Fund expense ratio | Overnight financing |
| Typical horizon | Months to years | Days to weeks |
Neither is superior. A long-term investor accumulating units has different needs from a trader positioning around an earnings cycle. Problems appear when someone uses a short-term tool with a long-term mindset, or the reverse.
The Main Types Of Technology ETFs
Not every fund labelled “technology” does the same job. Broad sector funds and narrow thematic funds sit at opposite ends of a risk spectrum.
A Simplified Technology ETFs List By Category
This technology etfs list groups the sector by what each category actually does, rather than by performance.
| Category | What it covers | Illustrative examples |
| Broad sector | The whole US tech sector | XLK, VGT, FTEC |
| Semiconductor | Chip designers, makers, equipment suppliers | SOXX, SMH |
| Cloud and software | Cloud infrastructure and service providers | SKYY |
| Global technology | Includes non-US tech names | IXN |
| Thematic | AI, robotics, cybersecurity themes | Varies by provider |
A few practical notes:
- Broad funds hold hundreds of names and move less violently
- Semiconductor funds are narrower and historically more volatile
- Thematic funds often overlap heavily with broad funds
- Global funds add currency exposure alongside sector exposure
Best Tech ETF For Long Term Versus Short-Term Exposure
Searches for the best tech ETF for long term exposure are extremely common. There is no universal answer. What exists instead is a set of criteria.
For a longer holding period, traders typically favour:
- Broad sector coverage rather than a single narrow theme
- A low expense ratio, since costs compound over years
- Deep liquidity and tight spreads
- A transparent, rules-based index methodology
For shorter-term positioning, the priorities flip. Liquidity and spread quality matter most, because you are paying the spread far more often.
Benefits Of Technology ETFs
The advantages are real, provided you know what you are actually buying:
- Instant diversification: One position, dozens or hundreds of companies.
- Lower single-company risk: One disappointing earnings report does not sink the whole position.
- Lower research burden: You assess a fund’s structure, not thirty balance sheets.
- High liquidity: Major funds in this sector trade in significant volume, supporting tighter spreads.
- Flexibility: CFD access allows both long and short positioning.
Here is an illustrative comparison of concentration effects. Assume a $10,000 position and one holding falls 30%.
| Illustrative scenario | Single stock | ETF with 5% weight in that stock |
| Position value | $10,000 | $10,000 |
| Exposure to the falling stock | $10,000 | $500 |
| Loss from that stock’s 30% fall | $3,000 | $150 |
That is diversification doing its job. It does not remove risk. It redistributes it.
Best Tech ETF with Dividends and the Income Question
Traders searching for the best tech ETF with dividends should set expectations early. Technology is a growth sector. Many tech companies reinvest profits into research and expansion rather than paying them out. Therefore, dividend yields here tend to be modest compared with utilities or consumer staples.
Dividend-focused funds exist. They typically screen companies with a track record of consistent payouts, and often use equal weighting to reduce top-heavy concentration.
Points worth checking on any income-oriented fund:
- The distribution frequency, whether quarterly or annual
- Whether the fund is accumulating or distributing
- The screening rule used to select dividend payers
- Tax treatment in your own jurisdiction
If you hold exposure through a CFD, you do not receive dividends directly. A dividend adjustment may apply to open positions instead.
Risks Of Technology ETFs
This is the section most traders skim, and the one that determines outcomes.
1. Concentration And Volatility Risk
The core paradox of technology ETFs is that a fund designed to diversify often ends up concentrated. As most are market-cap weighted, a small group of mega-cap names can dominate the portfolio.
The main risks to plan around:
- Concentration risk: a few large holdings drive most of the movement
- Sector risk: everything you own is exposed to the same industry conditions
- Valuation risk: growth sectors can carry premium valuations
- Overlap risk: owning three tech funds may mean owning the same companies three times
- Drawdown risk: the sector has historically fallen sharply during broad market downturns
An illustrative drawdown makes the point:
On a $10,000 position, a 25% sector decline is a $2,500 loss. With 5:1 leverage on $2,000 of margin, that same move against you would exceed your committed margin entirely.
2. Leverage And Overnight Costs
Leverage amplifies both directions. It also introduces costs that buy-and-hold investors never encounter.
| Illustrative leverage effect | 1:1 (no leverage) | 5:1 |
| Capital committed | $5,000 | $1,000 |
| 10% favourable move | +$500 | +$500 |
| Return on capital | +10% | +50% |
| 10% adverse move | –$500 | –$500 |
| Loss on capital | –10% | –50% |
Positions held overnight also incur financing charges. Over weeks, these accumulate quietly and erode returns.
How To Manage Risk When Trading Technology ETFs
Fund selection gets the attention. Risk control produces the results.
1. Position Sizing Steps
Work backwards from what you are willing to lose, not forwards from what you hope to gain.
Illustrative example on a $10,000 account:
- Set maximum risk per trade at 1% → $100
- Entry price: $250 per unit
- Stop-loss level: $244
- Risk per unit: $250 – $244 = $6
- Position size: $100 ÷ $6 = 16 units
That calculation takes thirty seconds. It also caps your worst case before you click.
Steps to apply consistently:
- Define risk per trade before choosing an entry
- Place a stop-loss order on every position, without exception
- Set a weekly or monthly loss limit and respect it
- Avoid holding several overlapping tech funds simultaneously
- Record every trade for later review
2. Pro Tips For Platform Setup
A well-configured platform removes friction from good habits.
- Pro tip 1: Use pending orders so entries follow your plan, not your mood.
- Pro tip 2: Check the trading hours of the underlying market before positioning.
- Pro tip 3: Watch spread behaviour around market open, when it typically widens.
- Pro tip 4: Test any new approach on a demo account first.
- Pro tip 5: Review overnight financing costs before holding across several sessions.
MetaTrader 4 and MetaTrader 5 both support these workflows.
VT Markets provides access to MetaTrader 4 and MetaTrader 5, alongside charting tools and trading features designed to help traders analyse markets, manage positions and execute trades efficiently.
Learn more about ETF cfd trading to understand the wider range of ETF cfds available.
Frequently Asked Questions (FAQs)
Q1: Are technology ETFs suitable for beginners?
They are more approachable than individual stock picking, because risk is spread across many companies. However, the sector is volatile. Beginners should start with small position sizes and a demo account before committing meaningful capital.
Q2: How many technology ETFs should I hold at once?
Often one is enough. Since most funds here hold the same mega-cap names, holding three can concentrate rather than diversify your exposure. Always compare top holdings before adding a second fund.
Q3: Can I trade technology ETFs in both directions?
When trading price movement as a CFD, yes. You can open long or short positions. When buying fund units outright, you are generally limited to long exposure.
Q4: What is the difference between a technology ETF and an AI ETF?
A technology ETF covers the broad tech sector. An AI ETF is a thematic fund concentrated on artificial intelligence companies. Their holdings frequently overlap, but the AI fund is narrower and typically more volatile.
Start Trading Technology ETFs With VT Markets
Technology ETFs offer an entire sector into a single, tradable instrument. They come with diversification built in, with no burden of researching individual companies. That convenience is real, and so is the volatility underneath it.
The traders who do well here are the ones who sized positions properly, used stops every time, understood what leverage was doing to their account, and reviewed their results honestly.
Treat fund selection as the beginning of the process, not the end. Know how your chosen fund is weighted. Know what a one-dollar move is worth to your position. Know your exit before you enter.
With VT Markets, you get MetaTrader 4 and MetaTrader 5 access, transparent trading conditions, and the tools to trade technology ETFs with structure and discipline.
Open a demo account, test your approach without pressure, and move to live markets when your process is ready.
CFD trading involves risk. The examples and figures in this article are illustrative only and do not represent actual or expected returns. This content is educational and is not investment advice.








