





The Relative Vigor Index (RVI) is a momentum oscillator that compares a market’s closing price to its opening price within the trading range. It shows whether buying or selling pressure is genuinely driving a move, not just the direction of price. This guide covers the RVI formula and signal line, how to read crossovers, zero line shifts, and divergence, plus the best settings for different timeframes and how to use RVI alongside other tools on MT4 and MT5.
Key Takeaways:
- The Relative Vigor Index (RVI) measures where price closes relative to where it opened, scaled against the bar’s full trading range.
- It was developed by John Ehlers and is built into both MetaTrader 4 and MetaTrader 5 as a standard oscillator.
- Readings sit between roughly -1 and +1, and there are no fixed overbought or oversold thresholds.
- The main signals are signal line crossovers, zero line crossovers and divergence against price.
- It works best as a confirmation tool alongside a trend filter, not as a standalone system.
Ask most traders what momentum is and they will point at a chart and say the market is moving fast. That is speed, not conviction. A market can move quickly and still close weakly, which is often the moment before a reversal.
The Relative Vigor Index was built to measure that difference. This guide explains what the indicator is, how it’s calculated, and how to read it on a chart.
It also compares the indicator with the RSI, stochastic oscillator, MACD, and relative volatility index. The guide also walks you through the trading signals RVI generates, and the settings for different timeframes, while flagging common costly misreadings, and outlining its limitations.
What The Relative Vigor Index Is
The Relative Vigor Index is a momentum oscillator that compares the closing price to the opening price, then measures that difference against the bar’s high-low range. The result reads conviction, not speed.
The Principle Behind The Indicator: Where Price Closes Relative To Where It Opened
The idea comes from a simple market observation. In a healthy uptrend, prices tend to close above where they opened. In a downtrend, they tend to close below. This means:
- A strong bullish bar opens near its low and closes near its high
- A weak bullish bar opens low, rallies, then gives most of it back
- Both bars can look similar in size on a chart, and the RVI separates them
How The RVI Expresses Conviction Rather Than Direction Alone
Direction tells you where the price went. RVI tells you how convincingly it got there. Consider two illustrative bars, both finishing higher on the day:
| Bar | Open | Close | High | Low | Close minus open | Range | Ratio |
| A | 1.0820 | 1.0848 | 1.0852 | 1.0818 | 28 pips | 34 pips | 0.82 |
| B | 1.0820 | 1.0826 | 1.0854 | 1.0816 | 6 pips | 38 pips | 0.16 |
Bar B travelled further. Bar A closed with far more conviction. That gap is what the indicator captures.
Where The RVI Sits Among Momentum Oscillators
Most oscillators compare closes to previous closes. This one is unusual because it uses the open as well:
- Relative Strength Index (RSI) compares average gains to average losses across closes
- Stochastic Oscillator compares the close to the recent high-low range
- The RVI compares the close to the open, scaled by the range, making it a measure of intrabar strength
How The Relative Vigor Index Is Calculated
The formula looks intimidating and is actually four straightforward stages. All figures below are illustrative.
The Numerator: Smoothing The Close Minus Open
The raw input is close minus open. That figure is noisy alone, so it is smoothed with a symmetrically weighted moving average across four bars, weighted 1, 2, 2, 1 and divided by 6.
Illustrative four-bar sequence of close minus open: 22 pips, 13 pips, 8 pips and 6 pips, newest first.
Value 1 = (22 + 2×13 + 2×8 + 6) ÷ 6 = 70 ÷ 6 = 11.67 pips
The Denominator: Smoothing The High Minus Low Range
The same weighting is applied to the bar range. This scales the result so it can be compared across instruments and volatility regimes.
Illustrative high minus low for the same bars: 32 pips, 22 pips, 17 pips and 15 pips.
Value 2 = (32 + 2×22 + 2×17 + 15) ÷ 6 = 125 ÷ 6 = 20.83 pips
Both values are then averaged over the smoothing period, which defaults to 10 bars, before the division happens.
Illustrative 10-period averages: Value 1 averages 8.4 pips, Value 2 averages 18.6 pips.
RVI = 8.4 ÷ 18.6 = 0.45
How The Signal Line Is Derived From The RVI
The signal line is the RVI put through that same 1, 2, 2, 1 weighting.
Illustrative RVI readings across four bars: 0.45, 0.41, 0.38 and 0.34.
Signal line = (0.45 + 2×0.41 + 2×0.38 + 0.34) ÷ 6 = 2.37 ÷ 6 = 0.40
- The RVI at 0.45 sits above its signal line at 0.40, a bullish configuration
- Crossovers between the two lines generate the most common entry signals
- The signal line always lags the RVI slightly by design
Why The RVI Oscillates Around Zero Rather Than A Fixed Scale
As the close-open difference can never exceed the full bar range, the ratio is naturally constrained to roughly -1 to +1. Zero means closes and opens are balanced across the period.
Positive readings mean closes are consistently above opens, negative the reverse. There is no 0 to 100 scale and no equivalent of the RSI’s 70 and 30 lines.
How To Read The RVI On A Chart
Source: TradingView
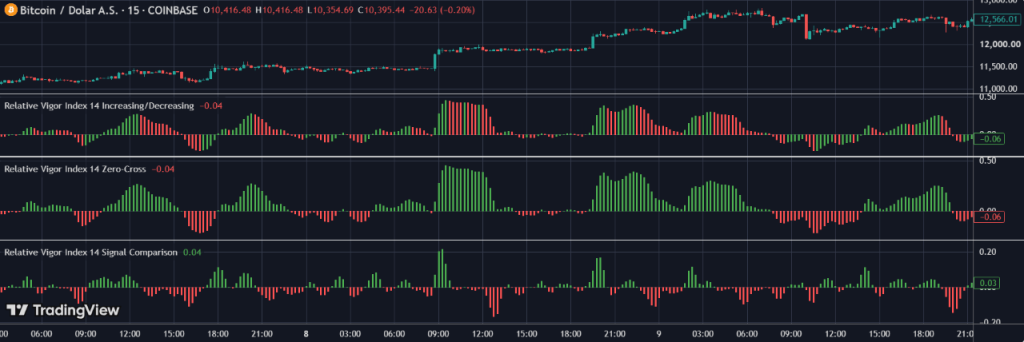
How to read RVI indicator? Three things matter: which side of zero it sits on, where it sits relative to its signal line, and which way it is sloping.
Readings Above And Below The Zero Line
The zero line is the indicator’s centre of gravity.
- Above zero: buyers are closing the period in control
- Below zero: sellers are closing the period in control
Sustained readings on one side confirm the prevailing trend
Reading The Gap Between The RVI And Its Signal Line
The distance between the two lines shows how quickly conviction is shifting:
- A widening gap means momentum is building in that direction
- A narrowing gap means momentum is fading
- Repeated tight crossovers usually mean the market is going nowhere
What The Slope Of The Line Indicates About Momentum
Slope often matters more than level. A falling RVI at +0.6 can be weaker than a rising RVI at +0.2.
- Rising slope above zero: bullish conviction strengthening
- Falling slope above zero: bullish conviction fading
- Flattening slope anywhere: a warning that the move is losing energy
How The Relative Vigor Index Compares With Similar Indicators
Four comparisons cover almost every question traders raise about this tool.
Relative Vigor Index And Relative Volatility Index: Two Different Indicators, One Acronym
Both are abbreviated RVI, and they measure completely different things.
| Relative Vigor Index | Relative Volatility Index | |
| Developed by | John Ehlers | Donald Dorsey |
| Measures | Close versus open, scaled by range | Direction of volatility |
| Core input | Price position within the bar | Standard deviation of price |
| Scale | Roughly -1 to +1 around zero | 0 to 100 |
If a platform or article does not name the developer, check the scale. A 0 to 100 reading is the volatility index.
Relative Vigor Index And The RSI
How is RVI different from RSI? The inputs differ, so the two can disagree on the same chart. RSI uses closing prices only, comparing average gains with average losses.
The Vigor index uses opens, closes, highs and lows. RSI is bounded 0 to 100 with conventional 70 and 30 thresholds. RSI answers how strong the move was, and the Vigor index answers how convincing the closes were.
Relative Vigor Index And The Stochastic Oscillator
The two look similar on a chart and share the twin-line structure. Stochastic oscillators compare the close to the recent high-low range.
The Vigor index compares the close to the open within each bar. Stochastic flags exhaustion at range extremes, the vigor index confirms participation.
Relative Vigor Index And The MACD
Moving Average Convergence Divergence (MACD) is trend-following, built from two moving averages of price. MACD confirms that a trend exists and which way it runs. The Vigor index confirms whether closes support that trend. Pairing them is common: MACD for direction, Vigor index for conviction.
Trading Signals Traders Take From The RVI
A workable Relative Vigor Index strategy is built from four signal types, filtered by trend rather than traded blind.
Signal Line Crossovers
The most widely used signal and the easiest to over-trade:
- RVI crossing above the signal line: potential long entry
- RVI crossing below the signal line: potential short entry
- Crossovers far from zero carry more weight than those hugging it
- Wait for the bar to close before acting on a cross
Zero Line Crossovers
Slower, less frequent and generally more reliable than signal line crosses:
- A move from below to above zero suggests buyers have taken control of closes
- These crosses often confirm what price structure has already shown
- Treat them as trend confirmation rather than as timing tools
Divergence Between The RVI And Price
Divergence is where the indicator earns its place, because it measures conviction directly.
- Price makes a higher high, the RVI makes a lower high: bullish conviction is fading.
- Price makes a lower low, the RVI makes a higher low: selling pressure is easing.
Divergence is a warning, not an entry. Wait for a signal line cross or a break in price structure before acting.
Using The RVI As A Confirmation Tool Alongside Trend Indicators
Here’s an illustrative worked setup on a four-hour EUR/USD chart:
- Price trades above the 200-period moving average, so only long setups are considered
- Price pulls back and the RVI dips toward zero
- The RVI crosses back above its signal line while staying above zero
- Entry is taken on the close of that bar, with a stop below the pullback low
The trend filter does the heavy lifting. The indicator only decides the timing.
Settings And Timeframes For The Relative Vigor Index
What is a good RVI? There is no single correct reading, only settings that suit your timeframe and a reading that agrees with your trend filter.
1. Why 10 Periods Is The Common Default
Ten periods is the platform default on MetaTrader 4 and MetaTrader 5, and the setting most published material assumes:
- It balances responsiveness against false signals reasonably well
- It matches roughly two trading weeks on a daily chart
- Using the default keeps your readings comparable with other traders
2. Shorter Periods And Increased Signal Frequency
- Settings of 5 to 7 react faster to changes in conviction
- Crossovers become far more frequent, suiting scalping and intraday work
- The cost is a higher share of signals that go nowhere
3. Longer Periods And Reduced Noise
- Settings of 14 to 20 smooth the line considerably
- Crossovers become rarer and generally more meaningful
- The cost is later entries and missed early moves
How Timeframe Choice Changes What The Indicator Shows
The Relative Vigor Index best settings depend far more on your holding period than on the instrument.
| Trading style | Chart timeframe | Suggested period | What you are reading |
| Scalping | 1 to 15 minute | 5 to 7 | Short bursts of intrabar conviction |
| Intraday | 30 minute to 1 hour | 10 | Session-level participation |
| Swing trading | 4 hour to daily | 10 to 14 | Multi-day conviction shifts |
| Position trading | Daily to weekly | 14 to 20 | Broad trend confirmation |
Test any change on a demo account across at least one full market cycle before applying it to live positions.
Common Misreadings Of The Relative Vigor Index
Three mistakes account for most of the frustration traders report with this tool.
1. Why The RVI Has No Fixed Overbought Or Oversold Thresholds
Traders arriving from the RSI look for 70 and 30 lines that do not exist here:
- A reading of 0.7 is not the equivalent of an RSI at 70
- What counts as a high reading varies by instrument and volatility
- Read crossovers, slope and divergence instead of hunting for thresholds
2. Treating Every Crossover As A Trade Signal
In a quiet market the two lines cross constantly, and most of those crosses lead nowhere. Filter crosses by the prevailing trend direction. Ignore crosses that occur within a narrow band around zero. Fewer trades taken well beats more trades taken mechanically.
3. Confusing Vigor With Trend Direction
A rising RVI does not mean price is rising. It means closes are strengthening relative to opens. The indicator can rise while price is still falling. That is often an early sign that selling is losing force. It is a reason to watch, not a reason to buy.
Limitations Of The Relative Vigor Index
Every oscillator has blind spots. Knowing these is what keeps the tool useful.
1. Smoothing Introduces Lag
Two rounds of smoothing sit between raw price and the plotted line. Signals arrive after the move has begun, and sharp reversals are often flagged late. Shortening the period reduces lag but increases noise.
2. Performance In Ranging Conditions
Sideways markets produce repeated crossovers with no follow-through. A flat reading near zero is itself information: stand aside. Combine with a volatility or trend filter to screen these periods out.
3. Why The Relative Vigor Index Is A Confirmation Tool Rather Than A Standalone System
It confirms conviction behind a move, it does not identify the move. It offers no entry price, stop level or position size. Paired with a trend filter and defined risk rules, it adds genuine value.
Frequently Asked Questions (FAQs)
Q1: What is the difference between the Relative Vigor Index and the Relative Volatility Index?
They share the RVI acronym but measure different things. The Relative Vigor Index, developed by John Ehlers, compares closing price to opening price relative to the bar range. It shows the conviction behind a move. The Relative Volatility Index, developed by Donald Dorsey, applies standard deviation to an RSI-style calculation to measure the direction of volatility, and is scaled 0 to 100.
Q2: Is the Relative Vigor Index the same as the RSI?
No. The RSI compares average gains to average losses across closing prices and produces a bounded reading between 0 and 100. The Relative Vigor Index compares the close-open difference to the high-low range and oscillates around zero. The two use different inputs, so they can give conflicting readings on the same chart at the same time.
Q3: Does the Relative Vigor Index have overbought and oversold levels?
No fixed levels exist. The indicator is not scaled to a 0 to 100 range, so there is no equivalent of the RSI’s 70 and 30 thresholds. Traders read it instead through signal line crossovers, zero line crossovers, the slope of the line and divergence against price.
Q4: What are the best settings for the Relative Vigor Index?
A 10-period setting is the common default and the one most platforms apply automatically. Shorter periods of 5 to 7 produce more frequent signals with more noise, which suits intraday work. Longer periods of 14 to 20 smooth the line and reduce false crossovers, which suits swing and position trading. The right choice depends on your holding period rather than on a single optimal value.
Place The Relative Vigor Index To Work With VT Markets
The Relative Vigor Index will not tell you where the market is going. What it will tell you is whether the move in front of you has real participation behind it. So, that is often the difference between a trade worth taking and one worth skipping.
Start by loading it with the default 10-period setting, add a trend filter, and spend a few weeks watching how crossovers behave in trending versus ranging conditions before you risk capital. Then test your strategy on a demo account across a full market cycle.
With VT Markets, access MetaTrader 4 and MetaTrader 5 platforms to analyse markets across forex, gold, indices and more, then test your trading strategies on a demo account before going live.








