





Key Takeaways
- The gold-silver ratio shows how many ounces of silver it takes to buy one ounce of gold.
- You calculate it by dividing the gold price by the silver price. In mid-July 2026, that is roughly $4,060 ÷ $58, or about 70.
- A high ratio suggests silver looks cheap against gold. A low ratio suggests gold looks cheap against silver.
- Traders use the ratio to switch between the two metals. It is not a tool for predicting exact prices.
- With a MetaTrader 4 or MetaTrader 5 broker, you can trade both gold and silver as CFDs from a single account.
Gold and silver tend to move together. They rarely move in step. One runs ahead. The other lags behind. The gold-silver ratio is the single number that captures that gap. It tells you how many ounces of silver it takes to buy one ounce of gold.
For a trader, that number is far more than trivia. It is a relative value signal. It hints at which metal looks cheap and which looks expensive right now. Used well, the gold-silver ratio can guide when you buy, when you switch, and how you size each position.
In this guide, you will find out how the ratio is worked out, what history reveals, and how to trade it as a CFD on a MetaTrader 4 or MetaTrader 5 platform. Expect simple examples, current 2026 figures, and pro tips you can use on your next session.
What Is the Gold-Silver Ratio?
The gold-silver ratio measures the price of gold against the price of silver. In plain terms, it answers one question. How many ounces of silver equal the value of one ounce of gold?
In recent times, the gold-silver ratio floats freely. The market sets it, not a government.
A few points worth holding on to:
- The ratio is a measure of relative value, not absolute price.
- It does not tell you whether silver is cheap in dollar terms. It tells you whether silver is cheap against gold.
- It uses spot prices, the live price for immediate settlement.
- The same idea can be applied to other pairs, such as the gold-to-platinum ratio.
How Is the Gold-Silver Ratio Calculated?
Divide the gold price per ounce by the silver price per ounce.
Gold-Silver Ratio = Gold Price ÷ Silver Price
Here is a worked example using mid-July 2026 figures:
- Gold spot price: about $4,060 per troy ounce.
- Silver spot price: about $58 per troy ounce.
- $4,060 ÷ $58 = roughly 70.
So the ratio sits near 70. It takes about 70 ounces of silver to match one ounce of gold. You do not need special software. A gold silver ratio calculator is really just this one line of division, and most charting sites run it live for you.
Pro tip: On MetaTrader, open XAUUSD for gold and XAGUSD for silver. Read both prices. Divide the gold price by the silver price. You now have the live ratio in seconds.
What Does the Gold-Silver Ratio Tell You?
The ratio strips away the noise of dollar prices. It leaves you with one clean signal: how the two metals are valued against each other.
Here is what different readings tend to suggest:
- A high ratio hints that silver is cheap relative to gold.
- A low ratio hints that gold is cheap relative to silver.
- A reading near the long-run average suggests the two are more evenly priced.
Take it as a value gauge for the metals complex. It will not call the exact top or bottom. It simply tells you where the balance of value sits today.
Where Can You Find the Current Ratio?
You have several easy ways to track the ratio in real time:
- Dedicated metals sites publish a live ratio and a historical chart.
- Most trading platforms let you build the ratio of XAUUSD and XAGUSD.
- A quick manual sum with any gold silver ratio calculator works in a pinch.
On a MetaTrader 4 or MetaTrader 5 account, the cleanest method is to watch both metals side by side. Add XAUUSD and XAGUSD to your Market Watch. Note the two spot prices. Divide, and you have the ratio without leaving the platform.
| Metal | Symbol | Approximate spot price, 13 July 2026 | Role in the ratio |
| Gold | XAU/USD | Approximately US$4,070 per troy oz | Numerator |
| Silver | XAG/USD | Approximately US$58.88 per troy oz | Denominator |
| Gold-silver ratio | — | Approximately 69.2 | US$4,070 ÷ US$58.88 |
Sources: LBMA Gold Price, LBMA Silver Price, TradingView XAU/USD, TradingView XAG/USD
What Is the Historical Gold-Silver Ratio?
History gives the ratio its context. A reading of 70 means little on its own. Set against decades of data, it starts to speak. The historical gold-silver ratio shows a clear pattern. It swings to extremes, then reverts toward its long-run average.
What Has the Ratio Averaged Over Time?
Averages depend on the era you pick. That matters, so treat any single “normal” with care.
- Over the past 50 years, the gold-silver ratio has averaged roughly 60:1.
- Across the 20th century, it averaged closer to 47:1.
- Under the old bimetallic standards, it sat between 12:1 and 15:1.
Over the past 50 years, the gold-silver ratio has averaged approximately 67:1. On 13 July 2026, spot gold at US$4,072.49 and spot silver at US$58.8795 implied a ratio of approximately 69.2:1. A ratio near 69 means silver was slightly cheaper relative to gold than the 50-year average, but it does not independently prove that silver was undervalued.
What Were the Highest and Lowest Readings?
The extremes are where the story gets interesting.
- Modern low: about 17:1 in January 1980, during the Hunt brothers’ silver squeeze.
- 2011 low: about 32:1, as silver ran close to $50 an ounce.
- Modern high: about 125:1 in March 2020, during the COVID panic.
- April 2025: the ratio pushed above 100:1, a rare statistical extreme.
Each time the gold-silver ratio hit an extreme, it eventually reversed. That tendency to snap back is the heart of most ratio strategies.
How the Ratio Has Moved During Major Market Events
The ratio is a useful mirror of market stress. It tends to spike when fear takes over, then compress when confidence returns.
| Period | Gold, approx. | Silver, approx. | Gold-silver ratio | Context |
| 21 Jan 1980 | US$850 | US$49.45 | ~17.2:1 | Gold and silver reached major peaks during the Hunt brothers’ attempt to manipulate and corner the silver market. |
| 29 Apr 2011 | US$1,563.30 | US$48.03 | ~32.5:1 | Silver remained near its 2011 record after gaining almost 27% during April, while gold reached new highs amid low-rate and inflation concerns. |
| 18 Mar 2020 | US$1,477.30 | US$11.74 | ~125.9:1 | COVID-19 market stress hit silver harder than gold, pushing the ratio to an extreme level. |
| 22 Apr 2025 | US$3,436.70 | US$32.76 | ~104.9:1 | Gold strongly outperformed silver, lifting the ratio above 100. It later narrowed as silver began to outperform. |
| 29 Jan 2026 | US$5,330.20 | US$114.14 | ~46.7:1 | Both metals had reached nominal record highs earlier in the session before retreating sharply. |
Sources: Reuters, April 2011, GoldPrice.org, March 2020, GoldPrice.org, April 2025, Reuters, January 2026.
Note: Prices are stated in US dollars per troy ounce. The January 1980 row uses reported peak levels, while the other rows use same-day spot or closing reference levels from the cited sources. The gold-silver ratio is calculated by dividing the gold price by the silver price. Results may differ slightly according to the quotation time, market venue and data provider.
Notice the rhythm. Stress pushes the ratio up as investors crowd into gold, the classic safe-haven asset. Recovery pulls it back down as silver plays catch-up. In 2025 that pattern paid off well. Gold rose about 67%, but silver surged roughly 147%, and the ratio compressed sharply.
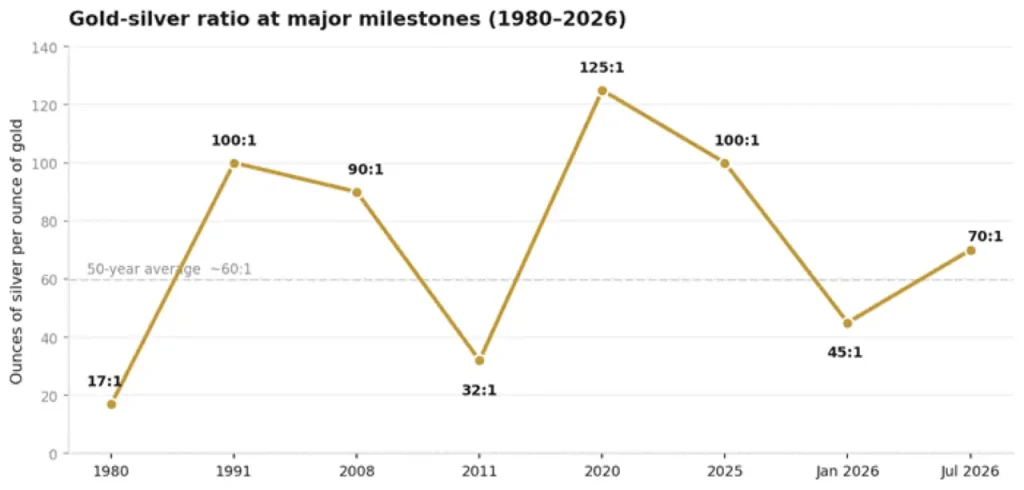
Chart: The gold-silver ratio swings to extremes, then reverts toward its long-run average. Figures are approximate.
What Is a High or Low Gold-Silver Ratio?
So what counts as high, and what counts as low? There is no official line. But history gives us useful markers to work with.
What Does a High Ratio Mean?
A high gold-silver ratio means one ounce of gold buys a lot of silver. It signals that silver is historically cheap against gold.
- Readings above 80:1 have often flagged silver undervalued versus gold.
- Readings above 100:1 are rare. They have occurred only a handful of times in modern history.
- High readings have frequently come before strong silver rallies as the ratio reverted.
A high ratio does not guarantee silver will rise. It simply tilts the odds and the value case toward silver.
What Does a Low Ratio Mean?
A low gold-silver ratio means it takes far fewer ounces of silver to buy an ounce of gold. It suggests silver has become expensive relative to gold, or that gold looks cheap.
- Readings below 50:1 have often marked gold as relatively undervalued.
- Readings below 20:1 are extreme and very rare.
- At low readings, some traders trim silver and lean back toward gold.
In short, a low ratio flips the earlier logic. The value case shifts from silver toward gold.
Is There Such a Thing as a Good Gold-Silver Ratio?
Traders often ask what is a good gold to silver ratio. The forthright answer is that “good” depends on your position and your goal.
- If you already hold silver, a low ratio is good. Your silver has outperformed.
- If you want to buy silver, a high ratio is good. Silver is on sale against gold.
- If you hold a balanced mix, a reading near the 60:1 average keeps things steady.
There is no single perfect number. A good gold-silver ratio is simply one that lines up with your plan. Context beats any fixed figure.
Why Does the Gold-Silver Ratio Change?
The ratio moves because gold and silver answer to different masters. Gold is mostly a monetary metal. Silver wears two hats, monetary and industrial. That split drives most of the action.
Why Silver Is More Volatile Than Gold
Silver is the smaller, thinner market. That makes it far more volatile than gold. When money floods in, silver moves hard. When money flees, it falls just as fast.
- Silver’s market is a fraction of gold’s size, so prices swing more.
- Silver often lags gold early in a rally, then overtakes it later.
- Sharp silver moves are the main reason the gold-silver ratio can shift quickly.
That volatility cuts both ways. It creates opportunity and risk in equal measure, which is why risk management matters so much here.
How Industrial Demand Moves the Ratio
According to the World Silver Survey 2026, industrial demand totalled 657.4 million ounces in 2025, compared with total silver demand of 1,130.6 million ounces.
Industrial uses therefore represented approximately 58.1% of total silver demand in 2025. For 2026, the report forecasts industrial demand of 639.6 million ounces, equivalent to approximately 57.5% of forecast.
Solar panels, semiconductors and electric-vehicle parts all rely on it. Gold has no such heavy industrial pull.
- Strong factory and solar demand lifts silver and can push the ratio down.
- A slowing economy hits industrial demand for silver first, nudging the ratio up.
- Silver’s structural supply deficit in 2026 has kept the metal firmly in focus.
This industrial angle is unique to silver. It is a key reason the two metals drift apart over time.
How Risk Sentiment and the Economy Affect It
Mood matters. During fear, investors sprint to gold, the traditional safe-haven asset. Silver, with its industrial side, often gets left behind at first.
- Panic and recession fears tend to widen the ratio.
- Recovery and healthy risk appetite tend to narrow it.
- Interest rates, inflation and the US dollar all feed into both metals.
In 2026, a more hawkish US Federal Reserve pressured both metals and reshaped the ratio throughout the year. Macro conditions are always part of the picture.
How to Use the Gold-Silver Ratio in Trading
Now for the part that pays. As a CFD trader, you can act on the ratio without ever owning a bar of metal. With a broker such as VT Markets, CFD trading lets you go long or short on both XAUUSD and XAGUSD from one MetaTrader account.
How Ratio Trading and Metal Switching Work
The classic approach is ratio trading, sometimes called metal switching. The idea is to hold the cheaper metal, then swap when the ratio flips.
Here is the logic in steps:
- When the ratio is high, favour silver. Silver is cheap against gold.
- When the ratio is low, favour gold. Gold is cheap against silver.
- When the ratio reverts, switch back and bank the relative gains.
This raises the common question of gold to silver ratio when to buy. Many traders use rule-based triggers rather than gut feel.
That brings us to the switching rule. So what is the 80/50 rule for gold to silver? It is a simple threshold system:
- Switch into silver when the ratio climbs above 80.
- Switch back into gold when the ratio falls to around 50.
Since the mid-1980s, the gold-silver ratio has moved above 80 and below 50 at irregular intervals. Historical examples include a ratio of near 100 in 1991, approximately 31 in April 2011, above 123 in March 2020 and around 104–105 in April–May 2025.
The 80/50 rule would have produced only a handful of trades over the decades, yet the amount of metal held. It is a patient, mechanical way to trade mean reversion.
How to Weigh Gold Against Silver
You do not have to switch fully. Many traders simply tilt their weight instead.
- At a high ratio, lean your exposure to silver (XAGUSD).
- At a low ratio, lean toward gold (XAUUSD).
- Near the average, keep a balanced split between the two.
For pure ratio traders, a spread trade goes further. You go long the cheap metal and short the expensive one. That is a market-neutral bet on the gold-silver ratio itself, rather than on the direction of metal prices.
How to Combine the Ratio With Other Analysis
The ratio works best as one input, not the whole strategy. Blend it with other tools for a fuller picture.
- Use technical analysis on XAUUSD and XAGUSD for entries and exits.
- Watch macro drivers such as rates, inflation and the dollar.
- Always apply stop-loss and take-profit orders to keep risk in check.
Pro tip: Treat an extreme ratio as a “get ready” alert, not an instant “buy now” button. Wait for price action to confirm before you commit real capital.
Limits of the Gold-Silver Ratio
The gold-silver ratio is powerful, but it is not invisible. Knowing its limits keeps you honest and protects your account.
Is the Ratio a Reliable Signal?
The ratio is a guide, not a guarantee. Its mean-reversion tendency is strong but never certain.
- Extremes can persist for months, sometimes years.
- Anyone who bet on reversion too early has had to wait a long time to be right.
- The ratio says nothing about absolute value. Both metals can be dear or cheap at once.
Use it for context and probability. Do not treat it as a crystal ball.
Does It Predict Future Prices?
No single number can predict prices, and the gold-silver ratio is no exception. It measures relative value, not future direction.
- A high ratio does not promise silver will rise tomorrow.
- A low ratio does not promise gold will rise tomorrow.
- Timing still depends on wider market forces.
The ratio tilts the odds in your favour. It does not remove the risk.
Why the Normal Range Can Shift Over Time
What counts as “normal” is not fixed. The average has crept higher over the decades. Silver’s demonetisation and gold’s rise as a reserve asset both played a part.
- The 20th-century average of ~47:1 sits well below the modern ~60:1.
- Growing solar and tech demand could pull the range lower again.
- Comparing today’s ratio with 1950 can mislead more than it helps.
Judge the gold-silver ratio against its recent range, not against ancient history. The goalposts move.
Apart from understanding the gold-silver ratio in trading, find out about how other safe haven assets flow through the US Dollar, Japanese yen and bonds.
Frequently Asked Questions (FAQs)
What is the gold-silver ratio?
The gold-silver ratio is the price of gold divided by the price of silver. It shows how many ounces of silver it takes to buy one ounce of gold. In mid-July 2026, with gold near $4,060 and silver near $58, the ratio sits around 70. Traders use it to compare the relative value of the two metals.
How do you calculate the gold-silver ratio?
Divide the gold spot price per ounce by the silver spot price per ounce. For example, $4,060 ÷ $58 gives a ratio of about 70. You can do this with any gold silver ratio calculator, or build it live on a MetaTrader platform using XAUUSD and XAGUSD.
What is a high gold-silver ratio?
A high ratio is generally a reading above 80:1. It means silver is historically cheap against gold. Readings above 100:1 are rare and have often come before strong silver rallies as the ratio reverted toward its average.
What is a low gold-silver ratio?
A low ratio is generally a reading below 50:1. It suggests silver has become expensive relative to gold, or that gold looks cheap. At low readings, many traders lean back toward gold rather than silver.
Why does the gold-silver ratio change?
The ratio changes because gold and silver respond to different forces. Gold is mainly a monetary metal, while silver is both monetary and industrial. Shifts in industrial demand, risk sentiment, interest rates and silver’s higher volatility all move the gold-silver ratio.
Start Trading the Gold-Silver Ratio With VT Markets
The gold-silver ratio turns two separate prices into one clear signal. It shows you where value sits, when to lean toward silver, and when to swing back to gold. Paired with sound risk management, it can sharpen your timing right across the metals market.
The best way to learn is to watch it live and trade it small. Add XAUUSD and XAGUSD to your Market Watch. Track the ratio each day. Test the 80/50 rule on a demo account before you risk real capital.
With VT Markets, you can trade both gold and silver as CFDs on MetaTrader 4 and MetaTrader 5, with fast execution and competitive spreads. Open your account with VT Markets, and start putting the gold-silver ratio to work on your next trade.








