





Scenario analysis in CFD trading is a risk management method that models how a position and account balance might perform under different market conditions before a trade is placed. By testing best case, base case, worst case and tail scenarios, traders can see the possible profit, loss and margin impact instead of relying only on market expectations. This guide covers how to run scenario analysis for CFD positions, how leverage affects risk, how to model margin, position size and account exposure, and how to factor in overnight financing, spread widening and market gaps when planning trades on MT4 and MT5.
Key Takeaways:
- Scenario analysis in CFD trading means calculating profit, loss and margin impact across a defined range of price moves before you enter a trade.
- Leverage magnifies every outcome, so your worst case should decide your position size.
- A three-case model covers most trades, with a fourth tail case added before scheduled events.
- Overnight financing, spread widening and weekend gaps belong inside the model, not outside it.
- Traders can build these models in a spreadsheet and check them against live margin figures on MetaTrader 4 and MetaTrader 5.
Most losing trades are not caused by one poor entry. They are caused by a trader who never worked out what would happen if the market moved the other way. Scenario analysis in CFD trading is the discipline that closes that gap. It replaces hope with arithmetic.
This guide explains what the method means and why leverage changes its purpose. It covers the five steps to run it, and how to work out free margin in each case. It also compares this method to other risk methods, so you can see how it’s different.
You will also learn the costs that most models miss, and show you how to use the method across multiple trades at once and many more.
What Scenario Analysis In CFD Trading Means
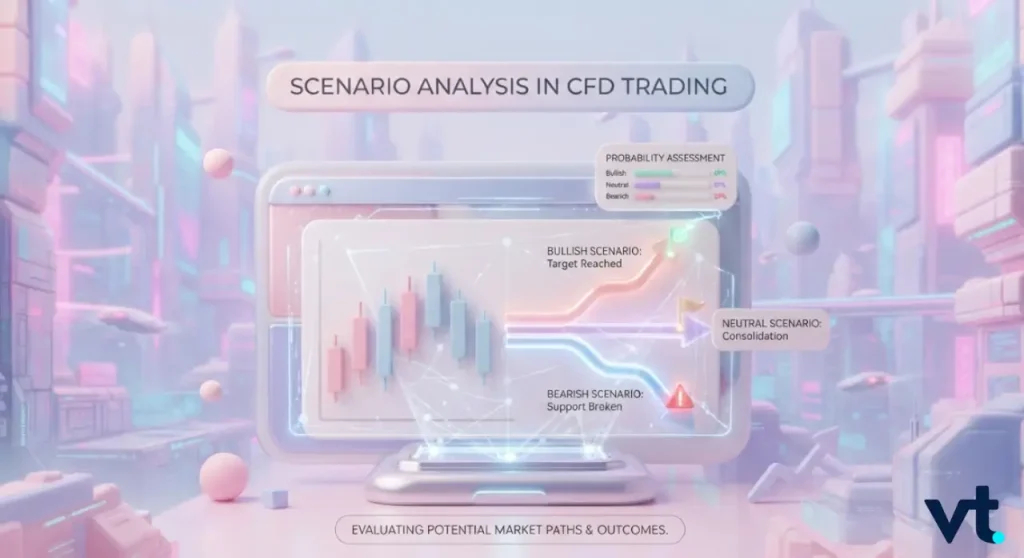
Scenario analysis in CFD trading is the practice of calculating what happens to a position, and to your account equity, across a defined range of market moves before the trade is placed. You are not predicting. You are preparing.
How Leverage Changes the Purpose of Scenario Analysis in CFD Trading
In an unleveraged account, a 2% move against you costs 2% of the capital committed. In a leveraged account, the same move can cost a multiple of that.
That single difference reframes the exercise:
- The output you care about is margin impact, not just profit and loss
- A move that looks small on a chart can be large on your balance
- Downside risk compounds faster than most traders expect
The Three Cases Every CFD Trader Should Model
Three cases handle almost every trade: base case, best case and worst case. Many risk frameworks extend this into 4 types of scenario analysis by adding a tail case, worth building before scheduled high-impact events.
| Case | What it represents | Typical use |
| Base case | The most likely move given recent conditions | Sets the expected outcome |
| Best case | A favourable move within reason | Sets the profit target |
| Worst case | An adverse move you can plausibly expect | Sets position sizing |
| Tail case | A rare, outsized move or gap | Sets maximum exposure |
Beyond four cases, the extra detail rarely changes the sizing decision. That decision is the only output that really matters.
Where Scenario Analysis Fits alongside Stop Losses and Position Sizing
A stop loss is an instruction. Scenario analysis is the reasoning that decides where the instruction should sit. The analysis produces the loss figure your stop is designed to cap.
It also sets the contract size that keeps that loss survivable. Your stop then enforces the plan when the market moves fast.
How To Run A Scenario Analysis On A CFD Position
What are the steps for scenario analysis? Five steps, run in order, take roughly ten minutes once the habit is formed.
Identify the Variable Driving Your Instrument
Every instrument has a dominant driver. Name it before you model anything.
- Currency pairs: interest rate expectations and central bank language
- Gold: real yields and the direction of the US dollar
- Indices: earnings, growth data and sentiment
Set Movement Ranges Based on Recent Volatility
Use the instrument’s recent behaviour rather than round numbers. Average True Range (ATR) over 14 periods gives a defensible starting point:
- Base case: roughly one average daily range
- Best and worst cases: roughly two average daily ranges
- Tail case: the largest move seen in the past 12 months
Widen every range when an event falls inside your holding period.
Convert Each Move into Profit and Loss at Your Contract Size
Multiply each move by your pip value or point value.
Here’s an illustrative example:
0.5 lots of EUR/USD, where one pip is worth roughly $5.
| Case | Move | Profit or loss |
| Best case | +90 pips | +$450 |
| Base case | +40 pips | +$200 |
| Worst case | -90 pips | -$450 |
| Tail case | -150 pips | -$750 |
Check Each Case Against Your Available Margin
A loss figure means nothing on its own. First, compare it with your free margin. Second, subtract each scenario loss from your account equity. Third, check whether the result still clears the margin close-out level.
If the worst case comes close, the position is too large.
Decide Your Action in Each Case before You Enter
Write the response down. A plan made under pressure is not a plan:
- Base case: hold or trail the stop
- Best case: take partial profit or exit
- Worst case: exit without negotiation
- Tail case: reduce total account exposure immediately
Modelling Margin Under Each Scenario
Margin is where leveraged accounts fail. Hence, this is where scenario analysis in CFD trading earns its keep.
How Unrealised Losses Reduce Free Margin
Unrealised losses reduce equity in real time. Used margin stays fixed, so free margin absorbs the whole hit. Equity falls with every adverse tick, but used margin does not.
Free margin shrinks toward zero. Once equity breaches the close-out level, positions are closed automatically.
Calculating the Move that Triggers a Margin Close-Out
Illustrative example:
A $5,000 account holding 1 lot of gold at $2,400 an ounce, at 1:200 leverage.
- Notional value: 100 ounces × $2,400 = $240,000
- Required margin: $240,000 ÷ 200 = $1,200
- Close-out level at 50% of used margin: $600
Equity can fall from $5,000 to $600, a loss of $4,400
Each $1 move in gold is worth $100, so the trigger is a $44 adverse move
A $44 move in gold is not a rare event. That is the warning the model exists to give you.
Using the Worst Case to Set Maximum Position Size
Run the same account at half the size and the picture changes completely.
| Position | Used margin | Loss capacity | Move to close-out |
| 1.0 lot | $1,200 | $4,400 | $44 |
| 0.5 lot | $600 | $4,700 | $94 |
If your worst case is a $60 drop in gold, one lot fails and half a lot survives with room to spare. The worst case chose the size, not your conviction.
How Scenario Analysis Compares with Related Risk Methods
These methods are often confusing. Each answers a different question.
Scenario Analysis and Sensitivity Analysis
Scenario analysis moves several variables together to build a coherent picture. Meanwhile, sensitivity analysis moves one variable at a time to isolate the dominant driver. Therefore, you can run sensitivity first, then build scenarios around what it reveals.
Scenario Analysis and Stress Testing
Scenario analysis models plausible outcomes. Stress testing models deliberately extreme ones. Stress testing asks whether the account survives, not whether the trade profits.
Scenario Analysis and Backtesting
Backtesting measures how a strategy is performed on historical data. Scenario analysis measures how one position behaves across possible futures. Backtesting looks backwards at a system, scenario analysis looks forwards at a trade.
Worked Examples Of Scenario Analysis In CFD Trading
The clearest scenario analysis in CFD trading example is a single position carried through a scheduled event. All figures below are illustrative.
A EUR/USD Position through a Central Bank Decision
A 0.5 lot long position entered at 1.0850, held through a rate decision.
- Hold rates, dovish tone: -40 pips, or -$200
- Hold rates, neutral tone: flat to +20 pips
- Hold rates, hawkish tone: +90 pips, or +$450
- Surprise cut with guidance change: -150 pips, or -$750
A Gold Position across a Shifting Rate Outlook
A 0.5 lot long position in gold entered at $2,400, where each $1 move is worth $50.
- Yields ease modestly: +$25, or +$1,250
- Yields hold steady: flat to +$8
- Yields rise sharply: -$30, or -$1,500
- Broad risk-off dollar rally: -$60, or -$3,000
An Index Position through Earnings Season
An illustrative index CFD position of 2 contracts at $2 per index point.
- Results broadly in line: ±70 points, or ±$280
- Sector-wide beat: +180 points, or +$720
- Sector-wide miss: -180 points, or -$720
- Overnight gap on a major constituent: -350 points, or -$1,400
Costs And Gaps That Scenario Models Often Miss
Scenario analysis in CFD trading that prices only movement understates the downside and overstates the upside.
Overnight Financing across Multi-Day Holding Periods
Overnight financing, or swap, accrues daily and compounds across longer holds.
Here’s an illustrative example:
On a $54,250 notional position charged at roughly 4% a year, the daily cost is around $5.95. Held for ten days, that is close to $60 before the market has moved at all.
- Add the daily charge to every case, not just the losing ones
- Multiply by your realistic holding period
- Recheck the model if you extend the hold
Spread Widening around Scheduled News Events
Spreads rarely stay at their quiet-market levels through a release. Model your entry and exit at a wider spread than you see now. Assume slippage on any stop triggered during a release. Treat quoted average spreads as a calm-market figure.
Weekend and Holiday Gap Exposure
Markets reopen where they choose, not where your stop sits. A stop does not guarantee an exit at your chosen level through a gap. Model the gap as a tail case, not as a base case. Reduce size before long weekends and public holidays.
Scenario Analysis Across Multiple Open Positions
Single-trade models can look safe while the account as a whole is fragile.
Why Correlated Positions Fail Together
Three separate trades can be one trade in disguise.
| Position | Direction | Shared exposure |
| Long EUR/USD | Short US dollar | US dollar strength |
| Long GBP/USD | Short US dollar | US dollar strength |
| Long AUD/USD | Short US dollar | US dollar strength |
A single dollar rally hits all three at once. Diversification by instrument is not diversification by risk.
Modelling Total Account Exposure Rather Than Single Trades
- Add every position’s worst case together, then express it as a percentage of equity
- Three positions at -$450 each is -$1,350, or 27% of a $5,000 account
- Assume correlated positions hit their worst case simultaneously
Setting an Account-Level Worst Case Limit
Choose a maximum combined drawdown, commonly 10% to 15% of equity. Refuse any new trade that pushes the combined worst case beyond it. Review the limit on a monthly basis rather than mid-trade.
Limitations Of Scenario Analysis In CFD Trading
The method is useful precisely because it is honest about what it cannot do.
Scenarios Describe Possibilities, Not Probabilities
One worst case is not a forecast. Assigning probabilities to your own scenarios invites false confidence. The value lies in the response you prepare, not the number you assign.
Historical Ranges Understate Tail Moves
Volatility regimes shift without warning. The largest move of the past year is not the largest move possible. Policy shocks and geopolitical events break historical ranges routinely.
A Model Is Only as Disciplined as the Trader Using It
A model ignored at the worst case has no value. Widening a stop mid-trade discards the work entirely. The discipline is the deliverable, not the spreadsheet.
Tools For Building CFD Scenarios
How to present scenario analysis matters as much as the arithmetic behind it. A model you cannot read in five seconds will be skipped when the market is moving.
Spreadsheet Models for Individual Traders
Build one reusable sheet and stop rebuilding it per trade:
- Columns: case, move, profit or loss, resulting equity, free margin
- Input cells for entry price, contract size and leverage
- A single traffic-light cell showing whether the worst case clears close-out
Platform Calculators for Margin and Position Value
Live platform figures keep the model tied to reality. Check required margin before entry, not after. Confirm pip and point values for the exact contract size. Verify swap rates on the instrument specification.
VT Markets supports both MetaTrader 5 and MetaTrader 4, so you can read live margin, swap and contract data straight from the platform and feed it into your sheet.
When a Simple Three-Case Model is Sufficient
Routine trades in normal conditions: three cases is enough. Scheduled events inside the holding period: add the tail case. Multi-position accounts: model at account level as well.
Frequently Asked Questions (FAQs)
Q1: What is scenario analysis in CFD trading?
Scenario analysis in CFD trading is the practice of calculating what happens to a position, and to your account margin, across a defined range of market moves before the trade is placed. Since CFDs are leveraged, a modest move in the underlying asset produces a much larger change in account equity. The exercise therefore focuses on margin impact as much as profit and loss.
Q2: How many scenarios should a CFD trader model?
Three is the practical standard: base, best and worst case. A fourth tail scenario is worth adding before scheduled high-impact events such as central bank decisions or earnings releases. Beyond four cases, the additional detail rarely changes the position sizing decision, which is the output that matters most.
Q3: Does scenario analysis prevent a margin call?
No. Scenario analysis identifies the price move that would trigger a margin close-out and lets you size the position so that move sits outside a plausible range. It does not prevent the close-out itself. Gap moves and volatility shocks can exceed any modelled range, which is why sizing matters more than the model.
Q4: Should scenario analysis include overnight financing costs?
Yes, for any position held beyond a single session. Overnight financing accrues daily and compounds across multi-day holds. A scenario that models only price movement will understate the loss in the worst case and overstate the gain in the best case, which is the wrong direction for a risk model to err.
Build The Scenario Analysis Habit With VT Markets
Scenario analysis in CFD trading is not a one-off exercise. It is a ten-minute routine that runs before every trade, and it is the clearest dividing line between traders who manage risk and traders who discover it.
Start small. Build the three-case sheet, check every worst case against your free margin, and let that number choose your position size. Add the tail case before scheduled events, including swap costs on anything held overnight, and total your exposure across every open position.
With VT Markets, access trading conditions, product specifications and MetaTrader 4 and MetaTrader5 platforms to plan your trades across forex, gold, indices and more.
Create a live VT Markets account today to access our platform features, including market insights and educational content.








