






Key Points
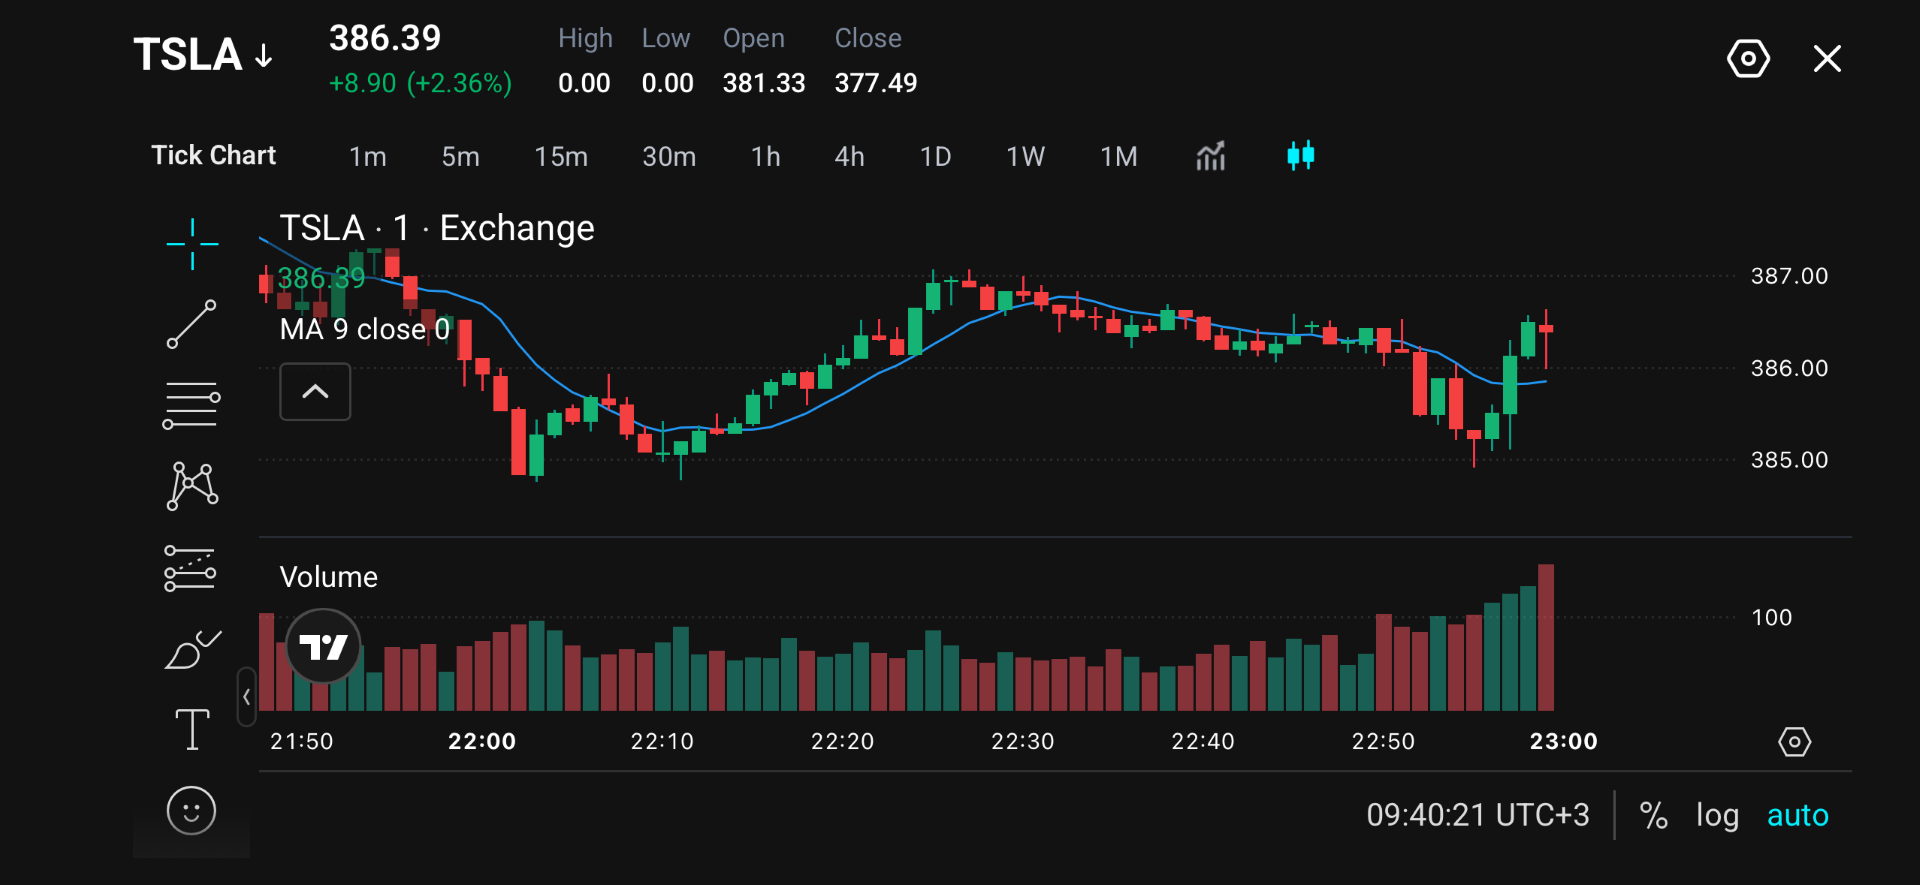
- Tesla initially fell to approximately $373.62 after hours, down 3.3% from its regular-session close of $386.47, before rebounding to $386.39 on the latest chart.
- Q3 revenue was broadly flat at $28.05 billion, while adjusted earnings of $0.48 per share exceeded expectations of approximately $0.45.
- Net income attributable to common shareholders declined 43% to $787 million, despite automotive gross margin excluding regulatory credits improving to 18.1%.
- The latest chart places immediate resistance around $386.40–$386.60, with support near $384.80–$385.00.
Market Move
Tesla recovered towards its regular-session closing price after an initial post-earnings sell-off. Shares fell approximately 3.3% to $373.62 after hours on Wednesday, October 21, from a closing price of $386.47.
The latest session shows Tesla trading at $386.39, price rebounded from around $385 and moved back above its nine-period moving average. The recovery suggests that buying interest returned after the initial negative reaction. However, price remained below the visible intraday highs around $387, leaving traders watching whether the rebound could develop into a sustained breakout.
Why Traders Are Watching
Tesla’s results offered competing signals. Revenue reached $28.05 billion, while adjusted earnings of $0.48 per share exceeded expectations of approximately $0.45. However, net income attributable to common shareholders fell 43% to $787 million as higher operating expenses weighed on profitability.
Automotive gross margin excluding regulatory credits improved to 18.1%, supported by product mix and growing Full Self-Driving (FSD) subscription revenue. This provided a positive signal for the automotive business, although the improvement was insufficient to offset broader earnings pressure.
Cash generation also exceeded expectations. Tesla reported $1.53 billion in free cash flow, compared with forecasts of an outflow, as quarterly capital expenditure came in at approximately $4.73 billion. Free cash flow nevertheless remained below its year-earlier level.
Tesla also lowered its full-year capital expenditure outlook to approximately $20 billion from around $25 billion. Lower spending could help preserve cash, but it raises questions about the timing of investment in AI infrastructure and new products. Together, these developments leave traders assessing whether Tesla can strengthen profitability while advancing its programmes. Clearer commercial milestones could help determine whether buying interest proves sustainable.
Key Trading Levels
| Level | Technical Role | Significance |
| $387.00–$387.30 | Upper resistance | Repeated highs mark the upper boundary of the displayed range. |
| $386.40–$386.60 | Immediate resistance | The latest rebound encountered selling pressure around this area. |
| $385.80–$386.00 | Near-term pivot | A recent recovery area, with the nine-period moving average ending nearby. |
| $384.80–$385.00 | Immediate support | Repeated intraday lows show where buyers previously stepped in. |
The recovery through $385.80–$386.00 places this zone at the centre of the immediate technical picture. Holding above it would indicate that price remains supported near the short-term moving average.
Repeated buying around $384.80–$385.00 defines the lower boundary of the visible range. Above the current price, $386.40–$386.60 marks the nearest obstacle, followed by the higher resistance cluster around $387.00–$387.30.
Bullish and Bearish Setups
| Scenario | Confirmation to Watch | Potential Target | Invalidation Signal |
| Bullish continuation | A sustained break above $386.60 followed by a successful retest | $387.00–$387.30 | A reversal below $385.80–$386.00 |
| Bearish reversal | Rejection near resistance followed by a sustained break below $385.80 | $385.00, then $384.80 | A recovery and hold above $386.60 |
The bullish scenario depends on Tesla breaking above $386.60 and holding this level during a subsequent retest. This would suggest buyers are maintaining control of the rebound, potentially opening the way towards resistance at $387.00–$387.30. A reversal below $385.80–$386.00 would weaken the setup by signalling that the recovery is losing momentum.
The bearish scenario develops if Tesla encounters selling pressure near resistance and then breaks below $385.80. This could bring $385.00 into focus, followed by $384.80, where buyers previously supported the price. A sustained recovery above $386.60 would weaken the bearish case and indicate renewed buying strength
Disclaimer
The price levels and market scenarios above reflect the author’s assessment at the time of writing. They do not represent financial advice or an official recommendation from VT Markets. Traders should conduct their own analysis and manage risk carefully.
Tesla Prediction: What Could Drive It Up or Down Next?
Tesla’s near-term outlook depends on whether the recovery attracts sustained buying and whether upcoming developments strengthen confidence in future earnings. Clearer Robotaxi and Cybercab milestones, progress towards Optimus commercialisation and continued FSD subscription growth could support sentiment. Further evidence that Tesla can preserve automotive margins while generating revenue would also strengthen the case for a more stable recovery.
On the other hand, execution delays, renewed pressure on vehicle pricing or a decrease in profitability could weaken market confidence. Lower capital spending may also concern investors if it signals that important growth projects will take longer to scale. Potential SpaceX merger developments remain another catalyst.
Any market impact would depend on the proposed structure and implications for Tesla shareholders, with discussions alone offering no certainty that a transaction will proceed.
Trade Tesla with VT Markets
Trade Tesla’s price movements through share CFDs with VT Markets, with opportunities to take long or short positions without owning the underlying shares.
With VT Markets, traders can follow market movements and use technical tools to assess price trends, support and resistance levels, and changing momentum.
Start a live trading account with VT Markets and gain access to advanced trading tools and daily market insights. Discover a wide range of assets including stocks, indices, gold and more.
Frequently Asked Questions
Why did Tesla initially fall after its Q3 earnings?
The adjusted earnings beat was accompanied by weaker reported profit and uncertainty about future investment. These concerns weighed on the initial market reaction.
Has Tesla recovered from the post-earnings decline?
The latest session shows Tesla at $386.39, close to its previous regular-session close of $386.47, following the after-hours decline to $373.62.
What are Tesla’s immediate support and resistance levels?
Support levels are around $384.80–$385.00, with a near-term pivot at $385.80–$386.00. Resistance stands around $386.40–$386.60, followed by $387.00–$387.30.
What would confirm a stronger Tesla rebound?
A sustained move above immediate resistance, followed by a successful retest and a challenge of the upper resistance zone, would strengthen the short-term recovery signal.
What could move Tesla shares next?
Robotaxi and Cybercab rollout updates, Optimus development, FSD subscription growth and potential SpaceX merger developments could influence the next move.
Start trading now — click here to create your real VT Markets account.



