


The Stock Market is a Reflection of Expectations
At its core, the stock market is not a scoreboard of what is happening today. It reflects what investors believe will happen next.
When stock prices rise, it usually means investors expect stronger growth, improving profits, or more supportive financial conditions ahead. When prices fall, it often reflects uncertainty, disappointment, or changing assumptions about the future.
This forward-looking nature explains why markets can rise during difficult economic periods or fall even when current data appears strong.
Supply and Demand Drive Price Movement
Every stock price is determined by supply and demand.
When more people want to buy a stock than sell it, prices move higher. When sellers outnumber buyers, prices fall. This balance shifts constantly as new information enters the market.

Source: Bloomberg
The S&P 500 index shows how price movements reflect shifts in investor expectations over time.
News events, earnings reports, economic releases, and policy decisions all influence whether investors feel confident or cautious. Even small changes in sentiment can affect demand and move prices.
Economic Data Shapes Market Direction
Economic indicators play a key role in stock market movements.
Data such as inflation, employment, and economic growth help investors assess whether conditions are improving or deteriorating. Strong data can support higher stock prices by reinforcing confidence in growth. Weak data can lead to declines if it raises concerns about slowing demand or profits. Explore latest economic events here.
However, markets do not react to data in isolation. They react to how the data compares to expectations.
Interest Rates Matter More Than Many Realise
Interest rates influence the attractiveness of stocks compared to other investments.
Periods of rising rates have often coincided with tighter financial conditions, higher borrowing costs, and more pressure on valuations. Conversely, extended periods of falling or low rates have tended to support asset prices by making future earnings more valuable and capital cheaper to access.
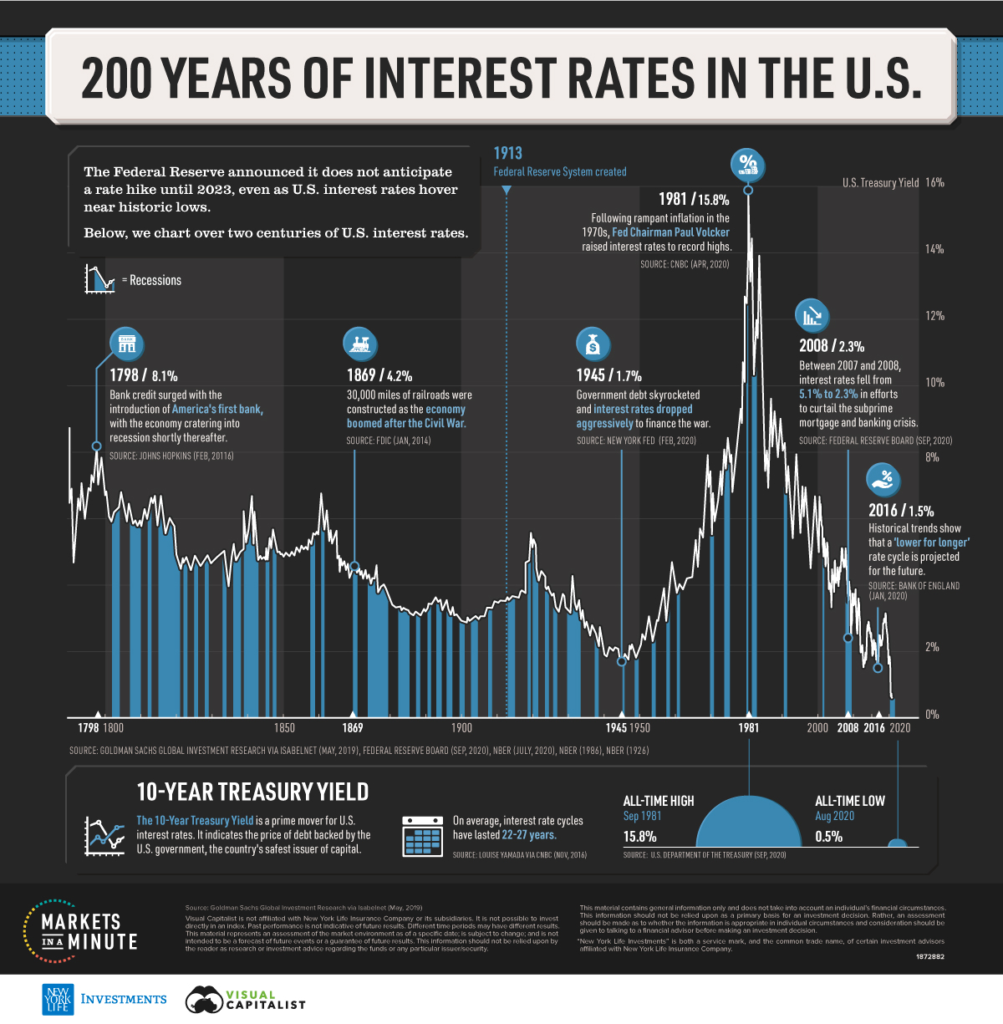
Source: Advisor Channel by Visual Capitalist
One of the most striking features of the chart is how extreme rate environments tend to cluster around major economic shifts. The sharp peak in the early 1980s reflects an aggressive policy response to runaway inflation, while the prolonged decline that followed shows how rates gradually moved lower as inflation stabilised and growth models evolved.
More recently, the long stretch of near-zero rates on the right highlights how extraordinary policy settings evolved in response to financial crises and economic shocks.
For stock markets, these shifts matter because interest rates act as a reference point for everything else. They influence how companies finance growth, how investors value future profits, and how attractive stocks appear relative to safer assets.
Even when rates do not change, expectations about where they are heading can move markets sharply. Explore how expectations unfold in the market news with VT Market’s Market Buzz.
This is why commentary from institutions like the Federal Reserve often triggers market swings. Investors are not reacting only to today’s rate level, but to how it fits into a much longer historical cycle.
The chart reinforces that rate environments can persist for years, meaning market behaviour often reflects anticipation rather than immediate impact.
Understanding this broader context helps explain why stock prices can rise or fall rapidly around interest rate discussions.
Markets are constantly reassessing whether conditions are becoming more supportive or more restrictive, and history shows that those assessments have long-lasting consequences.
Earnings Tell a Story About Confidence
Company earnings are one of the most direct drivers of stock prices.
When companies report stronger-than-expected profits or provide optimistic guidance, stock prices often rise. When results disappoint or outlooks weaken, prices tend to fall.
Importantly, a stock can decline even after strong earnings if investors believe future growth may slow. Once again, expectations matter more than headlines.
Emotion and Psychology Still at Play
Markets are not driven solely by numbers, it is influenced by people.
Fear, optimism, confidence, and uncertainty all influence decision-making. During periods of strong confidence, investors may be willing to take more risk, pushing prices higher. During periods of stress, even small concerns can lead to selling.
These emotional cycles help explain why markets sometimes overshoot in both directions.
Volatility is a Market Rhythm
Price swings are not a sign that something is broken. They are a normal part of how markets function.
The stock market continuously adjusts to new information. As expectations change, prices follow. Periods of calm reflect consensus. Periods of volatility reflect disagreement and reassessment.
Understanding this helps investors view market moves as part of a process rather than a problem.
The Bigger Picture
The stock market ebbs and flows because expectations change. Economic data evolves. Interest rates shift. Companies perform differently than expected. Human behaviour responds to uncertainty.
Taken together, these forces create movement. Over time, markets tend to reflect economic growth and innovation. In the short term, they reflect emotion and interpretation.
Recognising this balance can help investors approach the stock market with clearer expectations and greater perspective.
Learn more about trading on VT Markets.


