





Key Takeaways
- A doji candle forms when the opening and closing prices of a trading period are virtually identical, producing a thin, cross-like shape on candlestick charts.
- The doji candlestick pattern is widely regarded as a neutral pattern signalling market indecision; doji represents indecision between buyers and sellers rather than a guaranteed bullish reversal or bearish reversal.
- Common types of doji include the dragonfly doji, gravestone doji, long-legged doji, and the rare four-price doji.
- A doji signal becomes far more useful when traders assess potential trend reversals with confirmation candle follow-through, other technical indicators, volume, and the prevailing trend — not in isolation.
- In 2026, the global technical analysis software market is projected to reach roughly US$7.13 billion, underlining just how central candlestick-based tools like the doji remain to modern financial markets.
- Traders should treat every doji formation as a prompt to wait for a confirmation candle before acting, rather than jumping in the moment a doji appears alone.
Doji Candle Meaning Exposed: The One Candlestick Pattern That Could Warn You Before the Market Turns
Every trader remembers the first time a chart stopped them in their tracks — a strange little cross-shaped candle sitting where a normal bullish or bearish candle should be. That candle is the doji, and understanding what it really means could be the difference between reacting to the market and anticipating it.
This guide breaks down everything you need to know about the doji candlestick pattern — from its basic anatomy to the different types, how it fits into a broader trading strategy, and what 2026’s market data tells us about its reliability. Written for beginners and seasoned chartists alike, this is your evergreen reference for one of the oldest tools in technical analysis.
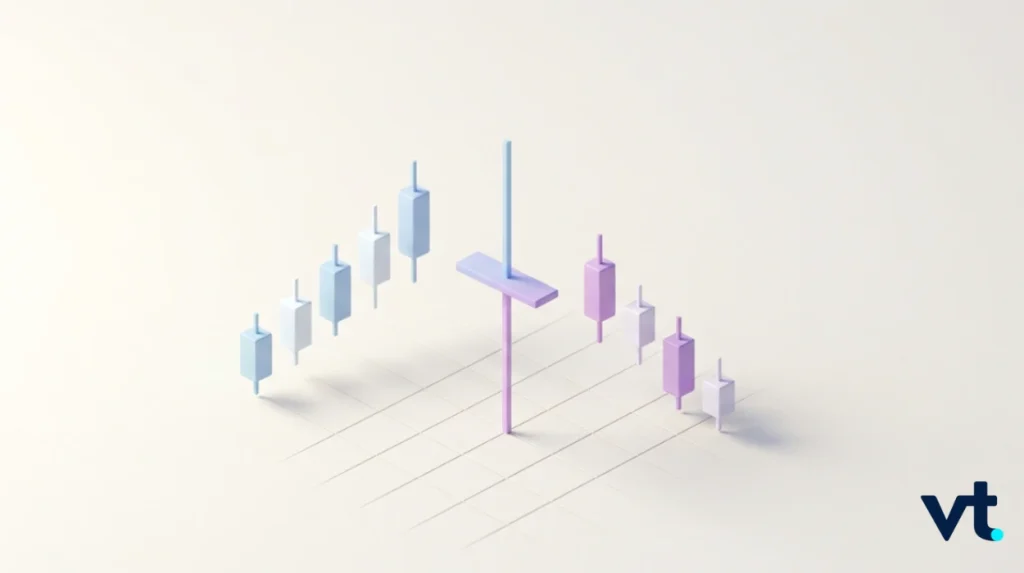
What Is a Doji Candle? Understanding the Doji Candle Meaning
In candlestick charts, every single candle tells a short story about the tug-of-war between buyers and sellers during a specific trading period. The doji candle’s meaning centres on one simple fact: the open and close of that period landed at, or extremely close to, the same price point, which can also hint that the prior move is losing momentum.
Unlike a strong bullish candle or bearish candle, which shows a clear winner in that battle, a doji shows a stalemate. Neither side could push the price meaningfully away from where it started. This is why a doji candlestick is so often described as representing market indecision — in other words, doji represents indecision because buyers and sellers effectively cancelled each other out over that trading period.
Because the body is so small (sometimes almost invisible), a doji pattern can be mistaken for a spinning top at first glance. The difference between a doji and a spinning top comes down to body size relative to the shadows: a doji’s body is a thin line, while a spinning top has a small but visible body with upper and lower shadows on either side.
The Anatomy of a Doji Candlestick
To really grasp how a doji forms, it helps to break the candle down into its component parts.
| Component | What It Shows |
|---|---|
| Open | The price at the start of the trading period |
| Close | The price at the end of the period – nearly identical to the open in a doji |
| Long upper shadow | The highest price reached before sellers pushed it back down |
| Lower shadows | The lowest price reached before buyers pushed it back up |
| Body | The thin rectangle between open and close is minimal in a standard doji |
Because the opening and closing prices sit so close together, the doji candlestick appears as little more than a cross or a plus sign on the price chart. The length of the upper shadow and lower shadows tells you how far the price actually travelled during the session before snapping back – a useful read on the period’s price movement when judging the strength of the doji signal.
Types of Doji: Not All Doji Candles Are the Same
While the classic doji is defined by a tiny body, there are several distinct types of doji, each carrying a slightly different nuance in what it might suggest about market sentiment.
Dragonfly Doji
A dragonfly doji forms when the open, high, and close are all bunched near the top of the candle’s range, leaving a long lower wick beneath it. This shape suggests that sellers drove price down during the session, but buyers stepped back in with enough conviction to bring it right back up to where it opened.
When a dragonfly doji forms after a sustained decline, some traders view it as a hint of a possible bullish reversal and a possible trend reversal, since it can reflect fading selling pressure. That said, it is a neutral pattern by design, so confirmation and context still matter — the significance really depends on where it appears relative to support or resistance.
Gravestone Doji
The mirror image of the dragonfly, a gravestone doji has its open, low, and close clustered near the bottom of the range, with a long upper shadow or long upper wick stretching above it. This shape, sometimes nicknamed the “inverted cross”, implies that buyers pushed price higher during the session, only for sellers to drag it all the way back down.
Gravestone doji candles appearing after a prolonged uptrend are often watched closely, as the long upper wick can hint that the prior advance may be losing momentum and can precede a price reversal if confirmed—though, again, this is not a certainty and should be treated as one input among many technical indicators.
Long-Legged Doji
A long-legged doji candle has unusually extended upper and lower shadows on both sides of a tiny body, showing that price swung significantly in both directions before settling back near the open. This particular doji formation is often the clearest expression of pure market indecision, since both bulls and bears had their moment but neither could hold control. Among the various doji candlestick forms, traders often watch this setup for potential trend reversals when it appears after a strong move.
Four Price Doji
Rare in liquid markets, the four-price doji occurs when the open, high, low, and close are all the same value, producing a completely flat horizontal line rather than a cross. It typically appears during extremely thin trading, such as public holidays or pre-market sessions, and is generally treated as a low-information candle rather than a meaningful reversal pattern.
Is a Doji Candlestick Bullish or Bearish?
This is one of the most searched questions in technical analysis, and the honest answer is: it depends. A doji is fundamentally a neutral pattern — it does not carry an inherently bullish or bearish bias on its own. What matters is the context in which the doji candlestick appears.
| Context | Possible Interpretation |
|---|---|
| Doji forms after a strong uptrend | May hint at a bearish reversal or pause in buying |
| Doji forms after a bearish trend’s decline. | May hint at a bullish reversal or pause in selling |
| Bullish doji (dragonfly, at support) | Slight bullish tilt if confirmed |
| Bearish doji (gravestone, at resistance) | Slight bearish tilt if confirmed |
| Doji in a sideways range | Usually just confirms ongoing consolidation |
Whether a doji suggests a bullish or bearish move next largely hinges on the prevailing trend, the market trend heading into the candle, and whether a confirmation candle follows in the expected direction, as traders use that context to judge the chance of a possible trend reversal. On its own, a doji star or single doji candle pattern is simply a pause button – a moment where buying and selling pressures reached equilibrium.
Doji Candles vs Other Candlestick Patterns
Candlestick pattern analysis includes dozens of formations, and it’s worth knowing where the doji sits among them.
- Marubozu – a candle with almost no wicks, showing total control by one side; the near-opposite of a doji.
- Spinning top – similar to a doji but with a slightly larger visible body.
- Hammer/hanging man has a small body like a doji but with one long shadow and clear directional bias once confirmed.
- Doji star – a two-candle setup where a doji gaps away from the prior candle’s body, often seen as a stronger potential reversal signal than a standalone doji.
Compared with other candlestick patterns, the doji is unusual in that it is defined entirely by its indecisive body rather than a directional shape, which is exactly why it pairs so well with other technical indicators like RSI, moving averages, or volume for trend confirmation.
2026 Market Statistics and Doji Reliability
Candlestick charts have a long history, tracing back to 18th-century Japan, and they remain a cornerstone of modern financial market analysis. According to recent industry data, the global technical analysis software market is projected to reach approximately US$7.13 billion in 2026, reflecting how deeply candlestick-based tools — including doji recognition — are now embedded in both retail platforms and institutional systems.
Broader pattern-reliability research also reinforces a key point for anyone learning technical analysis: studies on candlestick accuracy have found that pattern reliability tends to improve noticeably — by roughly 10–15% in some analyses — when a formation like a doji is read together with market context, support or resistance zones, and volume, which traders use to confirm potential trend reversals rather than trading a doji in isolation. This lines up with what most experienced traders already believe: a doji signal is a prompt to pay closer attention, not an automatic trade trigger.
How to Use a Doji Candle Pattern in a Trading Strategy
A doji candle pattern works best as part of a broader trading strategy, not as a standalone signal. Here’s a practical approach:
- Identify the prevailing trend – Is the market in a strong uptrend, a decline, or a range? Context shapes what the doji might mean, and after an extended move it can suggest the trend is losing momentum.
- Locate the doji relative to support or resistance – A doji appears with more significance at a key support or resistance level than in the middle of nowhere.
- Wait for the next candle – The next candle after a doji often acts as the confirmation candle, confirming whether a trend reversal, continuation, or possible trend reversal is more likely.
- Cross-check with other technical indicators – Combine the doji pattern with RSI, moving averages, or volume for a fuller picture of market sentiment.
- Define risk before entering – Because a doji reflects market indecision, price can move sharply in either direction once it resolves.
A Quick Note on Caution
As with any tool in technical analysis, it’s worth keeping a few precautions in mind:
- A doji is a neutral pattern, not a guarantee — treat it as one clue among many, not a standalone trading decision.
- False signals can occur, particularly around major news events or in thin, low-liquidity sessions such as the four price doji scenario.
- Leveraged CFD trading carries capital risk, and past candlestick pattern performance is not a reliable indicator of future results.
- It’s generally advisable to combine doji candlestick analysis with sound risk management, such as stop-loss orders, rather than relying on a single candle pattern alone.
Start Online CFD Trading with VT Markets Today
If you are ready to put your understanding of the doji candle meaning to work in live markets, VT Markets provides access to tools and platforms to help you get started. Trade on powerful platforms like MetaTrader 4 (MT4) and MetaTrader 5 (MT5), designed for speed, reliability, and advanced trading features — exactly what you need when a doji candlestick appears, financial markets move fast, and stock price action signals indecision.
New to trading? Practise risk-free with a VT Markets demo account before committing to a live account — ideal for simulating reactions to candlestick pattern formations like the doji across currency pairs, indices, and commodities without financial risk.
Open your live account with VT Markets today and access secure, transparent, and competitive CFD trading across some of the world’s most popular markets.
Frequently Asked Questions About the Doji Candlestick
1. What does a doji candlestick pattern actually mean?
A doji candlestick pattern means the opening and closing prices for that trading period were nearly equal, reflecting market indecision between buyers and sellers rather than a confirmed directional move.
2. Is a doji candlestick bullish or bearish?
By itself, a doji is a neutral pattern — it isn’t inherently bullish or bearish. Whether it leans toward a bullish reversal or a bearish reversal depends on where it appears within the prevailing trend and whether the next candle confirms a move.
3. What is the difference between a dragonfly doji and a gravestone doji?
A dragonfly doji has a long lower wick with little to no upper wick, hinting at rejected selling pressure. A gravestone doji is the reverse, with a long upper shadow and little lower wick, hinting at rejected buying pressure.
4. Can a doji candle pattern be used alone for a trading strategy?
It’s generally not recommended. A doji signal works best when combined with other technical indicators, support or resistance levels, and a confirmation candle, rather than being used as a standalone basis for successful trading.








