






Key Points
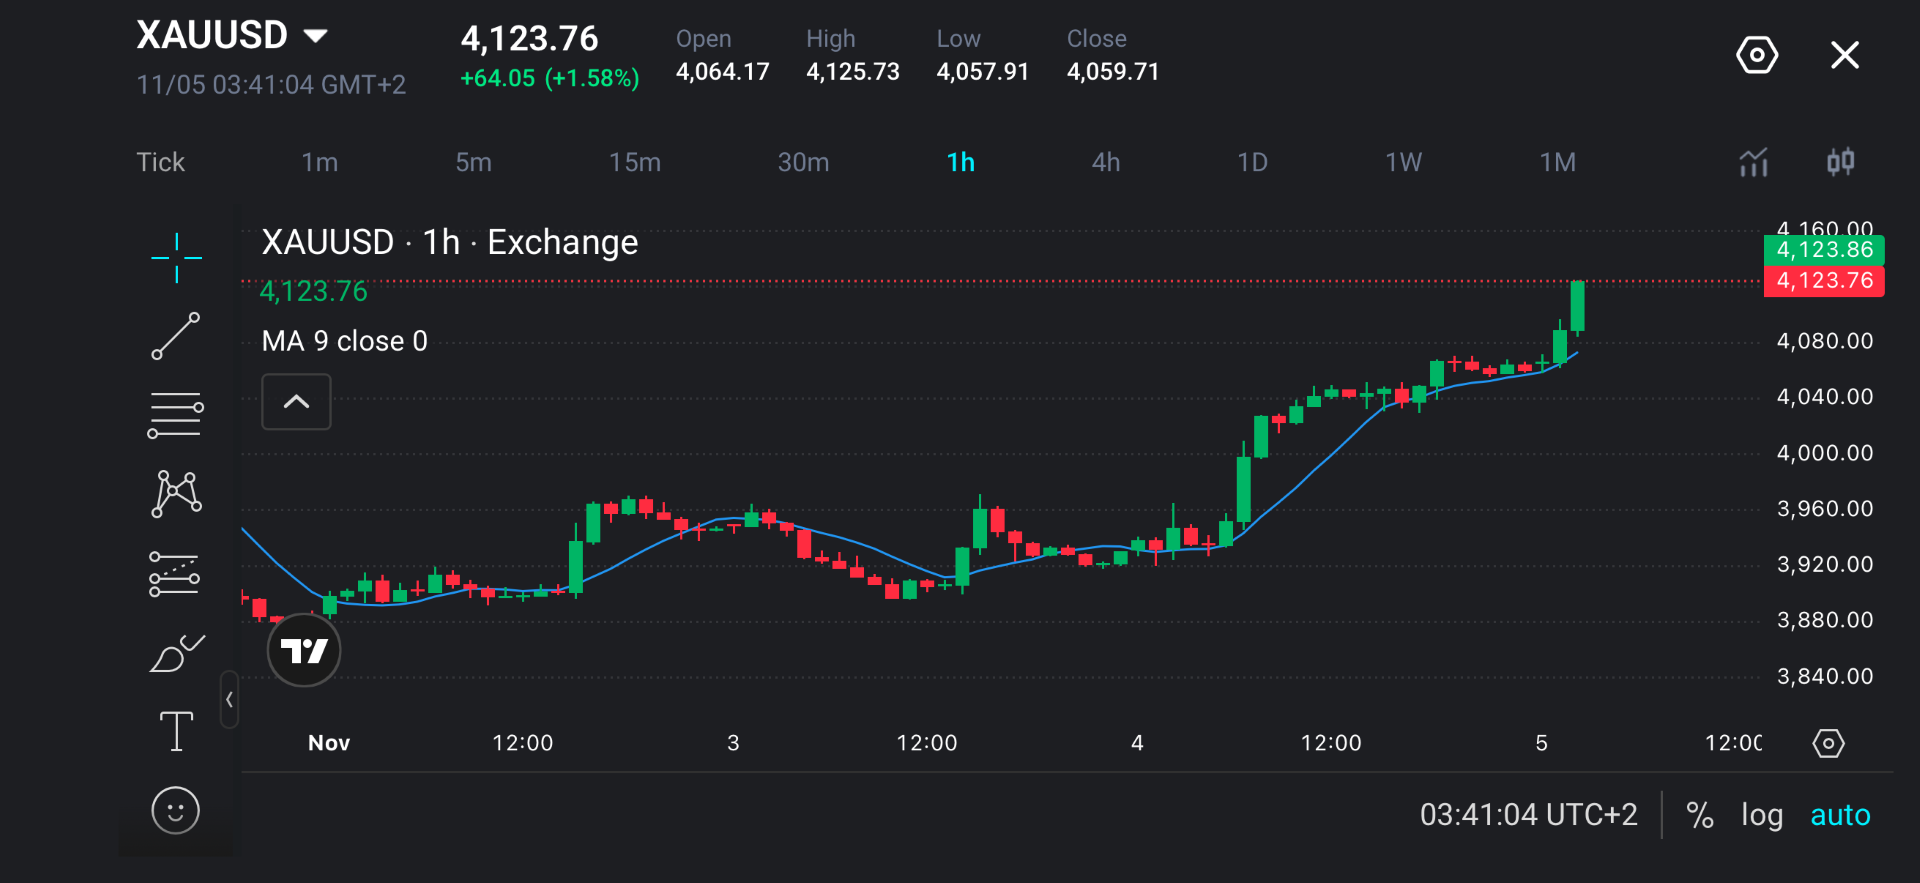
- Gold traded at $4,123.76 in its latest session, up 1.58%, with a high of $4,125.73.
- Democratic victories in both chambers of Congress prompted investors to reassess the US fiscal outlook.
- $4,060–$4,080 forms the first support area, while $4,000 remains a broader psychological threshold.
- A softer dollar and falling treasury yields have supported the demand for gold.
- US Non-Farm Payrolls, Treasury yields and Fed rate expectations could determine whether the rally continues.
Market Move
Gold extended its recovery on 5 November, moving through $4,114 and trading near $4,124 after reclaiming the $4,000 psychological level. The metal reached a high of $4,125.73, with prices up roughly 1.58%.
The rise followed Democratic victories in the US midterm elections, securing majorities in both the House of Representatives and the Senate for the incoming Congress. Investors reassessed expectations for spending and tax legislation under a divided government, while the dollar and Treasury yields declined.
Dollar weakness made gold less expensive for buyers using other currencies, while lower yields reduced the opportunity cost of holding the non-yielding metal. Together, these developments helped gold build on its recovery and extend gains above $4,100.
Why Traders Are Watching
Traders are assessing whether the election-driven recovery can continue as attention returns to economic data. The divided government could constrain fiscal expansion. However, its effect on inflation will depend on the policies enacted.
Falling oil prices add to the picture. Energy price declines could ease headline inflation and reduce pressure for further monetary tightening. However, lower oil alone does not drive the Fed’s decision, as wage growth and domestic demand remain firm.
The next major market driver is the October US employment report, scheduled for 6 November. Payroll growth, unemployment, wage gains and revisions could influence Treasury yields and interest rate expectations.
Key Trading Levels
| Level | Role | Significance |
| $4,160 | Upside reference | Next visible round-number reference above the rally. |
| $4,125–$4,130 | Immediate resistance | Includes the displayed $4,125.73 high and nearby breakout threshold. |
| $4,100 | Near-term pivot | Holding here on a pullback would support the latest advance. |
| $4,060–$4,080 | Initial support | Recent consolidation and breakout area beneath the final push higher. |
| $4,030–$4,040 | Secondary support | Earlier consolidation following the recovery above $4,000. |
| $4,000 | Psychological support | Important threshold for the broader recovery. |
| $3,940–$3,960 | Lower support | Prior trading area before the sharp advance through $4,000. |
Gold is experiencing higher highs and higher lows, with price above a rising nine-period moving average. This supports a bullish short-term bias, although the sharp advance leaves room for consolidation.
Holding $4,060–$4,080 would preserve the latest breakout structure. A sustained move below this area would increase the risk of a deeper retracement towards $4,030–$4,040 and $4,000.
Bullish and Bearish Setups
| Scenario | Trigger | Potential Levels |
| Bullish continuation | Sustained break above $4,125–$4,130, followed by support holding on a retest. | $4,150, then $4,160 |
| Bullish pullback | Bullish price action around $4,060–$4,080, followed by a recovery above $4,100. | $4,125–$4,130, then $4,150 |
| Bearish rejection | Failure around $4,125–$4,130, followed by a break below $4,100. | $4,080, then $4,060 |
| Bearish continuation | Sustained break below $4,060 and failure to reclaim the area. | $4,030–$4,040, then $4,000 |
A bullish setup would develop if the price makes a sustained break above $4,125–$4,130, followed by a successful retest. This could support further gains towards $4,150–$4,160. Alternatively, bullish price action around $4,060–$4,080 and a recovery above $4,100 could bring the recent high back into focus.
A bearish scenario would develop if the price faces rejection around $4,125–$4,130, a break below $4,100 could lead to a pullback towards $4,080–$4,060. A sustained move below $4,060, followed by failure to reclaim it, could extend losses towards $4,030–$4,040, then $4,000.
Disclaimer
The price levels and market scenarios above reflect the author’s assessment at the time of writing. They do not represent financial advice or an official recommendation from VT Markets. Traders should conduct their own analysis and manage risk carefully.

Gold Prediction: What’s Next?
US jobs data will be the next major catalyst. Gold could move higher if data disappoints, prompting Treasury yields and the dollar to fall as traders reduce expectations for further Fed tightening. Sustained declines in oil prices could also ease inflation concerns and support this outlook.
Gold could move lower if payrolls or wage growth exceed expectations, reinforcing the case for tighter monetary policy and lifting yields and the dollar. Profit-taking after the sharp rally could also add pressure.
Trade Gold with VT Markets
Gold remains one of the most actively monitored markets as traders assess changes in inflation expectations, interest-rate outlooks and global risk sentiment.
With VT Markets, traders can monitor XAUUSD price action alongside USDX, forex, indices and other global CFD markets.
This flexibility allows traders to monitor how gold responds to major market drivers, including inflation data, central bank policy expectations and movements in the US dollar.
Explore all Gold products at VT Markets Trade Gold CFDs | Trade Gold 24/7 | Open account today
Frequently Asked Questions (FAQs)
Why are gold prices rising?
Gold’s rebound has been supported by a weaker US dollar and lower Treasury yields following the US midterm elections, improving the appeal of non-yielding bullion.
How could Democratic control of Congress affect gold?
Investors are assessing whether a divided government could restrain fiscal expansion and borrowing. Gold could benefit if that outlook keeps yields and the dollar lower, although the effect depends on enacted policy.
Why is $4,000 important for gold?
It is a major psychological threshold reclaimed during the rally. Holding above it would help preserve the broader recovery, although nearer support sits around $4,060–$4,080.
What resistance levels should gold traders watch?
Immediate resistance is around $4,125–$4,130. A sustained break could bring $4,150 and $4,160 into focus as prospective upside references.
How could US Non-Farm Payrolls affect gold?
Weaker employment data could support gold if yields and the dollar fall. Stronger data could pressure prices if it raises expectations for tighter monetary policy.
Could gold fall despite its recent rally?
Yes. A dollar rebound, rising yields or profit-taking could interrupt the advance. A sustained break below $4,060 would increase the risk of a pullback towards $4,040 and $4,000.
Start trading now — click here to create your real VT Markets account.



